University of Southern Queensland
Faculty of Engineering and Surveying
A validation of the model for effluent disposal using land
irrigation (MEDLI).
A dissertation submitted by
Mark Lowry
In fulfilment of the requirements of
Courses ENG4111 and ENG4112 Research Project
towards the degree of
Bachelor of Engineering (Honours) (Civil)
I
Abstract
Biological waste produced by intensive livestock farming is a valuable and useful product used in the agricultural industry for irrigation of crops. Manure and liquid effluent contains nutrients that can be effectively utilised in commercial cropping of livestock feed. It provides farmers with a low cost organic material and fertilizer, resulting in high yielding crops if carefully managed. The downside of using effluent in crop irrigation is the potentially high concentrations of chemicals and pathogens in effluent can, if mismanaged, reach toxic levels in the soil. This can lead to crop failure and in worst cases, land and water contamination.
It is a requirement of Queensland law that before an enterprise irrigates with effluent it must first obtain a regulation certificate. To fulfil this obligation an effluent irrigation scheme must be designed and modelled to the satisfaction of the regulatory authority. There are tools available which aid the designer of the effluent irrigation scheme in conducting water and nutrient balances. The software package recommended by the Queensland Government is; The Model for Effluent Disposal using Land Irrigation (MEDLI). The purpose of this program is to model; effluent volumes, concentrations of chemical constituents in effluent, point of deposition soil chemistry and nutrient uptake by plants.
Due to the absence of previously completed program validation, this research aimed to conduct validation of MEDLI software. Modelling scenarios were entered into the program using input variables that had been established from data collected from three beef cattle feedlots. Scenarios were set-up to try and best mimic site conditions, so a comparisons could be drawn between the simulated and observed datasets.
II
University of Southern Queensland
Faculty of Health, Engineering and Sciences
ENG4111/ENG4112 Research Project
Limitations of Use
The Council of the University of Southern Queensland, its Faculty of Health, Engineering & Sciences, and the staff of the University of Southern Queensland, do not accept any responsibility for the truth, accuracy or completeness of material contained within or associated with this dissertation.
Persons using all or any part of this material do so at their own risk, and not at the risk of the Council of the University of Southern Queensland, its Faculty of Health, Engineering & Sciences or the staff of the University of Southern Queensland.
III
University of Southern Queensland
Faculty of Health, Engineering and Sciences
ENG4111/ENG4112 Research Project
Certification of Dissertation
I certify that the ideas, designs and experimental work, results, analyses and conclusions set out in this dissertation are entirely my own effort, except where otherwise indicated and acknowledged.
I further certify that the work is original and has not been previously submitted for assessment in any other course or institution, except where specifically stated.
Mark Lowry
IV
Acknowledgments
Firstly, I would like to acknowledge and thank my academic supervisor Dr Malcolm Gilles, his time and guidance has been an asset to me throughout this research project.
I would also like to acknowledge Dr Simon Lott, for his valuable knowledge, experience and assistance which helped in the development of my understanding in aspects of the project. In addition, he provided access to the MEDLI software and field datasets which were integral to completing the research project.
I would also like to acknowledge my colleagues at WaterBiz and the team at EnviroAg Australia for their support and expertise.
V
Table of Contents
Abstract ... I Acknowledgments ...IV List of Figures ... VIII List of Tables ... IX
Chapter 1 INTRODUCTION ... 1
1.1 Project Overview ... 1
1.2 Background ... 2
1.3 Project Objectives ... 3
1.4 Assessment of Consequential Effects ... 4
Chapter 2 LITERATURE REVIEW ... 5
2.1 Introduction ... 5
2.2 Effluent Irrigation ... 5
2.2.1 Effluent Production... 6
2.2.2 Current Feedlot Practices... 7
2.2.3 Environmental Implications ... 9
2.2.4 Site Establishment ... 11
2.2.5 Effluent Utilisation ... 14
2.3 Legislation, Regulation and Guidelines for Land Application of Effluent ... 15
2.4 Overview of Soil Nutrients & Soluble Salts ... 17
2.4.1 Soil Nutrients ... 17
2.4.2 Carbon in Soils ... 18
2.4.3 The Nitrogen Cycle... 18
2.4.4 Potassium ... 20
2.4.5 Phosphorus ... 20
2.4.6 Sulphur Magnesium & Calcium ... 22
2.4.7 Ion Exchange & pH... 22
2.4.8 Soluble Salts ... 23
2.4.9 Mechanisms Controlling Nutrient Mobility... 24
2.5 Water and Nutrient Uptake in Plants ... 25
2.6 Conclusion... 27
Chapter 3 MEDLI ANALYSIS ... 28
3.1 Introduction ... 28
VI
3.2.1 Climate Data ... 30
3.2.2 Waste Estimation and Pre-treatment ... 30
3.2.3 Pond Chemistry and Water Balance ... 31
3.2.4 Irrigation Scheduling and Effluent Shandying ... 32
3.2.5 Soil Water Movement ... 33
3.2.6 Nitrogen and Phosphorus Availability and Movement ... 37
3.2.7 Soil Salinisation ... 38
3.2.8 Plant Growth and Transpiration ... 40
3.2.9 Ground Water Transport ... 42
3.2.10 Pathogen Risk Assessment ... 42
3.2.11 Pond Size and Irrigation Area Optimisation ... 43
3.2.12 Run Configuration ... 43
3.2.12 MEDLI Validation ... 44
3.3 Conclusion... 44
Chapter 4 METHODOLOGY ... 45
4.1 Overview ... 45
4.2 Compiling Datasets ... 45
4.3 Development of MEDLI Inputs ... 46
4.3.1 Scenario 1 ... 47
4.3.2 Scenario 2 ... 52
4.3.3 Scenario 3 ... 55
4.4 Statistical Analysis ... 58
Chapter 5 RESULTS ... 60
5.1 Scenario 1 ... 60
5.2 Scenario 2 ... 65
5.3 Scenario 3 ... 67
5.4 Interpretation of Results ... 70
5.4.1 Summary of results ... 70
5.4.2 Modelling Problem Analysis ... 71
5.5 MEDLI Sensitivity Analysis ... 73
Chapter 6 DISCUSSION ... 77
6.1 Accuracy Assessment Background ... 77
6.2 MEDLI Performance Evaluation ... 77
6.2.1 General Evaluation ... 78
6.2.2 Model Error Evaluation ... 78
VII
Chapter 7 CONCLUSION... 81
7.1 Research Conclusion... 81
7.2 Future Research ... 82
REFERENCES ... 83
Appendix A - Project Specification ... 89
Appendix B - Environmental Protection Act (excerpt) ... 90
Appendix C - Results Data ... 91
VIII
List of Figures
Figure 2.1 - Feedlot Controlled Drainage Area (MLA, 2012) ... 8
Figure 2.2 - The Effect of Soil pH on Phosphorus Mobilisation ... 21
Figure 3.1 - Structural Schematic of MEDLI (DSITI, 2016) ... 29
Figure 3.2 - Schematic of Pond Inputs and Outputs (Casey, Atenzi, 1998) ... 32
Figure 3.3 - CN Curve (Beecham, Vieritz, Littleboy, 1998) ... 34
Figure 3.4 - CN2base Reduction Factor (Beecham, Vieritz, Littleboy, 1998) ... 35
Figure 3.5 - Stage 1 and 2 Evaporation (Beecham, Vieritz, Littleboy, 1998) ... 36
Figure 5.1 - Scenario 1 Measured & Simulated Pond Chemistry ... 61
Figure 5.2 - Scenario 1 Regression Analysis of Pond Nitrogen ... 61
Figure 5.3 - Scenario 1 Regression Analysis of Pond Phosphorous ... 62
Figure 5.4 - Scenario 1 Regression Analysis of Pond Total Dissolved Solids ... 62
Figure 5.5 – Scenario 1 measure and Simulated Soil Chemistry ... 64
Figure 5.6 - Scenario 2 Measured and Simulated Pond Chemistry... 66
Figure 5.7 - Scenario 3 Measured and Simulated Pond Chemistry... 68
Figure 5.8 - Scenario 3 Measured and Simulated Soil Chemistry ... 69
Figure 5.9 - Combined Scenarios Harvest Properties ... 71
Figure 5.10 – Pre-treatment Sensitivity Analysis of Effluent Pond ... 74
Figure 5.11 – Pre-treatment Sensitivity Analysis of Soil Nutrients ... 75
Figure 5.12 – Anaerobic Pond Chemistry Sensitivity Analysis of Effluent Pond ... 76
Figure D.1 - Hazard Identification Source:... 94
Figure D.2 – Level of Risk Source: ... 95
Figure D.3 - Personal Hazard Identification Source: ... 96
IX
List of Tables
Table 2.1 - Typical constituents of effluent in beef cattle feedlots (Qld DPI, 1994) ... 7
Table 2.2 - Limiting Soil Properties for Effluent Irrigation Sites (NSW DPI, 2003) ... 13
Table 2.3 - Soil Nutrient Categorisation (Singer and Munns, 2006) ... 17
Table 4.1 - Scenario 1 Initial Setup ... 47
Table 4.2 - Scenario 1 Waste Estimation ... 48
Table 4.3 - Scenario 1 Pre-treatment ... 48
Table 4.4 - Scenario 1 Pond System ... 49
Table 4.5 - Scenario 1 Pump & Shandy ... 50
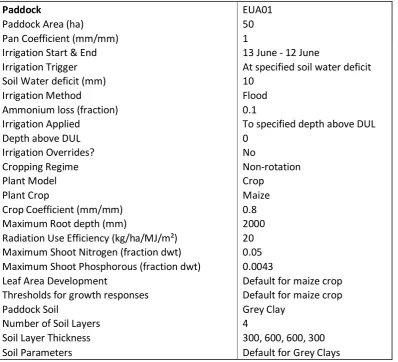
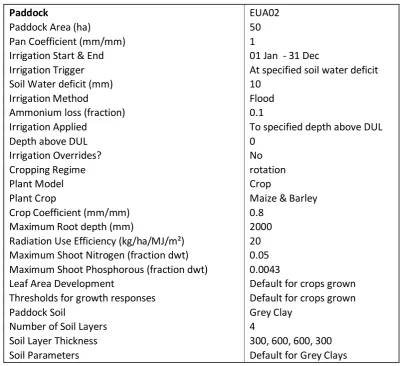
Table 4.6 - Scenario 1 Paddock ... 51
Table 4.7 - Scenario 1 Pathogen Risk Assessment & Ground Water ... 51
Table 4.8 - Scenario 2 Initial Setup ... 53
Table 4.9 - Scenario 2 Waste Estimation ... 53
Table 4.10 - Scenario 2 Pre-treatment ... 53
Table 4.11 - Scenario 2 Pond System ... 54
Table 4.12 - Scenario 2 Paddock ... 55
Table 4.13 - Scenario 3 Initial Setup... 55
Table 4.14 - Scenario 3 Waste Estimation & Pre-treatment Error! Bookmark not defined. Table 4.15 - Scenario 3 Pond System ... 56
Table 4.16 - Scenario 3 Paddock ... 57
Table 5.1 - Scenario 1 - Pond Chemistry Comparison ... 60
Table 5.2 - Scenario 1 Soil Chemistry Comparison ... 63
Table 5.3 - Scenario 1 Harvest Properties Comparison... 64
Table 5.4 - Scenario 2 Pond Chemistry Comparison ... 66
Table 5.5 - Scenario 2 Harvest Properties Comparison... 67
Table 5.6 - Scenario 3 Pond Chemistry Comparison ... 69
Table 5.7 - Scenario 3 Harvest Properties Comparison... 70
Table 5.8 - Sensitivity Analysis Pre-treatment Inputs ... 73
Table 5.9 - Sensitivity Analysis Pond System Inputs ... 73
1
Chapter 1
INTRODUCTION
1.1
Project Overview
A common industry practice for dealing with biological effluent from intensive livestock farming is to use the effluent in irrigation of cropping fields. Typically, during a rainfall event, effluent flows from stock holding yards to a sewage/stormwater reticulation system before entering a sedimentation system. The sedimentation system allows for heavy entrained solids to settle from the brine and the remaining effluent flows down an open channel and collects at a terminal holding pond. This effluent can then be applied to a specified waste utilisation area through normal irrigation practices.
The Queensland Government Department of Environment and Heritage Protection are responsible for the regulation of effluent disposal through land irrigation in the state of Queensland. Specifically, the regulator requires that proposed wastewater disposal through land irrigation is modelled in terms of three main stages of the process; storage, treatment and disposal. The aim of the modelling is to determine a water and nutrient balance using expected water/effluent volumes and mathematical algorithms to simulate nutrient retention values. This then determines a suitable size of irrigated land area for the disposal of the effluent. The modelling tool that is recommended by the Queensland Government is; The Model for Effluent Disposal using Land Irrigation (MEDLI).
2
1.2
Background
Effluent from feedlots can contain high and varying levels of nutrients, salts, organic matter and metals. It is for this reason that effluent is used for land irrigation, as the constituents within the effluent will be taken up by crops that are grown in the irrigation area. It is common industry practice to plant high yielding crops in waste utilisation areas to achieve high exchange rates from soil to plants (MLA, 2012). Compounds deposited in soils which are not utilised by the crop or found in excessive concentration are of particular interest when designing and monitoring an effluent irrigation scheme. Irrigation schedules need to be managed so that quantities of any particular compound do not reach contamination levels, creating risk of environmental degradation to the irrigation and surrounding areas or waterways. To achieve this, understanding of effluent quality is essential so that decisions can be made about the need for treatment or dilution of the wastewater.
Effluent quality refers to the concentration of the constituents in wastewater. The level of concentration can be reduced through shandying the effluent with overland water collected from outside the controlled drainage area (CDA) or bore water. Treatment of the effluent may also be a requirement if a particular constituent is considered in high concentration. Sweeten (n.d.) suggests the limiting factors on effluent application rates in beef cattle feedlots are typically, high concentrations of nitrogen, sodium and other soluble salts such as potassium and chloride.
3 The management plan employed for effluent land irrigation is relative to the existing type and quality of soil and the grown crops potential to uptake soil compounds. Best practice for managing effluent utilisation areas is baseline and subsequent ongoing monitoring.
1.3
Project Objectives
The objective of this research project is to;
Evaluate if MEDLI simulated predictions are accurate compared with observed
data collected from the field in the areas of;
1. Stored effluent chemical properties,
2. Nutrients in the soil; and
3. crop yields and harvested nutrients
4
1.4
Assessment of Consequential Effects
The potential consequences of this project itself on the health and safety of people directly involved are very minimal. As this is a desktop study, and datasets collected from the field are retrospective there is almost no chance that any person or the environment would be adversely effected by the research project.
The effects that outcomes of this research may have on the feedlot industry are somewhat dependent on the final results that are presented and the traction that those result gain in the industry. It is the intention of this project to establish if a gap exists between real-world data and predicted data from the MEDLI program. If results indicate accuracy of the program in all areas to be analysed, then this will simply add validity to software that has already been used in industry for eighteen years.
5
Chapter 2
LITERATURE REVIEW
2.1 Introduction
The beef cattle feedlot industry in 2012 had a production value of $2.7billion and has since seen considerable growth. With the rising global demand in the market this production is expected to see continued growth in the future (MLA, 2012). Increasing consumer demand for beef has lead to a significant growth in the feedlotting industry. The number of intensive beef cattle feedlots have increased in the last two decades with total head of cattle increasing from two hundred thousand in 1995 to almost one million in 2015 (ALFA, 2015). An increase in intensive production methods has seen a corresponding rise in intensified effluent outputs. To avoid environmental degradation caused by concentrated levels of nutrient and salts found in effluent being disposed into natural waterways; feedlots are designed with controlled drainage areas (CDA). A CDA is a restricted stormwater catchment area within the feedlot which captures all runoff and associated effluent. Pre-treatment of the effluent occurs in a sedimentation system which aims to remove solids from the effluent. The sedimentation system is drained periodically and the solids are collected and transported to a storage area to undergo natural decomposition. The decomposed material is either utilised on-site or sold as a commercial product. The effluent that passes through the sedimentation system is stored in a holding pond where it undergoes further treatment such as; aerobic and anaerobic moralisation, volatilisation, shandying and liming. If the effluent is to be disposed through irrigation this can only take place after treatment processes.
The purpose of this literature review is to establish current effluent production practices, treatment, disposal and the regulation of the intensive beef cattle feedlot industry. In addition, it will investigate factors which influence the amount of effluent that can be safely applied to soils.
2.2 Effluent Irrigation
6 2.2.1 Effluent Production
Since the focus of this research is on the beef cattle industry, an overview of effluent production within a typical beef cattle feedlot will be presented. The constituents of effluent are dependent on; cattle breed, type of ration provided, drinking water quality, stocking density, climatic conditions, pen cleaning practice and the amount of time effluent has been stored.
Different cattle breeds and feedlot operators have preferential ration requirements and this leads to different nutrient and salt outputs. The former Department of Primary Industries (DPI) (2000), guidelines advise that regular site specific sampling of effluent in the holding pond (if available) is preferred over using mass balance or empirical data for irrigation scheduling. Over a period of time, ranges for nutrient, salt and pH can be established of the particular site and used to advise appropriate shandying and irrigation application rates. The guidelines state that, at a minimum the following tests should be conducted on the effluent;
pH
Total Kjeldahl Nitrogen Ammonium Nitrate Total Phosphorus Inorganic Phosphorus Potassium
Sodium Absorption Ratio Electrical Conductivity
7
Table 2.1 - Typical constituents of effluent in beef cattle feedlots (Qld DPI, 1994)
Parameter Units Average Range
Total Kjeldahl Nitrogen mg/L 764 440 - 890
Ammonium Nitrogen mg/L 550 220 – 816
Nitrate Nitrogen mg/L 0 Not Detected
Total Phosphorus mg/L 81 50 – 101
Inorganic Phosphorus mg/L 30 -
Potassium mg/L 2053 1290 – 2800
Chloride mg/L 2475 1991 – 2996
Acidity/Alkalinity - 7.6 7.4 – 7.7
Electrical Conductivity dS/m 13.6 12.5 – 16.2
Sodium Absorption Ratio - 16.1 10.0 – 22.0
The data collected was from sites that utilise high salt bore water and may not be representative of data that would be expected at other feedlots.
2.2.2 Current Feedlot Practices
8
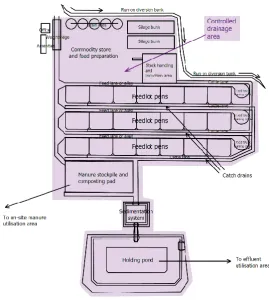
Figure 2.1 - Feedlot Controlled Drainage Area (MLA, 2012)
Through civil earth works and drainage design the effluent produced at a feedlot can be almost entirely contained from surrounding land. As suggested in the MLA National Guidelines (2012), the drainage system is typically designed to an average reoccurrence interval (ARI) of 20 years.
Pre-treatment of effluent occurs in the sedimentation system. Three types of systems typically used in the beef cattle feedlot industry have been defined as;
1. Sedimentation basins 2. Sedimentation terraces 3. Sedimentation ponds
9 From the sedimentation system the effluent progresses to either an evaporation system or a holding pond for further treatment. An evaporation system is a legacy means of dealing with effluent through evaporation only and is not now considered best industry practice. A holding pond stores effluent while it undergoes natural or induced treatment before application to land via irrigation. Naturally, aerobic and anaerobic microorganisms mineralise nutrients in the effluent which creates a more favourable product for land application. Induced treatment may be in the form of shandying, mixing in ‘clean’ water to reduce concentrations of nutrients and salts or treating acidic effluent with calcium carbonate (CaCO3) to increase pH closer to neutrality.
A holding pond, in addition to being designed to an ARI of 20 years should be able to contain the balance of runoff from a 90 percentile wet year. This balance should be calculated using the average monthly evaporation loss and losses from irrigation. Software such as MEDLI are used as an aid to determine this water balance given the complexities of how much volume can be applied to the irrigation site. Methods other than MEDLI have been developed to calculate water balances for feedlots such as the; standard tabulated method (DPI, DNR, 1994), and site specific modelling using accepted hydrological practices.
The water balance of a feedlot is significantly impacted by the rate at which effluent can be applied to land. However, the limiting factor to effluent irrigation is typically the nutrient and salt balance with in the soil of the designated irrigation area. Capital investment in land and irrigating infrastructure is a factor which designers endeavour to minimise for their clients hence maximum application rates to minimal land area is pursued.
2.2.3 Environmental Implications
The benefits of the effluent irrigation are the reuse of water by sustainably managed means and the beneficial use of the nutrients to improve soil condition and growing capacity. The soil improvement benefits are only applicable up to a nutrient loading rate specific to the soil type and the crops which are being grown (Skerman,2000).
10 land unusable. Testing on effluent is required by state regulators to ensure it does not contain unacceptable levels as presented in the Guidelines for Agricultural Land Evaluation in Queensland (2013). Environmental Best Practice Guidelines for the Red Meat Processing industry (MLA,2006) outline possible adverse environmental impacts from improper effluent irrigation as;
excessive nutrient accumulation in soils odour emissions from poorly treated effluent surface runoff from over-irrigation
excessive salt accumulation in soils; and damage to the soil structure
Effluent from feedlots can contain high and varying levels of nutrients, salts, organic matter and metals. It is for this reason that effluent is used for land irrigation, as the constituents within the effluent will be taken up by crops that are grown in the irrigation area. It is common industry practice to plant high yielding crops in waste utilisation areas to achieve high exchange rates from soil to plants (MLA, 2012). Compounds deposited in soils which are not utilised by the crop or found in excessive concentration are of particular interest when designing and monitoring an effluent irrigation scheme. Irrigation schedules need to be managed so that levels of any particular compound do not reach contamination levels creating risk of environmental degradation to the irrigation and surrounding areas or waterways. By restricting application rates, the effluent can largely be prevented from entering natural waterways. To prevent excessive nutrient loading in soils, understanding of effluent quality is essential so that decisions can be made about the need for treatment or dilution of the wastewater (MLA, 2006)
Effluent quality refers to the concentration of the constituents in wastewater. The level of concentration can be reduced through shandying the effluent with overland water collected from outside the CDA or bore water. Treatment of the effluent may also be a requirement if a particular constituent is considered in high concentration. Sweeten (n.d.) suggests the limiting factors on effluent application rates in beef cattle feedlots are typically, high concentrations of nitrogen, sodium and other soluble salts such as potassium and chloride.
11 ponds and holding ponds as sludge and stockpiled to allow decomposition. Manure contains high levels of nutrient, salts and other compounds (much higher than effluent) however it also has a high percentage of organic material which as previously stated increases the exchange capacity and general structural quality of soils. Excessive amounts of organic matter in soil can lead to degradation of soil quality. Reduced soil aeration and exclusion of aerobic based microbes are symptoms of soils overly laden with organic matter (Skerman, 2000). If manure is to be used on the cropping field it is of absolute importance that this be considered in the modelling of nutrient and salt balance for the effluent disposal scheme design.
The management plan employed for effluent land irrigation is relative to the existing type and quality of soil and the grown crops potential to mobilise soil compounds. Best practice for managing effluent utilisation areas is baseline and subsequent ongoing soil monitoring (DEC, 2003).
2.2.4 Site Establishment
The factors that require consideration for an appropriate effluent irrigation site are; climatic conditions, topography, soil suitability, proximity to surface and ground water and nearby neighbours. It is advisable that excess ponding of effluent be avoided as this can lead to a nutrient concentration in the soil at the point of ponding and an increased risk of ground water contamination (MLA, 2006). It is for this reason the DPI (1994) recommend a well graded uniform slope for effluent irrigation. MLA (2006), advise that a slope of up to ten percent is suitable, however grades over two percent may require the implementation of erosion control measures and catch drains. Slope grades between one and three percent are considered ideal.
12 MEDLI
Effluent Irrigation Reuse Model (ERIM) PERFECT
WASTLOAD
Soil that has not previously been contaminated, eroded, degraded or has any other restriction to healthy plant growth is recommended. Before a land area can be classified as an effluent utilisation area it should first undergo soil testing to establish any limitations of the soil which may affect its ability to accept effluent. In addition, initial testing can form a baseline for monitoring soil condition in the future after effluent irrigation has commenced. Surface layers and sub-surface soils should be tested as percolation of effluent into sub surface soil horizons can have impacts on crop health and ground water contamination levels (Swanson, Linderman, Ellis, 1974). Soil to be used as an effluent irrigation area should have good permeability, deep profile, moderate to slightly acidic pH, non-cracking clayey loam, be well structured and have suitable ionic condition (Skerman, 2006). The NSW DPI provides Table 2.2 as a guideline to the limitations of a soil to have effluent applied.
Table 2.2 describes sodicity measured in exchangeable sodium percentage (ESP). This is a measure presented as a percentage used to compare the amount of sodium (Na) in soil. The equation for ESP is;
𝐸𝑆𝑃 = 𝑁𝑎
∑ 𝐶𝑎 + 𝑀𝑔 + 𝐾 + 𝑁𝑎× 100
Soil that produces values of ESP above 6 percent are considered to be sodic (Tan, 2010).
Total salinity of a soil is typically measured in electrical conductivity (EC). The EC of soil is obtained by passing a current between two electrodes which penetrate the soil to the desired depth of measure. A greater concentration of dissolved salts in the soil solution will produce higher EC values (Tan, 2010).
13
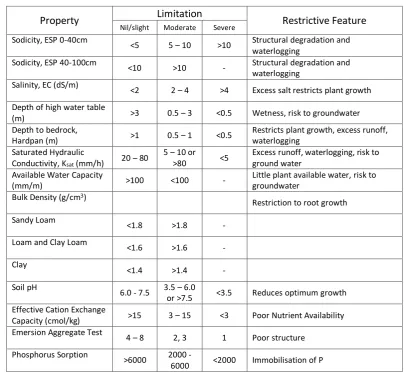
Table 2.2 - Limiting Soil Properties for Effluent Irrigation Sites (NSW DPI, 2003)
Property Limitation Restrictive Feature
Nil/slight Moderate Severe
Sodicity, ESP 0-40cm
<5 5 – 10 >10 Structural degradation and waterlogging
Sodicity, ESP 40-100cm
<10 >10 - Structural degradation and waterlogging
Salinity, EC (dS/m)
<2 2 – 4 >4 Excess salt restricts plant growth
Depth of high water table
(m) >3 0.5 – 3 <0.5 Wetness, risk to groundwater
Depth to bedrock,
Hardpan (m) >1 0.5 – 1 <0.5
Restricts plant growth, excess runoff, waterlogging
Saturated Hydraulic
Conductivity, Ksat (mm/h) 20 – 80
5 – 10 or >80 <5
Excess runoff, waterlogging, risk to ground water
Available Water Capacity
(mm/m) >100 <100 -
Little plant available water, risk to groundwater
Bulk Density (g/cm3)
Restriction to root growth
Sandy Loam
<1.8 >1.8 -
Loam and Clay Loam
<1.6 >1.6 -
Clay
<1.4 >1.4 -
Soil pH
6.0 - 7.5 3.5 – 6.0
or >7.5 <3.5 Reduces optimum growth Effective Cation Exchange
Capacity (cmol/kg) >15 3 – 15 <3 Poor Nutrient Availability Emersion Aggregate Test
4 – 8 2, 3 1 Poor structure
Phosphorus Sorption
>6000 2000 -
6000 <2000 Immobilisation of P
Existing surface and groundwater streams should be identified that may be impacted by applications of effluent to nearby land. A groundwater table that has a maximum height within half a meter of the natural ground level will typically be deemed unsuitable by the governing regulator. If the effluent utilisation area is located in close proximity to a creek which is feeding, or is in the catchment of, a municipal drinking water supply, the regulators are likely to impose very strict runoff and infiltration restrictions. It may or may not be financially viable to comply with these restrictions and a different location may need to be sort. Irrigation sites near to surface water bodies may require catch drains and contour banks to direct stormwater runoff to an amenable location. Direct runoff of effluent irrigation water should be controlled by suitable irrigation management practices, over application may have detrimental consequences to both the irrigation site and waterways (MLA, 2006).
14 is likely to impact the surrounding area, buffer zones will need to be put in place to elevate the risk. The spread of odour should be modelled prior to site selection and design of appropriate buffer zones undertaken. Proximity and prevailing winds will typically be considered during planning and actions such as site location and vegetated buffers can be manipulated to find a favourable solution to the impacts of odour to surroundings.
2.2.5 Effluent Utilisation
When effluent is applied to a cropping field, a net removal of nutrients takes place through plant uptake if the harvest is removed from site. If the crop is not removed from the site and/or used for cattle grazing, most of the nutrient will be recycled back to the soil. This scenario is not conducive to an effluent disposal scheme. It should always be the objective of an effluent disposal schedule to balance the nutrient and salt inputs with the harvested crop removed from site. This will reduce the chances of large quantities of nutrients and salts migrating below the root zone and into groundwater bodies. Whilst the soil acts as a significant sink for nutrient and salts it is the goal of designers not to rely on this as an aid, as this would ultimately be considered unsustainable (DPI, 1994).
At the core of any decision on the viability of an effluent reuse program is whether it is sustainable. No accumulation of substances in the soil should be allowed to reach toxic levels, thus it would be considered unsustainable land use. The environmental Best Practice Guidelines (MLA, 2006), state that the fate of all nutrients added to the soil will fall within one of the following categories;
absorption of soluble nutrients and uptake by plants assimilation into the soil structure by micro-organisms leaching in to the sub strata and possibly ground water relocation by erosion
fixation to exchange sites
formation of immobilised compounds and; loss to the atmosphere through volatilisation.
15 almost no nitrate the other 30 percent is organic form nitrogen. Once in the soil some of the ammonium will be nitrified to nitrate which is highly mobile providing benefit to the crop but risk to the surrounding environment. Guidelines state that to minimise the potential for environmental contamination; the volume of total N applied to the crop should not exceed the N content of the harvested crop plus the storage capacity of the soil plus atmospheric losses. (Skerman, 2000).
Phosphorus (P) in effluent is found in both organic and inorganic forms. The P in effluent typically accounts for 6 percent of the total P excreted by the animals. The remainder being in the manure. If applications of manure are to be applied to crops in addition to effluent irrigation than this must be considered whilst modelling the nutrient balance. Organic P once delivered to the soil will be readily mineralised to orthophosphate and available to the crop. Inorganic P is not available for plant uptake as it is typically bound to compounds of iron, aluminium or calcium. The concentrations of these ions dictate the soils ability to sorb phosphorus. The solution concentration of orthophosphate and total inorganic P available to be sorbed in the soil is called the adsorption isotherm. This is the soils ability to ‘take up’ phosphorus (Skerman, 2000). Governing regulators will typically require a phosphorus sorption test be carried out on the proposed site prior to approval of the program. The test will produce a phosphorus sorption isotherm which provides an indication of the total phosphorus which can be sorbed by the soil (MLA, 2006).
2.3 Legislation, Regulation and Guidelines for Land Application of Effluent
The Queensland Government Department of Environment and Heritage (formally the Environmental Protection Agency, EPA), is the regulatory body responsible for ensuring compliance with environmental legislation in Queensland. It is this Department that is responsible for assessing applications of effluent disposal schemes through land irrigation.
16 the authority for a representative of the Department of Environment and Heritage to issue a registration certificate.
In addition to the Act, other documents such as the; Environmental Protection Regulation 2008, Queensland Guidelines for the Safe Use of Recycled Water and Establishment and Operation of Beef Cattle Feedlots are documents that regulators may use to guide certification decisions. These same documents are all available for land holders and design consultancies.
The document that underpins all state legislation and regulation in effluent reuse is the; Guidelines for Sewage Systems - Effluent Management. This publication is a sub section of The National Water Quality Management Strategy produced by the Australian Government Department of Environment and Energy (1997). It sets out (but is not limited to) a national framework for effluent irrigation practices. The Guidelines for sewage systems establish the principles of land applications with effluent as;
“The build-up of any substance in the soil should not preclude
sustainable use of the land in the long term
The effluent is not detrimental to the vegetative cover
Any change to the soil structure should not preclude the use of the land
in the long term
Any runoff to surface waters or percolation to groundwater should not
compromise the agreed environmental values
No gaseous emissions to cause nuisance odour”
These principles serve as a guide for state authorities to develop their own legislative requirements (MLA, 2006).
17
2.4 Overview of Soil Nutrients & Soluble Salts
This section aims to provide an overview of soil characteristics which are pertinent to the utilisation of effluent in cropping fields. This includes an overview of the essential nutrients and salts found in soil and their role in plant growth. It is not the purpose to present here, an exhaustive review of soil science, but to establish current understanding of the mechanisms which effect nutrient and salt mobilisation and immobilisation.
2.4.1 Soil Nutrients
Nutrients are inorganic ions which are essential to the growth of plants. These nutrients are absorbed by the plant and assimilated in to the plant structure forming the fibrous tissue which makes up all parts of the plant. Healthy plants can obtain the essential compounds carbon (C), oxygen (O) and hydrogen (H) from the atmosphere and water applications respectively, through the process of photosynthesis. All other nutrients required for the plants growth must be obtained from the soil. The 14 nutrients absorbed from soil are classified in two categories; macronutrients and micronutrients (Table 2.3).
Table 2.3 - Soil Nutrient Categorisation (Singer and Munns, 2006)
Macronutrients Micronutrients
Nitrogen (N) Iron (Fe)
Potassium (K) Chlorine (Cl)
Phosphorus (P) Manganese (Mn)
Magnesium (Mg) Zinc (Zn)
Sulphur (S) Copper (Cu)
Calcium (Ca) Silicon (Si)
Boron (B) Molybdenum (Mo)
The difference between the two groups of nutrients is the quantities in which they are required by the plant. The macronutrients are found in plants in much greater concentrations than are micronutrients (trace elements). It is the macronutrients that are of importance when considering nutrients in terms of effluent irrigation. Specifically, the role of nitrogen, phosphorus and potassium will be addressed further in subsequent sections.
18 these micro-organisms release CO2 and nutrients previously held in cells to the humus where it can be taken up by plants. The CO2 released will provide other organism with carbon compound requirements (Singer and Munns, 2006).
2.4.2 Carbon in Soils
Organic material derived from plants typically contain high levels of carbohydrates. Woody, fibrous or husky green residues in particular can supply soils with bulk carbohydrate. The significance is, during decomposition aerobic micro-organisms utilise carbohydrate and oxygen in respiration and produce carbon dioxide as a by-product. Some carbon dioxide is lost to the atmosphere through diffusion however, when compared with atmospheric concentrations carbon dioxide can be held in soil air at much higher ratios. A high carbon dioxide concentration is closely associated with a lowering of soil pH. The formation of carbonic acid increases availability of hydrogen (H+) ions in the soil thus promotes acidification. The role of soil pH will be considered further in section
2.4.7. Ion Exchange & pH.
Animal manure and urea possess lower amounts of carbohydrate but are higher in nitrogen content. The carbohydrates that are present will be quickly decomposed by micro-organisms because they form simple compounds which are more readily used in energy production by aerobic organisms. Applications of animal waste to soil will create a surplus of nitrogen making nitrogen ions available to plants.
The carbon nitrogen ratio (C/N ratio) is a measure used to determine the relative rate of decay in soils and subsequent levels of free nitrogen ions. A high C/N ratio means high concentrations of carbon relative to nitrogen. This situation increases the dependence of microbes on free nitrogen ions in the soils which they assimilate, decreasing the nitrogen available to plants. The opposing situation; a low C/N ratio, mobilises free nitrogen ions due to the abundance of nitrogen when compared to available carbon i.e. there exists a nitrogen surplus in the soil (Singer and Munns, 2006).
2.4.3 The Nitrogen Cycle
19 process but can also be synthesised by human intervention to form synthetic fertiliser. Natural fixation occurs through rainfall and the bacteria (Rhizobia) that live in soil and root nodules of leguminous plants which fix nitrogen directly from the atmosphere and deposit it in humus through decomposition.
Water holds soluble nitrogen as Nitrate (NO3-), when water is applied to crops it can be taken up directly by plants. This converts the nitrate to organic nitrogen which are the building blocks of plant cells. Once a plant is harvested or dies the residue in the soil will be assimilated to ammonium (NH4+) by soil organisms. Aerobic organisms assimilate nitrogen to ammonium through nitrogen mineralisation which is a by-product of decomposing organism cells. Ammonium can then be re-assimilated by plants and micro-organisms to produce new organic nitrogen compounds. The preferred form of nitrogen for uptake by plants is nitrate, due to the plenitude and mobility of the soluble form. This localised soil nitrogen cycle is not perpetual as significant losses do occur to the total nitrogen cycle.
Nitrogen loss in the soil occurs in small part by volatilisation. Urea (CH4N2O) present in synthetic fertilisers and animal effluent is converted to gaseous form ammonia (NH3) by bacteria in soils which possess the enzyme urease; it is at that point lost to the atmosphere (Singer & Munns, 2006).
Far greater loses of nitrogen can be attributed to the soluble phase of nitrogen. Nitrate is lost through natural migration and seepage of water through ground or surface pathways. If found in high concentrations nitrate can cause acute degradation to aquatic ecosystems. Eutrophication of natural water bodies is the process of unnatural quantities of nutrients (typically nitrate and phosphate) accumulating and promoting excessive growth of algae. Voluminous bacteria than feed on the decomposing algae creating an anoxic environment detrimental to other aquatic life.
Nitrification is the intermediary step that assimilates the free ammonium cations in soils to the soluble nitrate (NO3-) and nitrite (NO2-) forms. Bacteria (Nitrosomonas) oxidise ammonium to nitrite allowing the (Nitrobacter) bacteria to further oxidise the nitrite to nitrate (Tan, 2010).
20 proliferating in anoxic waters. Anaerobic organisms (Pseudo-monas and Bacillus) utilise the enzyme nitrate reductase to dissimilate nitrate in a multi-step process. Nitrate (NO3-) is reduced to nitrite (NO2-) followed by nitric oxide (NO) then nitrous oxide (N2O) and finally dinitrogen (N2). The gaseous forms (NO, N2O and N2) are returned to the atmosphere at any point along the pathway if they are released by the bacteria as free compounds (Singer & Munns, 2006).
The microbes responsible for the decay of organic material require ammonium and nitrate for the creation of cell structures. When availability of organic material is plentiful with high nitrogen production (low C/N ratio), the surplus of nitrogen is released in to the soil as free ions. The result is mobilisation of nitrogen ions which are able to be absorbed through diffusion by plant roots and transported by mass flow in xylem to growth sites. At these sites the ions are reabsorbed from the xylem into the cell structures where further cell genesis reveals itself as plant growth. Alternatively, if decay of organic material is not providing adequate nitrogen supply (high C/N ratio), micro-organisms will assimilate all available nitrate and ammonium. A net deficit ‘locks up’ nitrogen in the organisms making it immobile and unavailable to plants. This will present itself in plants as symptoms of nitrogen deficiency (Singer & Munns, 2006).
2.4.4 Potassium
Potassium is an alkali salt and is present in soil in three forms. Unavailable potassium is held in the soil structure and is non exchangeable. Fixed potassium must be broken down to an ion as (K+) before it is exchangeable. Potassium that is already in ion form is called exchangeable potassium (Schulte & Kelling, n.d.). The greatest issue caused to crops by potassium its contribution to salt levels in soil, which limits exchangeability of other nutrients (DEC, 2004).
2.4.5 Phosphorus
21 absorption. P-sorption capacity is a measure of soils propensity to immobilise phosphorus. A higher capacity means the soil will adsorb available P, conversely lower capacity will result in more P remaining available. The availability of P in the soil of cropping land requires careful management due to the environmental impacts associated with soluble phosphates.
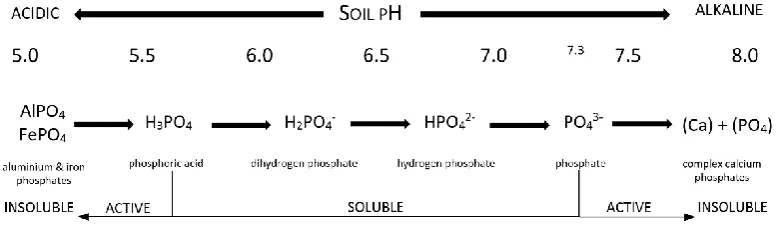
Uptake of phosphorus by plants is restricted largely be soil pH; negatively charged phosphate will readily associate itself with other minerals causing immobilisation, fixing it in solid state compounds. In acidic soils below pH 5.5 availability of minerals iron (Fe) and aluminium (Al) provide phosphate positively charged ions to which it can bond. This produces phosphates of aluminium and iron which render it insoluble, often permanently. Mildly acidic soil pH 5.7 - 6.7 provides conditions suitable to retain hydrogen bonded soluble phosphates as illustrated in Figure 2.2. As the soil pH becomes more neutral calcium (ca2+) becomes the most plentiful ion associated with phosphate bonding. In alkaline soils above pH 7.3 phosphate will bond with calcium cations predominantly in the form of phosphate (PO43-). Complex calcium-phosphate combinations in soil such as triphosphates (Ca3(PO4)2) and apatite (Ca5(PO4)3(F,Cl,OH) form in soils above pH 7.5. Phosphate and calcium-phosphates are solid state compounds but considered active due to the relative ease in which they can be reduced to a soluble state. As the complexity of calcium-phosphate combinations increases (such as; crystalline octacalcium-phosphate, Ca8H2(PO4)6.5H2O) they become inactive and fixed in the soil until the pH is reduced by
[image:33.595.105.494.536.649.2]some means.
Figure 2.2 - The Effect of Soil pH on Phosphorus Mobilisation
22 forms through mineralisation and return in to the soil in an active state. As presented above, depending on the soil pH and chemisty this active phoshate may remain active or soluble (available to plants) or become bonded and inactive (unavailable to plants).
2.4.6 Sulphur Magnesium & Calcium
These three elements account for the balance of soil macronutrients not yet discussed. All three are considered ‘salts’, as this is the form in which they are available to plants, however they all exist in soil as varied compounds and forms.
Sulphur (S), in both its elemental and organic states is found in soil humus, and is mineralised from organic form to inorganic S by micro-organism in the same way as nitrogen. The mineralisation process of organic S is a slow process due to the trace amounts required by micro-organisms. Soil holds in reserve a total of 0.5 percent nominally. The plant available form of S is sulphate (SO42-), which is responsible for synthesis of protein from nitrogen compounds in the plant structure. Due to the mineralisation process, mobilisation and immobilisation of S in soils is intrinsically linked to the availability of nitrogen. This is because the factors influencing mobility of N are the same as for S (Singer and Munns, 2006).
The most plentiful calcium (Ca) and magnesium (Mg) based compounds found in soils are the exchangeable cations (Ca2+ and Mg2+) that are held on colloids or in solution. These ionic forms are available for uptake by plants. Magnesium is utilised by the plant in chlorophyll production and phosphorous transport. Calcium is used by the plant to regulate cell production and metabolise nitrate (Spectrum Analytic, 2016).
The ratio of calcium to magnesium in soils has had a long history of debate regarding its significance to crop yields. Stevens et al (2005) conducted research to determine if one ion acts as an inhibitor to the other resulting in reduced yields. The conclusion of this research suggests that yield was unaffected by the concentration of one ion compared with the other.
2.4.7 Ion Exchange & pH
23 compounds in the form of cations can be efficiently exchanged within the soil and passed as nutrients to a growing crop. Due to the high CEC in organic material, soil that is rich in organic matter possesses a higher potential for cation exchange. This has a significant implication for effluent land irrigation at feedlot sites; as the effluent irrigation process combined with typical applications of decomposed manure adds considerably to organic matter found in soil. Thus, potential exists for high compound exchange rates to occur from soil to crops and microorganism.
Acidity or alkalinity is tested using pH which is a negative logarithmic scale for measuring the amount of hydrogen in soil. The scale range is 1 to 14 with 1 being very acidic, 7 neutral and 14 very alkaline. Lower values indicate a high concentration of hydrogen ions with high concentrations producing a lower pH number (Tan, 1998). Crops generally have the highest potential for nutrient exchange within the pH range of 6 to 7.5. Effluent should be pH tested to ensure it falls within 5.5 to 8.5.
2.4.8 Soluble Salts
Sodicity is a term for the amount of exchangeable sodium soils, the measure of which is exchangeable sodium percentage (ESP). A symptom of sodicity is soil dispersion which degrades the soils structure and impedes plant growth. Sodium Absorption Ratio (SAR) is a measure of the amount of sodium in water. A SAR test can be conducted on effluent to determine if sodium contents will pose a risk to the utilisation area. Values above six will likely cause an increase in available exchangeable sodium and values below 3 will see a subsequent reduction of ESP.
Salinity is the total volume of soluble salts found in a soil. Electrical conductivity (EC) will increase if the amount of soluble salts increases. EC is used to measure that total salt levels of soil. Many of the soluble salts are readily taken up by the crop and are considered plant nutrients. The effects of high salinity are reduced growth potential.
24 2.4.9 Mechanisms Controlling Nutrient Mobility
The chemical processes that dictate the mobility of nutrients and salts has been detailed in their respective sections. Presented here are the factors that influence these chemical processes. This section takes a step back from the soil chemistry, whilst not completely separated from it, to determine what are the drivers of nutrient mobilisation.
As most nutrients are released to the soil through decomposition of organic matter and subsequent mineralisation, the rate of decay for organic materials in the soil dictates the availability of nutrients. Fresh organic matter and humus decay at different rates, with the former decaying a rapidly in comparison to humus. The potential for decay is limited by; Type of organic material, volume of organic material, available water, soil temperature, micro-organism abundance, oxygen concentration, pH and mineral toxicity.
The volume of organic compounds that are available to the soil microbes will dictate the proliferation of those microbes. The decaying process can be accelerated simply by the addition of more organic material. There are limiting factors to this notion such as all other factors influencing decay rate are required to be favourable for this to occur. The type of organic matter also has a significant baring on decay rates. Large, woody and fibrous particles such as crop residues will be slow to breakdown, whereas partially decomposed, finely chopped or simply structured materials will be rapidly decayed by soil microbes. Schemes such as effluent irrigation and manure applications provide scheduled applications of fast decaying organic matter, providing reduced fluctuations in the natural decay cycle (DEC,2004).
25 The proliferation of micro-organisms can be restricted if the conditions of the soil are not conducive to supporting the population potential. Poor aeration of soil may also create a physical barrier holding within it organic matter that cannot be decomposed as it is inaccessible to the micro-organisms. As stated, lack or oversupply of water and anoxia are conditions that will limit micro-organism populations. Adsorption of enzymes and minerals on to clay colloids required for the growth of micro-organisms can have an impact on population numbers and subsequent decay rates. Potential hydrogen levels outside the range of 4.5 to 9.0 will not sustain microbe activity. Typically, a pH range that is conducive to crop growing conditions will be suitable for microbes. Toxic conditions, that is, an extreme concentration of any one mineral, element or compound will often limit the microbe population. In all but the worst cases, the soil microbe community, given enough time can overcome most toxicities, as microbes with the ability to assimilate the toxifying agent will proliferate the site and reduce the toxin back to normal ranges. The caveat here is that the source problem causing the toxicity must cease to exist for normal ranges to return. Long periods of some years or decades may be required to restore condition depending on what the agent is and its rate of breakdown (Singer & Munns, 2006).
The temperature of soil has an impact on decay rates due to the soil micro-organism having a preferential soil temperature range. This range is generally considered to be between 5°C and 40°C. Whilst this range is tolerable for most bacteria and fungi, decomposition will markedly increase above 25°C and be optimal at approximately 40°C.
2.5 Water and Nutrient Uptake in Plants
Foliar uptake of nutrients by plants is possible, as is the common case for leguminous plants, where nitrogen is extracted from the air and transported to the plants vascular system. It is however, much more likely that the significant majority of a plants nutrients are provided by the availability of mobile ions in the soil. It is well understood in literature and explained in Munns and Singer (2006), that the root zone responsible for uptake of nutrients and water is the 50mm-100mm behind the first 10mm of the growing root. Ionic and water uptake is achieved through three separate processes; root interception, mass flow and diffusion.
26 intra-cellular ion concentrations. As the transpiration of water occurs and is lost to the atmosphere more water moves into the roots through mass flow following the principles of water potential. That is, water moves from a high water concentration to a low water concentration which is termed the water potential gradient. Soluble nutrients are also transported in to the plant along with the water following the same principle, only in this case the regulating factor is the ionic concentration gradient. Diffusion occurs when a concentration gradient is created by the uptake of nutrient close to the root creating a pathway for more nutrients in the soil solution to move toward the root. Diffusion can be further broken into three separate processes; simple diffusion, facilitated diffusion and active transport.
Simple diffusion is where ions move passively along a concentration gradient and pass through the cell wall of the root. Facilitated diffusion uses transport proteins which facilitate the movement of ions by creating a pathway through the cell membrane for the ions to passively migrate along the concentration gradient. Active transport is the condition where ions move through the cell membrane from a low concentration gradient to high. This process requires the input of energy from the plant in the form of ATP which allows ionic flow against the concentration gradient through processes of primary and secondary active transport. The energy required for this process is derived from respiratory oxidisation of simple carbohydrates produced in photosynthesis. Primary active transport utilises enzymes which use polar repulsion to ‘recognise’ extracellular ions that are to be transported and pumps them through the cell membrane by opening and closing of external and internal pathways to force the ion in to the cell. Secondary active transport induces an electrochemical gradient by establishing proteins on the cell membrane which expel lower valency ions and allow higher valency ions to pass through the membrane, potentially against the concentration gradient.
An electrically balance state is required within the plant, which leads to exportation of hydrogen (H+) if cation uptake is required and if anions are in need hydroxide (OH-) and bicarbonate (HCO3-) will be released. This situation leads to a reduction in the soil pH in the rhizosphere.
27
2.6 Conclusion
28
Chapter 3
MEDLI ANALYSIS
3.1 Introduction
MEDLI was originally developed by the Cooperative Research Center for Waste Management and Pollution Control, Queensland Government Department of Natural Resources and Queensland Government Department of Primary Industries. The software was initially released in 1996 and in 2015 the Queensland Government Department of Science, Information, Technology and Innovation (DSITI) released version 2 of the software package. Vieritz et al (2011), describes the initial commercial uptake of MEDLI as being below expectations. A total of 32 copies of the version 1 software were sold and of those, about 10 people became regular long term users. In a 2011 report, Vieritz et al looked at the role of MEDLI on sustainable effluent irrigation. The report highlighted that although the number of users was below expectations the program was estimated to be used in over 90 percent of Queensland’s effluent irrigation designs. This same report cited high initial costs and difficulties in the usability of version 1 of the program, for not penetrating the market more substantially on a national level.
MEDLI software is used to simulate an effluent stream from the point of accumulated storage to disposal through irrigation practices. MEDLI has the ability to model industry specific effluent streams for piggeries, dairies, feedlots and sewage treatment plants.
This analysis aims to establish how MEDLI determines outputs for; plant growth, plant nutrient concentrations, total water balance and soil concentration balances for water, nitrogen, phosphorus, sodium and nitrate (Vieritz et al, 2011). Algorithms used to determine outputs will be presented and analysed to determine how each interacts within MEDLI. Calibration of the individual algorithms is not within the scope of this research; however, comment on their role as applied to the MEDLI as a whole will be detailed.
3.2 Model for Effluent Disposal using Land Irrigation
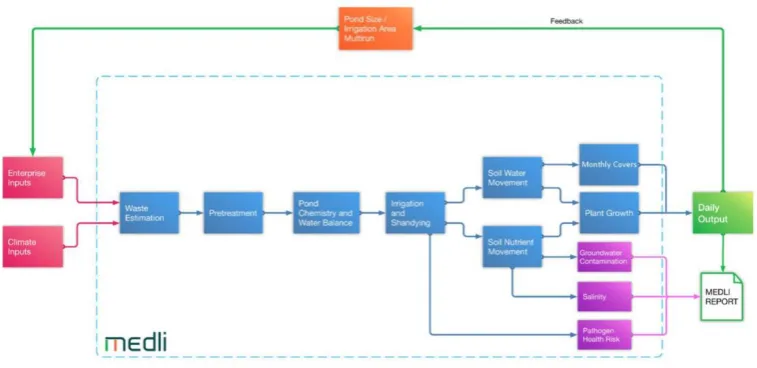
29 different industries are modelled using different mathematical algorithms. Figure 3.1 provides a structural schematic of the simulation processes undertaken in MEDLI. The inputs that MEDLI requires are climate data and details of the operation e.g. number of animals and details about the feed.
Figure 3.1 - Structural Schematic of MEDLI (DSITI, 2016)
The components of MEDLI have, by its creators been categorised in to nine separate modules. Multiple components are contained within modules and each component has been derived from an existing mathematical model or equation. The modules as outlined in the MEDLI version 2 Technical Manual (DSITI, 2016) are;
1. Climate Data
2. Waste Estimation and Pre-treatment 3. Pond Chemistry and Water Balance
4. Irrigation Scheduling and Effluent Shandying 5. Soil Water Movement
6. Nitrogen and Phosphorous Availability and Movement 7. Soil Salinisation
8. Plant Growth and Transpiration 9. Ground Water Transport
30 an extended feature of MEDLI. This output is achieved by running the scenario multiple times to allow optimisation.
3.2.1 Climate Data
MEDLI uses climatic data to form the basis of water balance and crop growth outputs. The time series data (over the longest time period possible) required is; rainfall, temperature, pan evaporation and solar radiation. This site specific data is user defined and can be sourced from the Queensland Government Departments of Natural Resources and Mines; and Science, Information, Technology and Innovation. The CRC for Waste Management and Pollution Control, offer ‘Weather Model’ which is a stand-alone program for interpolation of missing climate data. Description of Daily Weather Model (Irish, 1995) discusses the methods of interpolation.
3.2.2 Waste Estimation and Pre-treatment
This module contains a considerable number of user inputs based on pre-determined industry specific input variables. As this research aims to validate MEDLI in terms of feedlot performance, this analysis will focus on the associated inputs and algorithms specific to that industry.
The waste estimation module uses mass balance as the basic principle for determining waste production within the context of a beef cattle operation. The input variables which are contained in this module are;
effluent inflow (ML/day) total solids (mg/L) volatile solids (mg/L) total nitrogen (mg/L) total phosphorus (mg/L)
total dissolved salts (mg/L) or electrical conductivity (dS/m)
MEDLI produces data in a daily time series for the waste stream for input in to the pre-treatment module. Empirical data for on-site effluent and manure production determined in the (DAMP) model by (Barth, 1985) have been adopted to calculate the following inputs for a feedlot enterprise;
effluent inflow = 1 ML/day
31 volatile solids = 20,000 mg/L
total nitrogen = 700 mg/L total phosphorus = 75 mg/L electrical conductivity = 8 dS/m
The user can select the option of having a pre-treatment system included in the modelling. Some enterprise specific screening option are available for selection. Feedlot pre-treatment is not included in this list. This module requires the user to make estimations on the removal from the effluent stream of the following parameters;
Effluent Removed Nitrogen Removed Phosphorous Removed Volatile Solids Removed Total Solids Removed
These values are entered as a fraction removal from the effluent stream and simply applied as a multiplier to the waste estimation module values.
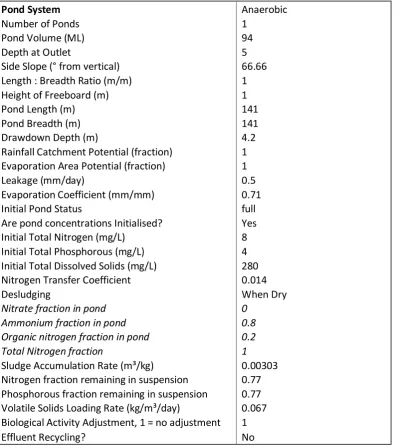
3.2.3 Pond Chemistry and Water Balance
The mass balance outputs derived from waste estimation are carried over to the pond chemistry module which calculates the nutrient values for effluent at the terminal pond. MEDLI can accommodate up to four ponds in series if required and is based on nutrient mass balance modelling by Casey, (1995). Aerobic, facultative and anaerobic pond conditions or combinations of these can be chosen by the user to best suit the design requirements.
An aerobic pond typically has a large surface area to depth ratio to promote organic matter decomposition through aerobic bacteria proliferation. Aerobic oxidation and photosynthesis are the principle processes that occur in an aerobic pond. The bacteria involved in aerobic decomposition cannot survive in anoxic conditions and if eutrophication of the pond results from excessive nutrient loading the pond system can fail.
32 Anaerobic ponds have less surface area and are deeper than both previously mentioned systems. The principal process that takes place in an anaerobic pond is fermentation. Anaerobic bacteria are able to decompose high volumes and concentrations of organic compounds in a totally anoxic environment. A side effect of anaerobic pond conditions is the build-up of sludge on the pond floor which needs to be periodically removed and aerated to undergo further decomposition through aerobic means.
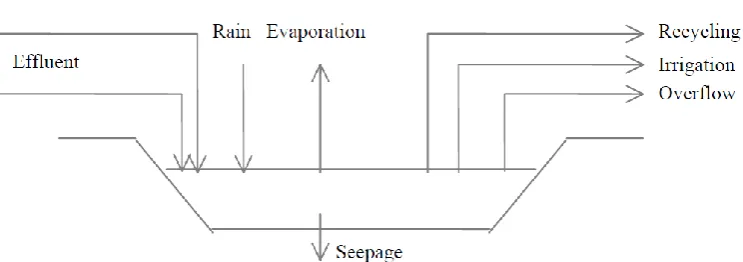
[image:44.595.114.486.246.377.2]Figure 3.2 depicts the schematic of inputs and outputs that are considered in MEDLI.
Figure 3.2 - Schematic of Pond Inputs and Outputs (Casey, Atenzi, 1998)
3.2.4 Irrigation Scheduling and Effluent Shandying
Two modules are contained within this section; irrigation scheduling and effluent shandying. Water quantity and quality outputs from the pond chemistry and water balance modules are used to provide baseline data for irrigation scheduling. In addition, rainfall data is used to determine if irrigation should take place. Three user selectable methods are provided for calculating field irrigation requirements. These are;
Plant Available Water – a minimum soil moisture percentage is set in terms of
plant available water capacity (PAWC), which will initiate irrigation once that minimum is reached.
Soil Water Deficit – irrigation will take place when a maximum allowable
reduction below field capacity, measured in millimetres, is attained
Fixed Daily Irrigation – the quantity and interval of irrigation are defined and will
33 A maximum and minimum irrigation rate is set in mm/h or ML/day and the area to be irrigated in hectares.
The shandying module allows for additional quality water to be added to the pond effluent to boost supply or increase pond water quality. The total pond nitrogen, soluble salts or salinity are factors that may render pond water unusable for irrigation if maximum allowable tolerances are exceeded. This scenario would require water of higher quality to be supplemented before MEDLI would allow irrigation modelling to continue. The nitrogen, total soluble salts and salinity of the shandying water are user defined as is the available volume.
MEDLI generates a daily irrigation demand in ML/day based on the requirements of the cropping field and adjusts this output in accordance with minimum and maximum rates of application. MEDLI will apply irrigation over a period of days if the demand exceeds the maximum rate; this allows the required demand to be brought back into acceptable limits. If demand falls below the minimum allowable rate MEDLI will hold back irrigation until demand and minimum rate of application equilibrate.
The shandying module summates the total water in ML that is applied to the cropping field. The percentages and total volumes of applied water that were sourced from either the effluent pond or as shandying water are provided as outputs (Moffitt, 1998).
3.2.5 Soil Water Movement
34 The premise of the method is;
𝑖𝑛𝑓𝑖𝑙𝑡𝑟𝑎𝑡𝑖𝑜𝑛 (𝐼) = 𝑝𝑟𝑒𝑐𝑖𝑝𝑖𝑡𝑎𝑡𝑖𝑜𝑛 (𝑃) − 𝑟𝑢𝑛𝑜𝑓𝑓(𝑅)
Where:
𝑃 is determined as an input to the climate module and R is given as;
𝑅 = (𝑃 − 0.2𝑆) 2
(𝑃 + 0.8𝑆)
Where:
𝑆 is the retention parameter.
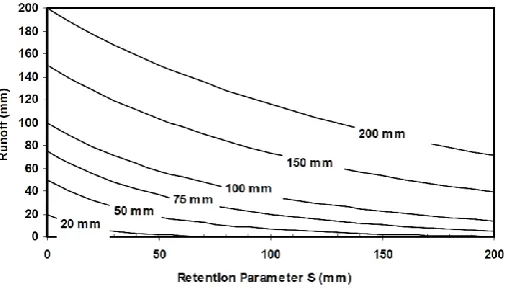
[image:46.595.169.423.359.503.2]The retention parameter (S) is derived from a CN curve relationship for a bare land surface condition (CN2(bare)) represented in Figure 3.3. The curves in the diagram represent various rainfall totals.
35 Reduction in the curve number to allow for ground covering has been implemented using empirical data collected in Queensland by Granville et al., 1984. This data forms the basis of the following reduction factor graph;
Figure 3.4 - CN2base Reduction Factor (Beecham, Vieritz, Littleboy, 1998)
The modification for allowance of antecedent soil moisture is applied to the retention parameter (S). It is based on the work of Knisel (1980), which determines water retention by layer of soils, with heavier weighting given to layers nearer the surface. This method uses layer parameters combined with soil water parameters for each layer to derive a final value for S.
36
Figure 3.5 - Stage 1 and 2 Evaporation (Beecham, Vieritz, Littleboy, 1998)
Stage 1 soil evaporation is equal to the potential rate of pan evaporation and percentage crop cover; it is given as;
𝐸𝑝𝑜𝑡 = 𝑝𝑎𝑛 × 𝑝𝑎𝑛𝑐𝑜𝑒𝑓𝑓 × (
100 − 𝑐𝑜𝑣𝑒𝑟
𝑐𝑜𝑣𝑒𝑟 )
Where:
𝐸𝑝𝑜𝑡 = Potential Evaporation (mm)
𝑝𝑎𝑛 =Pan Evaporation (mm)
𝑝𝑎𝑛𝑐𝑜𝑒𝑓𝑓 =Cropping Coefficient
𝑐𝑜𝑣𝑒𝑟 =Projected Crop Cover (%) (determined by CN2base reduction factor)
Stage 1 evaporation begins after infiltration and ceases once the user defined maximum evaporation value (U) has been reached. This maximum value is obtained from empirical data for field capacities at a given hydraulic conductivity (ksat).
Stage 2 evaporation takes effect after stage one and the slope of cumulative evaporation is plotted against the square root of time. This gives a value of CONA which is an empirically determined value based on the work of Richie, (1974), (see figure 8). The equation used is;
𝑆𝐸2 = 𝐶𝑂𝑁𝐴 [√(𝑡) − √(𝑡 − 1)]
Where:
𝑆𝐸2 = Stage 2 soil evaporation (mm)
𝐶𝑂𝑁𝐴 =Slope of stage 2 soil drying (mm)
37 Deep drainage is determined for each soil layer in sequence beginning at the surface in terms of a saturated or unsaturated condition. Seepage to the next layer in saturated condition is calculated as the product of saturated hydraulic conductivity (ksat) and a time coefficient (TimeFact) which is set at 0.5, however no derivation of this factor could be located during research. Once the upper storage limit is met for a layer the next layer will receive the product of excess water from the proceeding layer and a drainage factor. The method of determining a drainage factor is provided by Beecham, Vieritz, Littleboy, (1998).
3.2.6 Nitrogen and Phosphorus Availability and Movement
Nitrogen and phosphorus fluctuations within soil are modelled by MEDLI to ensure upper maximum limits are not exceeded. The way in which the modelling of nitrogen and phosphorus is handled by MEDLI will be dealt with in two distinct sections. Due to the complex and numerous nature of the algorithms in these sections, the processes will be described and applicable citations provided, but equations have been omitted.
Nitrogen is predominantly suspended in effluent in