CHARACTERIZATION OF MICROLASERS BY THE SOL-GEL METHOD
Thesis by Lan Yang
In Partial Fulfillment of the Requirements for the Degree of
Doctor of Philosophy
CALIFORNIA INSTITUTE OF TECHNOLOGY
Pasadena, California 2005
© 2005
ACKNOWLEDGEMENTS
The time I have spent at Caltech was certainly fruitful and enjoyable. Caltech not only opened the door to scientific research, but also broadened my view in many aspects to the world. I feel very grateful to spend part of my life in this wonderful place.
There are many people to thank for their support and encouragement, without whom this thesis would have not been possible. First I would like to thank my thesis advisor, Professor Kerry J. Vahala, for his patience, support, and guidance through my five years in his group at Caltech. It has been a great pleasure to be one of his students. His deep understanding of physics and his fascination with both fundamental and applied science are what have inspired me most. While allowing and encouraging me to work independently, he was always ready to offer helpful suggestions and insightful comments. In spite of his many responsibilities, he was never too busy to give inspiration, detailed comments, including correcting my naïve grammar mistakes on my papers, or simply to chat. I truly believe I could not have had a better advisor, and his attitude toward science, education and even life will serve as a role model for me in the years to come.
I want to thank other members of my thesis Advisory Committee: Professor Demetri Psaltis, Professor Oskar Painter, Professor David Rutledge and Professor Changhuei Yang, for their useful comments and suggestions for the work included in this thesis.
with whom I have had a fruitful collaboration. I would like to thank Bumki Min for his willingness to share his knowledge with me and I have enjoyed talking with him very much. It is also an enjoyable experience working with Dr. Tal Carmon and I like his “Hebrew wisdom” very much. I also would like to thank Alireza Ghaffari for showing me how to use some facilities, such as mask aligner and spinner, in the clean room.
I also want to thank my friends for making the graduate school life a colorful experience. Many thanks go to Lili Yang, Pin Wang, Weiwei Zhong, Yin Gong, Chunhui Mo, Qiang Yang, Zhengrong Wang, Jiao Lin, Jian Wu, Qingsong Zhang, Wei Liang, Yanyi Huang, Jie Yu, Ying Li, Charles Fan, Fang Wang, and Chunhua Qi……
I thank my beloved family whose love and encouragement are extremely important to me. I appreciate what they have done for me throughout these years. I also thank my husband Hongyu for his unlimited support, who made the possibly-dreary graduate school life a pleasant experience overall. With beloved ones around, I can move forward full of passion and hope.
ABSTRACT
The present study explores the application of new materials systems for low threshold microlasers, and characterization of the microcavities. The sol-gel method is used for gain functionalization of high-Q microcavities. A detailed procedure for preparation of the sol-gel films by the spin-on or dip-coating method is presented. The effect of different process conditions on the properties and microstructure of the thin films is investigated through Fourier Transform Infrared (FTIR) Spectroscopy, Scanning Electron Microscopy (SEM), and etching rate test.
Surface gain functionalization of microsphere cavities is fabricated by coating the microsphere with a thin layer of Er3+-doped sol-gel films. The optical gain is due to the population inversion of rare earth ions in the sol-gel films. A fiber taper is used to both couple the pump power into and extract the laser power out of the microsphere laser. The laser dynamics change between continuous-wave and pulsating operation by varying the doping concentration and the thickness of the sol-gel films outside the microsphere.
The thesis explores fabrication of high Q microcavities directly from the sol-gel silica films deposited on a single silicon wafer. Quality factor as high as 2.5 × 10⁷ at 1561 nm is obtained in toroidal microcavities formed of silica sol-gel, which allows Raman lasing at absorbed pump power below 1 mW. Additionally, Er3+-doped microlasers are fabricated from Er3+-doped sol-gel layers with control of the laser dynamics possible by varying the erbium concentration of the starting sol-gel material. Continuous lasing with a record threshold of 660 nW for erbium-doped microlaser on a silicon wafer is also obtained.
TABLE OF CONTENTS
Acknowledgements...iv
Abstract...vii
Table of Contents...ix
List of Figures...xiv
List of Tables...xviii
Chapter I: Introduction... 1
1.1 Motivation ... 2
1.2 Organization of the Thesis ... 3
Chapter II: Whispering gallery type microresonators... 7
2.1. Introduction ... 7
2.2. Microsphere resonators ... 8
2.3 Cavity quality factor (Q) ... 17
3.1 Introduction ... 23
3.2 General methods for coupling to microsphere microcavities ... 23
3.3 Fabrication of the fiber taper... 25
3.4 Characterization of the fiber taper modes... 26
3.5 Coupling between the fiber taper and the cavity... 26
3.6 Phase matching between the microcavities and the fiber-taper coupler... …...…...…...…...33
3.7 Conclusion …...34
Chapter IV: Optical materials by sol-gel process... 35
4.1 Introduction ... 35
4.2 An overview of sol-gel process steps ... 35
4.2.1 Hydrolysis and condensation ... 37
4.2.2 Gelation ... 38
4.2.3 Ageing ... 39
4.2.4 Drying ... 39
4.2.5 Densification ... 39
4.2.6 Advantages and limitations of sol-gel method ... 40
4.3 Fabrication of sol-gel films for photonic application... 41
4.4 Characterization of sol-gel silica film with Fourier Transform Infrared Spectrometer (FTIR) ... 42
4.6 Conclusion... 45
Chapter V: Surface functionalization of silica microsphere resonators... 46
5.1 Introduction ... 46
5.2 Erbium doped silica glass... 46
5.2.1 Er3+-Er3+ interactions... 48
5.3 Fabrication of silica microsphere... 49
5.4 Surface functionalization of microsphere... 52
5.5 Coupling between fiber taper and microsphere... 54
5.6 Laser performance... 56
5.7 Effect of doping thickness on the laser dynamics ... 59
5.8 Conclusion... 61
Chapter VI: Surface functionalization of silica microtoroid resonators on a si chip... 62
6.1 Introduction ... 62
6.2 Characterization of Microtoroid cavities ... 63
6.3 Surface functionalization of microtoroid cavities on a Si chip... 66
6.4 Fiber taper coupled microtoroid lasers on a Si chip... 67
6.5 Conclusions ... 72
7.1 Introduction ... 73
7.2 Fabrication and characterization of microdisk and microtoroid cavities from the sol-gel films... 75
7.2.1 Fabrication of sol-gel films on a silicon wafer... 75
7.2.2 Fabrication of microdisk and microtoroid cavities from the sol-gel films ... 76
7.2.3 Characterization of microdisks and microtoroids with optical microscope and SEM ... 79
7.3 Raman Microlasers from sol-gel films on a Si chip... 81
7.4 Er3+-doped Microlasers from sol-gel films on a Si chip ... 82
7.5 Analysis of Er3+-doped microlasers... 87
7.5.1 Transmission spectrum of the pump... 89
7.5.2 Laser output power of the microlasers ... 91
7.5.3 Threshold power of the microlasers ... 95
7.5.4 Differential quantum efficiency of the microlasers... 100
7.5.5 Experimental Results ... 102
7.6 Conclusions ... 105
Chapter VIII: Paired ions induced self-pulsing in Erbium-doped Microtoroid lasers... 107
8.1 Introduction ... 107
8.2 Model for ion pairs inducing self-pulsing ... 108
8.4 Conclusions ... 120
Chapter IX: Conclusion and future work... 121
LIST OF FIGURES
2.1. The field profile of a TE mode of a microsphere. ... 12
2.2 The field profile of a TE mode of a microsphere,
n
=
1
,
l
=
192,
and
m
=
l
-
4
... 142.3 Images of the WGMs in the taper-sphere coupling zone: (a) l-m=0. (b) l-m=1. and (c) l-m=5. ... 15
2.4 High resolution whispering gallery mode spectrum... 19
3.1 Different coupling scheme for microspheres... 24
3.2 Optical image of waist of the fiber taper. Inset: a standard 125 µm single mode optical fibers……….25
3.3 Schematic of coupling between fiber taper and cavity... 27
3.4 Different coupling regimes for a cavity with the intrinsic quality factor Qo of 1×10⁸... 31
3.5 Normalized transmission of a fiber taper coupled microsphere versus the air gap between the microsphere and the taper... 33
4.1 Schematic of fabrication of sol-gel films on a substrate ... 41
4.2 FTIR spectra of thermal silica and sol-gel silica samples prepared with different heat treatment... 43
5.1 Schematic representation of the Er3+ intra 4f Energy level... 47
5.2 Illustration of fabrication of the microsphere for a silica fiber ... 50
5.4 Schematic of surface functionalization of silica microsphere... 53 5.5 Schematic of a thin film coated microsphere laser coupled with a fiber taper... 55 5.6 Image of the WGMs in the taper-sphere coupling zone... 56 5.7 Emission spectrum of a microsphere laser ... 57 5.8 Laser output power versus absorbed pump power in the microsphere laser ... 58 5.9 Measured pulsation frequency versus the square root of the laser
output power P... 60 6.1 Optical micrograph top view of a microtoroid shoing principal and minor diameters of the toroid ... 63 6.2 Simulation of fundamental TM modes for toroid with minor diameters of (a) 4 µm; (b) 8 µm and (c) 16 µm. ... 64 6.3 Field intensity distribution along the polar direction for different micro- toroids... 65 6.4 Schematic of surface functionalization of a microtoroid on a silicon chip... 66 6.5 Illustration showing a micro-chip laser consisting of an Erbium-doped sol-gel thin film applied to a microtoroid ... 68 6.6 Photomicrograph top view of an Erbium microtoroid laser coupled
6.7 Emission spectrum of a microtoroid laser with approximate diameter of 80 µm... 69 6.8 Laser emission spectrum from Er-doped sol-gel thin-film coated
microtoroid laser... 70 6.9 Measured laser output power plotted versus absorbed pump power
for a microtoroid laser with a diameter of 80 µm... 71 7.1 Schematic process flow for creation of solgel microcavities on a
Si wafer ... 77 7.2 Transmission spectrum of a fiber taper coupled microdisk with
diameter of 100 micron ... 78 7.3 Optical photomicrograph of (a) circular pads on silicon wafer
(b) under-etched silica disk (c) Microtoroid after CO2 laser reflow ... 80 7.4 SEM images of microdisks and microtoroids... 81 7.5 Raman emission spectrum of an undoped microtoroid with principal diameter of 49 µm... 83 7.6 Photomicrograph view (horizontal and vertical) of an Er3+-doped
solgel silica microtoroid laser... 85 7.7 Typical laser spectrum of an Er-doped solgel silica microtoroid laser... 86 7.8 Normalized transmission of pump power as a function of air
gap between the fiber taper coupler and the microlaser ... 90 7.9 Laser output power as a function of air gap between the fiber
7.10 Threshold pump power as a function of air gap ... 98 7.11 Threshold pump power as a function of erbium concentration in the microlasers with different intrinsic Q ... 99 7.12 Quantum efficiency as a function of air gap with different intrinsic Q . 102 7.13 Normalized laser output power as a function of air gap... 103 7.14 Differential quantum efficiency as a function of air gap... 103 7.15 Measured laser output power plotted versus the absorbed pump
power for a microtoroid laser ... 104 8.1. Cross-relaxation process between paired ions ... 110 8.2 Energy level diagram in current model for paired ions... 112 8.3 Numerical simulation of photon density as a function of time at
different pumping level ... 115 8.4 Numerical simulation of evolution of the self-pulsing frequency as
a function of square root of P/Pth... 116 8.5 Self-pulsing operation of an Er3+-doped microtoroid laser with laser
output power ... 119 8.6 Evolution of the self-pulsing frequency as a function of square root
LIST OF TABLES
C h a p t e r 1
INTRODUCTION
heat-fusing the tip of a doped silica or phosphate wire. All the microspheres are made by heat-fusing the tip of a glass wire. For the pure silica microsphere, a regular silica optical fiber can be used, while for the doped microsphere, either the Nd3+-doped silica wire was obtained by HF etching the cladding of a fiber with a core of 20 µm in diameter doped with 0.2 wt% Nd3+, or the Er3+/Yb3+ codoped phosphate wire was pulled from a piece of melted Er3+/Yb3+ bulk phosphate glass. However, it tends to form some crystallized spots during the melting-and-pulling process to get the doped-phosphate wire and further heating can not get rid of the crystallization defect, which makes the final microsphere inhomogeneous and degrade the quality factor of the microcavites.
On the other hand, sol-gel method has been used for preparation of oxide in a variety forms [13]. This thesis centers on the fabrication of microlasers by surface gain functionalization of existing high-Q microcavities with sol-gel films or directly processing of sol-gel films into a microlasers. Throughout the thesis work, a CO2 laser was used to modify the sol-gel materials. The laser reflow process endows the sol-gel material very high optical quality. This thesis also includes a detailed study of the microlasers. Before turning to the outline of the thesis, a brief introduction of the sol-gel method in optics field will be outlined.
1.1 Motivation
components in liquid state makes it possible to vary the optical materials over a wide range of compositions at molecular level, therefore the optical properties of the materials are tailored, such as Ge dopants to change the refractive index [14], P dopants to increase nonlinear gain coefficient of silica and rare earth dopants to create gain in the host materials [15-17]. In summary, the sol-gel method provides an efficient and cost-effective platform for us to explore the effects of different dopants on the properties of the microcavities.
1.2 Organization of the Thesis
To provide a common footing for the chapters that follow, chapter 2 introduces the origin of the Whispering Gallery Mode (WGM) cavities. Several terminologies, such as finesse and optical quality factor, used in cavities are also introduced. The mode characterization and field distribution of the microsphere is discussed. Tracing of the modes in microsphere is visible by using up-conversion (540 nm transition) of Er3+ inside the sol-gel films coated outside the microsphere.
Chapter 4 introduces the sol-gel method and its application in optics field. A detailed procedure for preparation of sol-gel films by spin-on or dip-coating method is presented. The effect of different annealing temperature on the properties of the thin films is investigated by Fourier Transform Infrared (FTIR) Spectroscopy. An etching rate test of the sol-gel films further reveals the change of microstructure of the sol-gel films annealed under different temperature.
Chapter 5 investigates surface gain functionalization of microsphere cavities by coating the microsphere with a thin layer of Er3+-doped sol-gel films. The procedure for fabrication of silica microsphere is presented followed by surface functionalization of the microsphere. A fiber taper is used to both couple the pump power into and extract the laser power out of the microsphere laser. A single frequency laser is obtained under certain pump wavelength and coupling condition. It demonstrates that the laser dynamics can be changed by variation the thickness of the doping films outside the microsphere.
the microtoroid is very similar to that used for the microsphere, except that the microtoroid can be selectively coated only at the periphery by making using of the variation of etching rate (in buffered HF) of sol-gel films with different degree of densification. The laser performance of the gain functionalizaed microtoroids is investigated. With the reduction of freedom in the azimuthal direction, a simpler mode spectra than that of the microsphere is obtained, which makes it easier to get single laser line. A high finesse Fabry-Perot etalon was used to compare the linewidth of the microlaser with that of a single frequency external cavity laser with know linewidth of 300 kHz, which shows that the high-Q microtoroid laser has a much narrower linewidth than 300 kHz.
Chapter 7 explores fabrication of microtoroid lasers directly from the sol-gel films deposited on a single silicon wafer. It’s demonstrated that a Raman microlaser can be made from pure silica sol-gel film, while an Er3+-doped microlaser can be achieved from Er3+ -doped silica sol-gel films. The single mode Raman lasing and single mode Er3+ lasing are presented. A fiber taper was used to couple the pump light into and laser light out of the microtoroids. Analytical formulas were developed to study the change of pump threshold, differential quantum efficiency and laser output power with the air gap between the fiber taper coupler and the microcavities. The effect of Er3+ concentration on the minimum absorbed threshold power is also investigated.
Chapter 9, the final chapter, draws upon the general conclusions of the previous chapters to speculate on further study following this work.
C h a p t e r 2
WHISPERING GALLERY TYPE MICRORESONATORS
2.1Introduction
A wide range of resonator constructed for different applications have been fabricated and investigated. Among them the surface-tension-induced microcavities, such as microsphere and microdisk, attract great interests because unprecedented quality factor (Q) as high as a several billion have been achieved in silica microphere, which are of great use for ultra-narrow linewidth, cavity QED, ultra-low threshold microlasers, and other photonics application. The microsphere, together with cavities with circular geometry, is called Whispering Gallery Mode (WGM) resonators. The WGM is named after the sound effect noted in some cathedrals, where one can whisper along the wall and hear all along the inside perimeter of the dome. Light presents the same behavior when injected tangentially into the WGM type cavities, where light is trapped in circular orbits just within the surface by repeated total internal reflections. This low dissipation mechanism for confinement leads to unusual high quality factor mentioned above.
2.2Microsphere resonators
To investigate the electromagnetic modes in the microsphere cavity, we study the Maxwell’s equation in an isotropic medium with constant scalar permittivity and permeability, and free of charge and current.
∇
⋅
D
=
0
(2.1)
∇
⋅
B
=
0
(2.2)
t
H
t
B
E
∂
∂
µ
−
=
∂
∂
−
=
×
∇
(2.3)
t
E
t
D
H
∂
∂
ε
=
∂
∂
−
=
×
∇
(2.4)First we take the curl of the Maxwell’s curl equation for electric field (2.3), and use the vector identity
∇
×
∇
×
A
=
∇
(
∇
⋅
A
)
−
∇
2A
(2.5)to obtain
)
t
H
(
E
)
E
(
2∂
∂
×
∇
µ
−
=
∇
−
⋅
∇
∇
. (2.6)
0
t
E
E
2 2 2=
∂
∂
µε
−
∇
(2.7)If we assume the field quantities to vary as
E
(
r
r
,
t
)
=
E
(
r
r
)
e
iωt, we obtain:
∇
2E
+
k
2E
=
0
(2.8)where
k
=
ω
µε
It’s been verified numerically that the polarization direction of the electromagnetic field of a sphere can be approximated constant along the same spherical coordinate axes at all points in space. Therefore the either or component of the electromagnetic field is separable, i.e.
θ
E
H
θ)
(
)
(
)
r
(
E
θ=
ψ
r⋅
ψ
θθ
⋅
ψ
φφ
, orH
θ=
ψ
r(
r
)
⋅
ψ
θ(
θ
)
⋅
ψ
φ(
φ
)
. Here we consider the transverse electric (TE) mode, where the electric field is parallel to the surface withE
r
=
E
θθ
r
andE
φ=
E
r=
0
. Similar process can be used to study the transverse magnetic (TM) mode. Consider the wave equation (2.8) in spherical coordinate system:
E
k
E
0
sin
r
1
)
E
(sin
sin
r
1
)
r
E
r
(
r
r
1
2 22 2 2
2
2
∂
φ
+
=
∂
θ
+
θ
∂
∂
θ
θ
∂
∂
θ
+
∂
∂
∂
∂
(2.9)0
r
k
d
d
sin
1
)
d
d
(sin
d
d
sin
1
)
r
d
r
(
dr
d
1
2 2 22 r 2 r
=
+
φ
ψ
θ
ψ
+
θ
ψ
θ
θ
θ
ψ
+
∂
ψ
ψ
φ φ θ θThus there are three ordinary differential equation, one in r only, one in
θ
only and one in .φ
(a). The radial dependence satisfy the equation
)
0
r
)
1
l
(
l
k
(
dr
d
r
2
dr
d
r 2 2 r 2 r 2=
ψ
+
−
+
ψ
+
ψ
(2.10)This is the spherical Bessel differential equation, and the solutions are called spherical Bessel functions of order
l
. Within the sphere the general solutions of (2.10) is
ψ
r=
c
1j
l(
kr
)
+
c
2n
l(
kr
)
(2.11)For the field inside the sphere,
r
<
R
0, we must consider the behavior of the field as0
r
→
. While forx
<<
1
,!
)!
1
l
2
(
x
)
x
(
j
ll
→
+
and l l 1x
!
)!
1
l
2
(
)
x
(
n
→
−
−
+ , whichmeans that
n
l(
x
)
is divergent asr
→
0
. Since the field should be finite atr
=
0
, so the fields inside the sphere (r
<
R
0, whereR
0 is the radius of the sphere) isOutside the sphere, it’s an evanescent field which will decay exponentially in the radial direction. To get the solution outside the sphere, we use substitution of variables by
assuming
r
r rϕ
=
ψ
and obtain:
)
0
r
)
1
l
(
l
k
(
dr
d
r 2 2 2 r 2=
ϕ
+
−
+
ϕ
(2.13)Let
r
=
R
0+
∆
r
and equation (2.13) become:
)
0
)
r
R
(
)
1
l
(
l
k
(
r
d
d
r 2 0 2 2 r 2=
ϕ
∆
+
+
−
+
∆
ϕ
(2.14)Because the amplitude of the fields decay rapidly outside the sphere, we are interested in the region of space that is within several wavelength out from the sphere surface. We can
assume that
0
R
r
∆
, so equation (2.14) is simplified to:
)
0
R
)
1
l
(
l
k
(
r
d
d
r 2 0 2 2 r 2=
ϕ
+
−
+
∆
ϕ
(2.15)Equation (2.15) describes an evanescent field in the radial direction outside the sphere. The solution is an exponentially decay field:
ϕ
r~
exp(
−
α
⋅
∆
r
)
, with 22 0
k
R
)
1
l
(
l
+
−
=
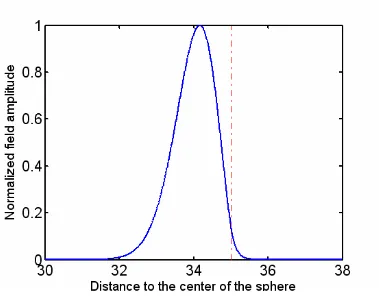
Figure 2.1. The field profile of a TE mode in the radial direction for a microsphere with diameter of 70 µm. The wavelength is at 1.5572 µm and the mode numbers are
192.
l
and
,
1
n
=
=
So the full radial dependence is:
(2.17)
⎪⎩
⎪
⎨
⎧
>
−
⋅
α
−
<
=
ψ
0 0 0 l rR
r
for
))
R
r
(
exp(
B
R
r
for
)
kr
(
j
A
the fields are related to mode numbers
l
and . Furthermore the number of field maximum along the radial direction is determined by .n
n
(b). The azimuthal dependence satisfy the equation
m
0
d
d
2 2=
ψ
+
φ
ψ
φ φ (2.18)π
2
The field in the azimuthal direction has a periodicity of , so the azimuthal dependence of the field is:
ψ
φ=
N
φexp(
im
φ
)
(2.19)where is an integer and is the normalization constant to be chosen so that after one
revolution the integral of
m
N
φ2
φ
ψ
is unity(c). The polar dependence is
)
0
sin
m
1
l
(
l
)
d
d
(sin
d
d
sin
1
2 2=
ψ
⎥
⎦
⎤
⎢
⎣
⎡
θ
−
+
+
θ
ψ
θ
θ
θ
θθ (2.20)
This is polar-dependent part of a spherical harmonic differential equation and the solution is associated Legendre polynomials. So the polar solution of the field is:
Figure 2.2. The field profile of a TE mode in the azimuthal direction for a microsphere with diameter of 70 µm. The wavelength is 1.557µm and mode numbers are
n
=
1
,
l
=
192,
m
=
l
-
4
.where
m
=
−
l
,
−
(
l
−
1
),...,
l
−
1
,
l
and is an associated Legendrepolynomial. is the normalization constant to be chosen so that the integral of
)
(cos
P
lmθ
θ
N
ψ
θ 2over
θ
is unity. Figure 2.3 shows images of different WGM of an Er3+-doped microsphere, where the up-conversion transition in 540 nm is used to trace the mode.(a) (b)
(c)
For the TE mode, the magnetic field can be solved from Maxwell’s equation:
∇
×
θ
ωµ
−
=
θr
r
E
1
i
H
⎟⎟
⎠
⎞
⎜⎜
⎝
⎛
φ
⎟
⎠
⎞
⎜
⎝
⎛
∂
∂
+
+
θ
−
ωµ
−
=
θ θθ
r
r
r
E
r
E
r
E
sin
r
m
i
1
i
(2.22)The electromagnetic fields must satisfy the boundary condition that the tangential components
E
θ andH
φshould be continuous atr
=
R
0. This leads to
(
)
(
)
(
)
s0 0 s 0 l 0 s 0 ' l s 0 0 0 s 0 l
R
1
R
n
k
j
R
n
k
j
n
k
R
R
n
k
j
α
−
=
+
(2.23)Similarly for TM mode
(
)
(
)
(
)
20 2 s s 0 0 s 0 l 0 s 0 ' l s 0 0 0 s 0 l
n
n
R
1
R
n
k
j
R
n
k
j
n
k
R
R
n
k
j
⎟⎟
⎠
⎞
⎜⎜
⎝
⎛
α
−
=
+
(2.24)We now use the spherical Bessel function recursion relation
( )
( )
j
( )
x
x
x
j
l
x
j
l′
=
⋅
l−
l+1 (2.25)TE modes: s l
(
0 s 0)
0 s l 1(
0 s 0 0R
n
k
j
n
k
R
n
k
j
R
l
+=
⎟⎟
⎠
⎞
⎜⎜
⎝
⎛
α
+
)
(2.26)TM modes: 2 s l
(
0 s 0)
0 s l 1(
0 s 00 2 s 0 2 0 2
s
j
k
n
R
k
n
j
k
n
R
n
n
R
1
n
n
1
l
⎟
⎟
=
+⎠
⎞
⎜
⎜
⎝
⎛
α
+
⎟
⎟
⎠
⎞
⎜
⎜
⎝
⎛
−
+
)
(2.27)These characteristic equation relates the wavevector
k
0 and mode numberl
and . For a cavity with , the mode numbern
λ
>>
0
R
l
>>
1
, (e.g. forn
s=
1
.
43
,R
0=
50
µ
m,
, the mode number
m
55
.
1
µ
=
λ
l
~
2
n
sπ
R
0/
λ
=
290
), the characteristic equation for TM mode can be simplified toTM modes: s l
(
0 s 0)
0 s l 1(
0 s 02 0 2 s 0
R
n
k
j
n
k
R
n
k
j
n
n
R
l
+=
⎟
⎟
⎠
⎞
⎜
⎜
⎝
⎛
α
+
)
(2.28)2.3Cavity quality factor (Q)
The quality factor Q is often used to characterize the resonators. It is defined in terms of energy storage and power loss:
W
U
cycle
per
loss
energy
)
energy
stored
(
2
Q
tot=
π
=
ω
0 (2.29)behavior of stored energy U inside the cavity
U
Q
dt
dU
ω
0−
=
(2.30)where
ω
0 is the resonant frequency of the cavity. The solution to the equation above is
( )
t Q 0 0e
U
t
U
ω −=
(2.31)So the optical field in the cavity is damped as follows:
E
( )
t
=
E
0e
iω0te
−ω0t/2Q (2.32)The Standard Fourier analysis yields the optical field in the frequency domain
( )
( )
2 t i 2dt
e
t
E
E
ω
=
∫
−∞∞ −ω
∫
∞E
0e
i( 0 )te
0t/2Qdt
2∞ − ω − ω − ω
=
(
) (
)
20 2 0 2 0
Q
2
/
E
ω
+
ω
−
ω
=
(2.33)The resonance has a Lorentzian shape with a Full Width at Half Maximum (FWHM) equal to . Therefore the quality factor Q is related to the linewidth of the mode by
. A high resolution Whispering Gallery mode spectrum of a microsphere is
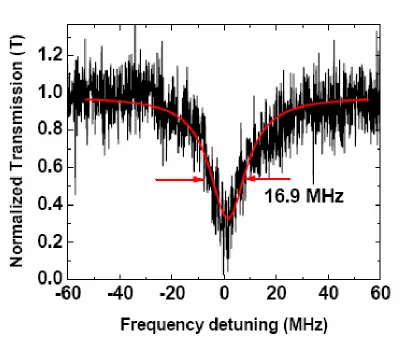
Figure 2.4. High resolution whispering gallery mode spectrum. The quality factor is 2×10⁷ at 980 nm.
presented in figure 2.4, where the total quality factor is deduced from the linewidth of the mode.
U
W
U
W
U
W
U
W
U
W
U
W
Q
1
tot mat ss sc rad couptot
ω
+
ω
+
ω
+
ω
+
ω
=
ω
=
3
2
1
4
4
4
4
3
4
4
4
4
2
1
factor Quality External coup factor Quality Intrinsic rad sc ss matQ
1
Q
1
Q
1
Q
1
Q
1
+
+
+
+
=
(2.34)where accounts for materials absorption loss, denotes the scattering loss from surface inhomogeneities, describe the loss caused by surface contamination, represents the tunneling loss due to the curvature of the boundaries in the propagation path of the mode, and describes the coupling loss to a coupler. The quality factor describing the loss from materials absorption, scattering, surface contamination and radiation are usually called “cold cavity quality factor” or “intrinsic quality factor”, while
, which accounts for the coupling to a external coupler, is designated as ‘external quality factor’. As studied by Haus and his colleague, increase exponentially with increasing size, and for air clad microspheres with radii larger than about 15 µm, [18]. While the absorption of silica at the wavelength of 1.55 µm can be as low as 0.2 dB/km, which corresponds to an absorption limited quality factor of 10
mat
Q
Q
sssc
Q
Q
radcoup
Q
coupQ
radQ
11 rad10
Q
>
11. Therefore absorption and surface scattering are the predominant loss mechanism for silica microspheres with radii larger than 15 µm.The quality factor due to materials absorption can be determined by [10]:
λα
π
=
2
n
Q
mat (2.35)where is the wavelength, is the refractive index of the materials at
λ
n
λ
, andα
is the linear attenuation in the resonator caused by materials absorption.
Scattering Loss:
The quality factor due to scattering loss by the surface homogeneity can be estimated by [10]
B
R
Q
2 2 0 2 ssσ
π
λ
=
(2.36)where
σ
andB
are the rms size the correlation length of surface homogeneities, respectively.Radiation Loss:
The Quality factor associated with the radiation loss is shown to be [18]:
(
)
(
)
(
) (
)
2 0 s l 0 s 1 l 2 s 0 s 1 l 0 s l 1 0 0 5 0 2 0 s 0 3 s 2 radR
kn
j
R
kn
j
n
R
kn
j
R
kn
j
n
Z
R
n
N
c
k
n
l
Q
− − +⎥
⎥
⎥
⎥
⎥
⎦
⎤
⎢
⎢
⎢
⎢
⎢
⎣
⎡
⎟⎟
⎠
⎞
⎜⎜
⎝
⎛
γ
π
−
⎟⎟
⎠
⎞
⎜⎜
⎝
⎛
γ
π
ε
with
(
)
(
)
(
l
)
R
kn
R
kn
j
R
kn
j
R
kn
2
1
l
2 0 0 0 0 1 l 0 0 l 0 01
=
−
−
+
γ
−
(
)
(
)
(
l
)
R
kn
R
kn
j
R
kn
j
R
kn
2
1
l
2 0 0 0 0 l 0 0 1 l 0 02
=
+
−
+
γ
+where c is the speed of light in the vacuum,
ε
0 is the permittivity of free space, is the free space impedance.377
Z
0≈
C h a p t e r 3
OPTICAL COUPLING BETWEEN FIBER TAPER AND WGM CAVITY
3.1 Introduction
In this chapter we will review various methods developed to excite microsphere modes. The fiber taper is used as an efficient way to couple the light into and out of the microcavities throughout this thesis work. The coupling between the fiber taper and microsphere cavities is investigated in details.
3.2General methods for coupling to microsphere and microcavities
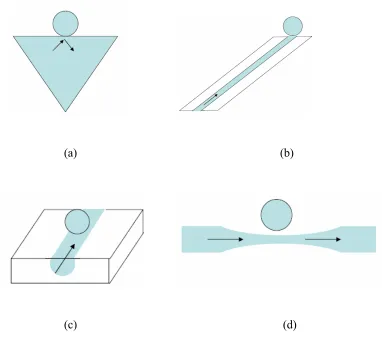
(a) (b)
[image:43.612.131.513.84.434.2]
(c) (d)
Figure 3.1. Different coupling schemes for microspheres: (a) Prism coupler; (b) Angle polished fiber tip; (c) Polished half block coupler; (d) fiber taper
3.3Fabrication of the fiber taper
Figure 3.2. Optical image of waist of the fiber taper. Inset: a standard 125 µm single mode optical fibers
3.4Characterization of the fiber taper modes
Although the fiber taper is pulled from a fiber with core and cladding region, during the pulling process the core vanishes and the fiber taper can be regarded as an air-clad cylinder waveguides. The analytic solution for mode of propagation in cylinder waveguide is well known. The characteristic equation which determines the propagation constant ( ) of the fiber mode is [18]:
f
β
( )
( )
( )
( )
f 0
f 1 f f
0 f 1 f
ak
K
ak
K
ak
J
ak
J
k
=
α
(3.1)with
k
f=
k
2n
2f−
β
2f
α
f=
β
2f−
k
2n
c2where a is the core radius of the fiber taper at the coupling zone, is the refractive index
of the fiber taper, and are Bessel function of the zero and first order, while and are the modified Hankel functions of zero and first order.
f
n
0
J
J
1K
01
K
3.5 Coupling between the fiber taper and the cavity
α
,
ϕ
t
′
E
st
κ
κ′
[image:46.612.118.425.90.291.2]E
i:Input
E
o:Output
Figure 3.3. Schematic of coupling between fiber taper and cavity
field amplitude of taper mode before and after the cavities, respectively. Let describe the coupling of the resonator mode with the fiber taper mode and
κ
t
be the transmission coefficient of the field amplitude before and after the coupling region. The coupling of light into and out of the resonator can be described by equations [23]:
E
s( )
t
=
i
κ
E
i( )
t
+
t
'E
s(
t
−
τ
0) (
exp
i
ϕ
−
α
L
/
2
)
(3.2)
E
o( )
t
=
tE
i( )
t
+
i
κ
'E
s( )
t
(3.3)integral of the field of the cavity mode and the fiber taper coupler mode. is the round trip time of the mode traveling inside the resonator,
c
/
L
n
s 0=
τ
λ
π
=
ϕ
2
n
sL
/
is the phase change of the mode after a round trip in the resonator, andα
is the linear attenuation in the resonator caused by absorption, scattering and radiation. Because of time reversal symmetry and energy conservation, we havet
=
t
',κ
=
κ
', andt
2+
κ
2=
1
. For high Q cavity, the round trip loss is very small, in other wordsα
<<
1
andκ
<<
1
. Assumeis the resonant frequency of the cavity mode. By expanding
0 0
=
2
π
c
/
λ
ω
E
s(
t
−
τ
0)
at t and ignore the high order term, i.e.
E
s(
t
−
τ
0)
=
E
s( )
t
−
τ
0dE
s( )
t
/
dt
, and replace it in equation 3.2, we obtain
( ) (
) ( )
E
( )
t
t
i
t
E
i
dt
t
dE
i 0 s 0 c sτ
κ
=
ω
∆
+
δ
+
δ
+
(3.4)where 0 c
t
t
1
τ
−
=
δ
, s 0n
2
c
α
=
δ
and∆
ω
is the frequency shift to the resonantfrequency. According to definition of the quality factor, the equation for the field of the mode in the resonator can also be written as
( )
i
E
( )
t
i
E
( )
t
Q
2
Q
2
dt
t
dE
i s 0 0 ex 0s
=
γ
⎟⎟
⎠
⎞
⎜⎜
⎝
⎛
ω
∆
+
ω
+
ω
+
(3.5)where is the intrinsic quality factor originating from the loss mechanism in the cavity including scattering from surface, materials absorption due to molecule resonances, or
0
whispering gallery radiation loss, is the external quality factor determined by the coupling between the resonator and the coupler and
ex
Q
γ
is the coupling coefficient of input field coupled into the resonator [18]. Compare equation 3.4 with 3.5, the parameterδ
0 andcan be related to the quality factor:
c
δ
0 0 0Q
2
ω
=
δ
(3.6)ex 0 c
Q
2
ω
=
δ
(3.7)At steady state, the time derivative of
E
s( )
t
is equal to zero, which means that
( ) (
)
t
E
( )
t
i
i
1
t
E
i 0 0 c s⎟⎟
⎠
⎞
⎜⎜
⎝
⎛
τ
κ
ω
∆
+
δ
+
δ
=
(3.8)So the field amplitude can be changed by
δ
c for a given input power in the fiber taper coupler and it reaches its maximum value atδ
0=
δ
c. The cavity buildup factor (B) is
(
)
ex2 tot s 0 2 0 2 2 2 c 0 2 in 2 s
Q
Q
L
n
t
1
E
E
B
π
λ
=
τ
κ
δ
+
δ
=
=
(3.9)The output field amplitude can be deduced from equation 3.3 and 3.8:
( )
( ) (
)
t
E
( )
t
i
1
t
E
t
E
i 0 2 0 c i o⎟⎟
⎠
⎞
⎜⎜
⎝
⎛
τ
κ
ω
∆
+
δ
+
δ
−
=
( ) (
) ( )
E
t
i
2
t
E
i 0 c c iδ
+
δ
+
∆
ω
δ
−
=
(3.10)And the normalized transmission of the cavitiy (T) is given by
( )
( )
(
) ( )
2 2 c 0 c 0 2 i 2 o4
1
t
E
t
E
T
ω
∆
+
δ
+
δ
δ
δ
−
=
=
(
) (
)
20 ex 0 2 ex 0 ex 0
/
Q
Q
Q
Q
Q
Q
4
1
ω
ω
∆
+
+
−
=
(3.11)Both the resonator buildup factor and transmission can be described as function of the quality factors of the resonator, therefore the quality factors are very important parameter to characterize the fiber taper coupled resonator. The intrinsic quality factor is a decided by the resonator itself, while the external quality factor changes with the transmission coefficient t, which changes with the geometry of the coupling (i.e. overlap between the resonator mode and the fiber taper coupler mode). As noted in equation 3.11, the transmission of the resonator is decided by the relation between the intrinsic quality factor
and controllable external quality factor . The intrinsic quality factor is a constant for a given cavity, but the external quality factor changes with the loading
in
Q
Q
exQ
inex
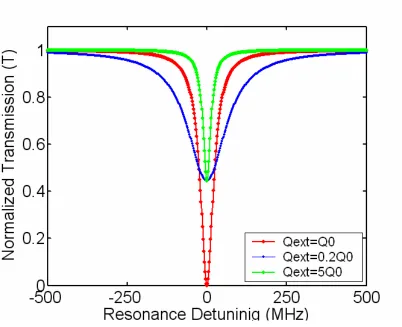
Figure 3.4. Different coupling regimes for a cavity with the intrinsic quality factor Qo of 1×10⁸.
conditions. Figure 3.4 is a plot of the resonator transmission T against the phase shift for different loading condition.
(1) Under-coupled regime: Due to the loss mechanisms, the resonator has a limited intrinsic quality factor . When the fiber taper is far away from the resonator, the coupling between them is very weak and the overlap between the fiber taper mode and resonator mode is close to zero, i.e.
in
Q
1
t
→
, and . When the fiber taper get closer to the resonator, the overlap of the modes increase, decreases but still larger than , then the transmission T decrease continuously from unity and approaches zero gradually.∞
→
ex
Q
ex
Q
in
Q
(2) Critical-coupled regime: When the fiber taper get close to the resonator to a such point (critical coupling point) that is equal to , the normalized transmission is zero, which means that all the input power is coupled into the cavity.
ex
Q
Q
in(3) Over-coupled regime: When the fiber taper approaches the cavity further after the critical coupling point, the overlap of the modes become larger and the decrease further. The normalized transmission becomes smaller than 1 again and it’s called over-coupled regime.
ex
Q
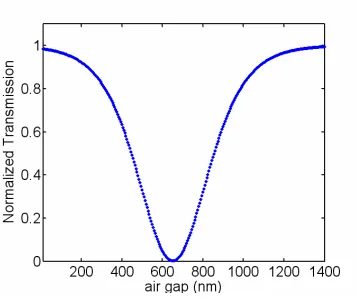
Figure 3.5. Normalized transmission of a fiber taper coupled microsphere versus the air gap between the microsphere and the taper.
diameter of 60 µm. In the under-coupled regime, the transmission decreases gradually when the air gap decreases, and become zero at critical coupling, then it increases if the air gap decrease further.
3.6Phase matching between the microcavities and the fiber-taper coupler
The amount of power coupled out of the fiber into the sphere is proportional to
(
2)
0
diameter of the microsphere and
∆
β
is the difference in the propagation constants between the fiber mode and the sphere mode. The coupling efficiency is maximized at the phase matching condition, where∆
β
is equal to zero.3.7Conclusion
C h a p t e r 4
OPTICAL MATERIALS BY SOL-GEL PROCESS
4.1 Introduction
The sol-gel method is a wet-chemical synthesis technique for preparation of oxide gels, glasses, and ceramics at low temperature. It’s based on control of hydrolysis and condensation of alkoxide precursors. As early as the mid-1800s, interest in the sol-gel processing of inorganic ceramics and glass materials has begun with Ebelman and Graham’s studies on silica gels [24]. The investigator recognized that the product of hydrolysis of tetraethoxysilane (TEOS) under acidic conditions is SiO2. In the 1950s and 1960s Roy and co-workers used sol-gel method to synthesize a variety of novel ceramic oxide compositions with very high levels of chemical homogeneity, involving Si, Al, Zr, etc, which couldn’t be made using traditional ceramic powder methods [25-28]. It’s possible to fabricate ceramic or glass materials in a variety of forms, such as ultra-fine powers, fibers, thin films, porous aerogel materials or monolithic bulky glasses and ceramics [29]. Since then powders, fibers, thin films and monolithic optical lens have been made from the sol-gel glass.
The sol-gel process, as the name implies, involves transition from a liquid ‘sol’ (colloidal solution) into a ‘gel’ phase [30]. Usually inorganic metal salts or metal organic compounds such as metal alkoxide are used as precursors. A colloidal suspension, or a ‘sol’ is formed after a series of hydrolysis and condensation reaction of the precursors. Then the sol particles condense into a continuous liquid phase (gel). With further drying and heat treatment, the ‘gel’ is converted into dense ceramic or glass materials. Generally three reactions are used to describe the sol-gel process: hydrolysis, alcohol condensation and water condensation. Because water and alkoxides are immiscible, alcohol is commonly used as co-solvent. Due to the presence of the co-solvent, the sol-gel precursor, alkoxide, mixes well with water to facilitate the hydrolysis.
Si
OR
H
OH
Si
OH
R
OH
(4.1)| | Hydrolysis | | tion esterifica Re
−
+
−
−
⎯
⎯
⎯
⎯
→
⎯
−
+
−
−
⎯ ⎯ ⎯ ⎯ ⎯ ⎯ ⎯ ←4.2.1 Hydrolysis and condensation
Although hydrolysis can occur without additional catalyst, it has been observed that with the help of acid or base catalyst the speed and extent of the hydrolysis reaction can be enhanced. Under acid conditions, the alkoxide group is protonated rapidly. As a result, electron density is withdrawn from the silicon atom, making it more electrophilic with partial positive charges. Therefore it’s more susceptible to be attacked by the nucleophile, water molecule. Subsequently a penta-coordinated transition state is formed with SN2 type characters, where there is simultaneous attack of the nucleophile and displacement of the leaving group. When the nucleophile attacks the center atom, Si, it’s on the opposite side to the position of the leaving group, R-OH. Finally the transition state decays by breaking of the Si-OHR bond and ends up with an inversion of silicon configuration as shown in equation 4.2. The acid-catalyzed mechanism can be described as following:
Si
OR
H
Si
O
R
| H | | Fast | |
−
+
⎯
⎯ →
⎯
−
−
−
−
+ ⎯⎯ ← + (4.2)OH
R
OH
Si
O
Si
O
H
O
H
R
O
Si
| | H H | R H H | | |⎥
⎦
⎯
⎯→
−
−
+
−
⎤
⎢
⎣
⎡
−
−
⎯→
⎯
−
+
−
−
−
⎯⎯ ← + ∨ ⎯⎯ ← • • +group with inversion configuration of the silicon tetrahedron. The mechanism of the base-catalyzed mechanism can be described as following:
H
O
Si
O
R
H
O
Si
O
R
H
O
OR
Si
| | | |⎥
⎦
⎯
⎯→
−
−
−
−
⎤
⎢
⎣
⎡
−
−
−
−
⎯→
⎯
+
−
−
∨ − ⎯⎯ ← − ∨ ⎯⎯ ← − • •− (4.3)
⎯⎯
←
⎯→
−
−
+
⎯
Si
OH
RO
|
|
4.2.2 Gelation
In the gelation step, alkoxide gel precursor undergoes polymerization (condensation) reaction with by-product of water or alcohol. Similar to hydrolysis, the condensation reaction is also affected the acid/base catalyst. With the existence of acid catalyst, weakly-crosslinked polymer is formed and can easily aggregate after drying yielding low-porosity microporous structure. On the contrary, if base catalyst is used, discrete highly branched clusters are formed and lead to a mesoporous structure after gelation.
Si
OH
Si
OH
Si
O
Si
H
OH
(4.4)| | | | on Condensati Water | | | | Hydolysis
−
+
−
−
−
−
⎯
⎯
⎯
⎯
→
⎯
−
−
+
−
−
⎯ ⎯ ⎯ ⎯ ⎯ ←
Si
OH
Si
R
Si
O
Si
R
OH
(4.5)4.2.3 Ageing
The continuing chemical and physical changes during ageing after gelation are very important. During this process, further cross-links continuous, the gel shrinks as the covalent links replace non-bonded contacts and the pore sizes and pore wall strengths change with the evolution of the gel’s structure.
4.2.4 Drying
The gel has a high ratio of water and three dimensional inter-connected pores inside the structure. Before the pore is closed during the densification process, drying is needed to remove the liquid trapped in the interconnected pores. On the other hand removal of the liquid from the tiny pores causes significant stress resulting from inhomogeneous shrinkage. Therefore the main problem that had to be overcome is cracking due to the large stress in the structure. For small cross sections, such as powder, coating, or fiber, the drying stress is small and can be accommodated by the materials, so no special care is needed to avoid cracking for those sol-gel structures. While for monolithic objects greater than 1 cm, drying stress developed in ambient atmosphere can introduce catastrophic cracking, as a result control of the chemistry of each processing step is essential to prevent cracking during drying.
Although there are many applications of sol-gel silica prepared and dried at or near room temperature (especially those involving trapping functional organic or biological molecules with the gel pores), heat treatment of the porous gel at high temperature is necessary for the production of dense glass or ceramics from the gel silica. After the high temperature annealing, the pores are eliminated and the density of the sol-gel materials ultimately becomes equivalent to that of the fused glass. The densification temperature depends considerably on the dimension of the pores, the degree of connection of the pores, and the surface areas in the structure [24].
4.2.6 Advantages and limitations of sol-gel method
Sol-gel method is a very flexible way to fabricate glass/ceramics under mild condition. From the introduction above, the advantages of the sol-gel method become apparent [17, 31-33]:
1. Sol-gel method involves wet chemical synthesis of materials, so the composition of the materials can be tailored at molecular level. As a result, stoichiometrical homogeneous control of the doping is easily achieved.
2. Since liquid precursors are used it’s possible to cast the glass and ceramics in a range of shapes, such as thin film, fibers, and monoliths, etc, without the need of machining or melting.
4. It’s cost effective because the temperatures required in the process are low, close to room temperature, and no delicate vacuum system is needed.
Despite all the advantages, sol-gel method still has some limitation. Solvents, such as alcohol and water, are involved in the process, so it’s not appropriate for fabrication which is very sensitive to solvents. Furthermore, stress induced cracks upon drying are not unusal and can’t be healed after densification. Very careful attentions are needed to avoid cracking. Despite of the disadvantages, sol-gel method is a very mild and flexible method to fabrication materials that possess properties not attainable by other methods. It inspires us to further investigate and modify the method to exploit its maximum value in application.
4.3 Fabrication of sol-gel films for photonic application
(a) (b) (c)
Figure 4.1. Schematic of fabrication of sol-gel films on a substrate: (a)
Figure 4.1 shows a schematic of the preparation procedure of sol-gel films on a glass or silicon substrate. First, organometallics (such as metal alkoxides) and dopants are put in an alcohol solvent, such as ethanol or isopropanol. Then the water is added to hydrolyze the organometallics. After hydrolysis and condensation reaction for certain time (ranges from several hours to several days under different condition), a viscous gel is formed. After aging the sol solution at room temperature, a layer of sol-gel film is deposited on a substrate by spin-on or dip-coating method. The thickness of the films is decided by the viscosity of the sol solution, the spin speed for the spin-on method, or dipping time for the dip-coating method.
4.4 Characterization of sol-gel silica film with Fourier Transform Infrared Spectrometer (FTIR)
Infrared spectroscopy is the study of the interaction of infrared light with matter [34]. When infrared radiation interacts with matter it can be absorbed, causing the chemical bonds in the materials to vibrate. Chemical structures within molecules, known as functional groups, tend to absorb infrared radiation in the same wavenumber range regardless of the structure of the rest of the molecules. The correlation between the wavenumber and molecule structures makes it possible to identify the structure of unknown molecules. For instance, the peaks around 3000 cm-1 are due to C-H stretching bond.
structure of sol-gel silica with that of thermally grown silica. Figure 4.2 shows the evolution of the reflectance infrared spectra as a function of annealing temperature. The characteristic
1200
1000
800
600
400
1200 0C
10000C
8000C
6000C
4000C
R
e
fl
e
c
tio
n
(a
.u
.)
Wavenumber (cm-1)
2000C
thermal Silica
Figure 4.2. FTIR spectra of thermal silica and sol-gel silica samples prepared with different heat treatment.
asymmetric stretching (near 1105 cm-1) are clearly shown in figure 4.2 [35]. When the annealing temperature is 200° C, a weak absorption band at ~964 cm-1 is observed, which is attributed to stretching vibration of silanol Si-OH hydrogen bonded groups. The
excited Er3+ can be quenched through non-radiative relaxation by coupling to a quenching site, such as hydroxyl group OH-. This absorption band disappears at
temperature of 600 °C. In addition, compare with the spectra of others, the spectra of the sample heated at 1000° C and 1200° C have stronger, broader and blue-shifted Si-O-Si bands. The changes in the spectra indicate the complete densification of silica films after heat treatment [36]. Furthermore, as the temperature is increased, the absorption band due to Si-O-Si bending becomes stronger. It shows that the crosslink between silica chains are improved gradually due to progressively enhancement of condensation reaction under higher densification temperature. The spectra of the samples heated at 1000° C and 1200° C are similar to that of the thermally grown silica.
4.5 Effect of anneal temperature on etching rate of sol-gel film in buffered Fluoride acid (HF)
decreases to 15 Å/s, which is almost the same as that of the thermally grown silica (13 Å /s). This result is consistent with the blue shift of the Si-O-Si bond in FTIR which indicates an increase of the average Si-O-Si bond angles [38]. The etching rate
experiment confirms that the microstructure of the sol-gel silica annealed at temperature as high as 1000 °C is the very close to that of the thermally grown silica.
4.6 Conclusion
In this work, silica thin film has been prepared by the sol-gel method. A Fourier Transform Infrared Spectroscopy (FTIR) is used to analyze the composition of the silica sol-gel prepared in the lab. It shows that the sol-gel silica annealed at temperature at or above 1000 °C is very similar to thermal silica. Furthermore the etch rate in buffered HF solution of thin films annealed at different temperature was investigated. The etch rate of the films has been shown to change by almost two orders of magnitude for undensified and densified sol-gel films. This result can later be used to selectively coat the surface of a microtoroid cavity on a silicon chip which will be discussed in chapter 6.
C h a p t e r 5
SURFACE FUNCTIONALIZATION OF SILICA MICROSPHERE RESONATORS
5.1Introduction
Microcavities formed by surface tension (droplets and solid spheres or spheroids) can exhibit quality factors in excess of one billion and are of interest in cavity QED, nonlinear optics, photonics and sensing. When silica microspheres are doped using any number of rare earth ions, ultra-low threshold micro lasers are possible [3, 12, 39]. The preparation of these devices requires acquisition of bulk samples of rare-earth doped glass that are subsequently processed into a spherical cavity. Here, an alternative to this process is presented in which ready-made microspheres of undoped silica serve as a base resonator structure and gain functionalization of the surface is performed using an erbium-doped sol- gel film. Sol-gel films are readily doped with a number of different rare earth ions [40-42], as well as other materials [43, 44], thereby making this a more versatile method for preparation of active microspheres. In addition, the sol-gel preparation process allows for precise control of dopant concentration, making possible the study of a range of inversion concentrations. F