Feature Selection for Cancer Classification:
An SVM based Approach
El Sayed Abdel Wahed
Researcher
College of Computing &
Information Technology
Arab Academy for Science and
Technology & Maritime Transport
Ibrahim Al Emam
Professor of Computer Science
College of Computing &
Information Technology
Arab Academy for Science and
Technology & Maritime Transport
Amr Badr
Professor of Computer Science
Faculty of Computers &
Information
Cairo University
ABSTRACT
Cancer is an immense problem facing Egypt and a notorious human being killer. The magnitude of the disease remains unknown. In fact, it is a significant health problem in many other developing countries. The burden of such a predicament will eventually diminish by better diagnosis and classification. Classification is a machine learning technique used to predict the correlation between data samples and classes. There are several classification techniques, among which are: Support Vector Machine (SVM), K-Nearest Neighbor (k-NN) and Naive Bayes (NB) Classifier. Feature Selection for the classification of cancer data means discovering feature values and profiles of diseased and healthy samples. It also means using this knowledge to predict the state of new samples. In this paper, we have proposed an approach for feature selection based on using SVM in three different ways. First, using SVM as a classifier to build a model based on the training data. The purpose is to measure the accuracy of the model in predicting the category of the test data compared with other classifiers. Second, using SVM as a learner, where data is clustered via K-Means into 3, 4 and 5 clusters. Different classifiers are then applied to the clustered data such as SVM, K-NN and NB. A number of 2 validation methods are used to help predict the accuracy of each classifier. These methods are: the 10-Fold Cross Validation (CV) and the Leave-One-Out. Third, using SVM for feature weighting, by predicting feature importance relative to a target class. The experimental results show that SVM classifier presents best accuracy as a classifier, a learner, and a feature weighting method compared with other classifiers used in this study.
General Terms
Data Mining, Feature Selection, Cancer Classification.
Keywords
Feature selection, Cancer Data, Classification, K-Means, Support vector machine, K-NN, Naive Bayes.
1.
INTRODUCTION
Cancer is already a significant health problem in many developing countries. The Egyptian Government started an initiative in May 2007 to establish the National Cancer Registry Program of Egypt (NCRPE) [1]. This national program aims to develop a reliable source of information about cancer incidence in Egypt. It further attempts to give clues to the burden and pattern of cancer in a selected number of Egyptian provinces. The data of Aswan province is used in this study to make an intensive analysis on the techniques available for finding the patterns among the data samples. Then we can analyze the results of the different used feature selection algorithms, which give a significant meaning to classify the features that cause cancer.
Feature selection is the process of choosing a subset of input variables by eliminating irrelevant features [2]. The elimination of irrelevant features reduces the dimensionality of data. It may also allow learning algorithms to operate faster and more effectively. Feature selection is an active research area in machine learning, pattern recognition, and data mining. Feature selection consists of four phases: feature subset generation, feature subset evaluation, stopping criterion, and validation [3]. There are different methods of feature selection based on search strategies and evaluation functions. The basic approach to subset generation is to start with an empty set and then add features to it based on the evaluation criteria. Also this technique is known as Forward Search. The second type is called Backward Search, which starts with a full set of features then removes them consecutively. The third type is called Bi-Directional search where features are added and removed simultaneously [4]. Another simple technique for the feature selection is the variable ranking of the input features based on the correlation with the target class or the target attribute [5].This method is used to differentiate between diseased and healthy genes [6]. This paper is organized as follows: The classification algorithms that are studied in this paper are briefly described in Section2. Related work on feature selection of the cancer data are outlined in Section 3. The experimental results are reported in Section 4 including our analysis on the results. Finally some conclusions are provided in Section 5.
2.
BACKGROUND
2.1
K-Means Clustering
K-Means clustering is a technique of cluster analysis that aims to partition a given set of data into K number of clusters. In this case, the value of K is known in advance and each observation belongs to the cluster with the nearest mean [7]. The algorithm starts by define K centroids, one for each cluster. After that, every point of data set is classified to the nearest centroid.
__________________________________________________ Input: D = {d1, d2,...,dn} //set of n data items.
K // Number of desired clusters
Output: A set of K clusters.__________________________________________________ 1. Arbitrarily choose K data-items from D as initial
centroids; 2. Repeat
Assign each item di to the cluster which has the closest centroid;
Calculate new mean for each cluster; Until convergence criteria is met.
2.2
Support Vector Machine (SVM)
Support Vector Machine (SVM) is a supervised learning method used for data analysis and pattern recognition, SVM is widely used in classification and regression analysis [8]. An SVM training algorithm builds a model that assigns new samples to a related class. An SVM model is a representation of samples as points in space, a linear function is used so that the examples of the separate classes are divided by a clear gap. The gap should be as wide as possible. New samples are classifieds based on which side of the gap they fall on [9].
2.3
K-Nearest Neighbor (k-NN)
K-NN is an instance-based learning technique for classifying objects based on the nearest training examples of the feature space. K-NN compares the input sample with every training sample and chooses the K nearest training samples. One disadvantage about the K-NN is that the speed of the algorithm goes slower as the number of training samples increases because it requires all of them to be loaded in the memory. On the other hand, accuracy decreases when the training set is too small [10].
2.4
Naive Bayes (NB)
NB is a Probabilistic Classifier based on the Bayes' rule. An NB classifier assumes that the features should be independent given the class variable. An advantage of the NB classifier is that it requires a small amount of training samples to estimate the parameters necessary for classification. The NB classifier is effectively used in many applications such as text classification and medical diagnosis [11].
3.
RELATED WORK
Huiqing Liu [12] has presented a Comparative Study on Feature Selection and Classification Methods. A number of two data sets have been used for the experiment. The first is Leukemia data set and the second is proteomic patterns from ovarian cancer patients. A number of four classifications methods are used in the study which are k-nearest neighbour, C4.5, Naive Bayes, and Support Vector Machines.
Nevine M. Labib[13], has conducted a research that uses data mining tool, SPSS modeler 8.1 or Clementine, to apply Decision Trees technique. Used data set was has been extracted from the cases of the Egyptian specialized cancer institutes.
Yin-Wen Chang [14] has conducted a study on Feature Ranking. The study used Linear SVM by exploring the performance of combining linear support vector machines with various feature ranking methods. His Experiments have shown that a feature ranking using weights from linear SVM models yields good performances.
Debahuti Mishra [15] has presented two methods of feature selection using SNR ranking. In the first method, the data is clustered by K-Means. The SNR ranking is then implemented. A total of two classifiers have been used for validation, SVM and k-NN.
In the second method, the dataset is ranked by SNR; and the top scored features are classified and validated. Leukemia dataset has been used for the experiment and the
10-Fold CV method has been used to validate the classifiers.
4.
EXPERIMENTAL EVALUATION
4.1
Used Dataset
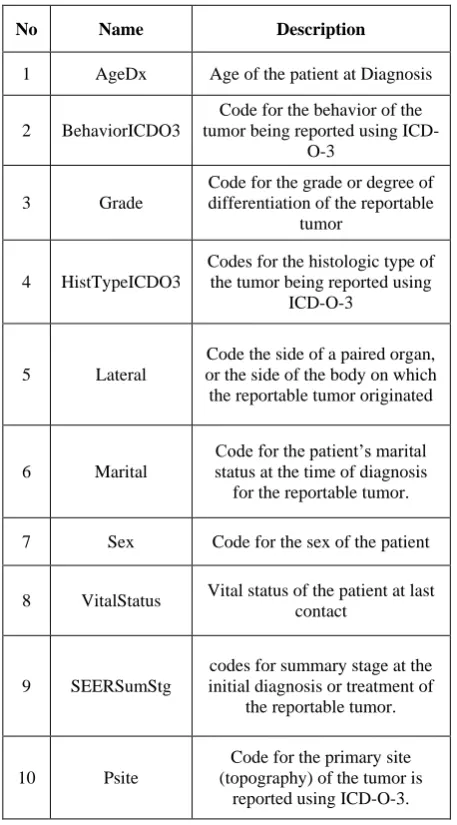
[image:2.595.315.544.188.601.2]In this study, the used dataset is derived from the central database of the National Cancer Registry Program of Egypt [1]. This dataset represents a profile of cancer patients residing in Aswan throughout 2008. It consists of five sections covering patient identifications, patient demographics, cancer specific data, hospital specific data and follow-up.
Table 1. Data set used in study (Aswan Cancer Data 2008)
No Name Description
1 AgeDx Age of the patient at Diagnosis
2 BehaviorICDO3
Code for the behavior of the tumor being reported using
ICD-O-3
3 Grade
Code for the grade or degree of differentiation of the reportable
tumor
4 HistTypeICDO3
Codes for the histologic type of the tumor being reported using
ICD-O-3
5 Lateral
Code the side of a paired organ, or the side of the body on which the reportable tumor originated
6 Marital
Code for the patient’s marital status at the time of diagnosis
for the reportable tumor. 7 Sex Code for the sex of the patient
8 VitalStatus Vital status of the patient at last contact
9 SEERSumStg
codes for summary stage at the initial diagnosis or treatment of
the reportable tumor.
10 Psite
Code for the primary site (topography) of the tumor is
reported using ICD-O-3.
Table 2. Categorizing the data set according to the Psite Value
Category Psite Value
Value Start End
LIP, ORAL CAVITY AND
PHARYNX C00 C14 1
DIGESTIVE SYSTEM C15 C26 2
RESPIRATORY SYSTEM AND INTRATHROACIC
ORGANS
C30 C39 3 BONES, JOINTS AND
ARTICULAR CARTILAGE C40 C41 4 HAEMATOPOIETIC AND
RETICULOENDOTHELIAL SYSTEMS
C42 C42 5
SKIN C44 C44 6
PERIPHERAL NERVES AND AUTONOMIC NERVOUS
SYSTEM
C47 C47 7 RETROPERITONEUM AND
PERITONEUM C48 C48 8
CONNECTIVE, SUBCUTANEOUS AND OTHER SOFT TISSUES
C49 C49 9
BREAST C50 C50 10
FEMALE GENITAL
ORGANS C51 C58 11
MALE GENITAL ORGANS C60 C63 12
URINARY TRACT C64 C68 13
EYE, BRAIN AND OTHER PARTS OF CENTRAL
NERVOUS SYSTEM
C69 C72 14 THYROID AND OTHER
ENDOCRINE GLANDS C73 C75 15
OTHER AND ILL-DEFINED
SITES C76 C76 16
LYMPH NODES C77 C77 17
UNKNOWN PRIMARY SITE C80 C80 18
Subsequently, the obtained dataset following the second step of pre-processing phase comprised 959 samples, 11 attributes for each. This outcome is due to the addition of a new attribute for each sample, determining the category of each sample and clustering the data into 18 different types.
4.2
Results
The experiments, using the three classifiers as feature weighting methods and as classifiers, have been conducted in SPSS Modeler 14.1. This tool is a data mining application that offers a variety of modeling methods taken from machine learning, artificial intelligence, and statistics. The experiments, using the three classifiers as learners, have been conducted on Orange version 0.2b. It is an open source data visualization and analysis tool for data mining through visual programming or Python scripting. All of the experiments have
been performed on windows 7 enterprise, PC of Intel Core 2 Due CPU.
4.2.1
Using SVM as a classifier
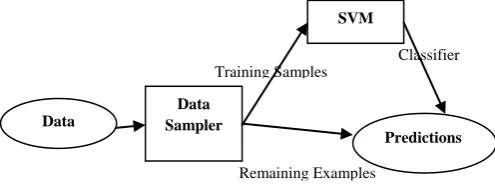
[image:3.595.310.558.187.279.2]An SVM can be used as a classifier that may be used to predict classes and class probabilities, given a set of new samples. We have split dataset into two sets, training samples and remaining examples. The training data was sent to SVM to produce a classifier used later in classifying the remaining examples as shown below in figure 1.
Fig 1: Proposed model for using SVM as a classifier
The SVM node of the SPSS Modeler offers a choice of kernel functions for performing its processing. Given the difficulty in identifying which function performs best with any given dataset, we have taken the liberty of choosing and studying various functions individually. The results are compared soon after. Listed below are the results obtained following experimenting the RBF (Radial Basis Function)and the polynomial functions.
Table 3. Accuracy of SVM classifier according to kernel value
Classifier Correct Wrong Accuracy
SVM(RBF) 833 126 89.9%
SVM(Poly) 957 2 99.9%
Table 3 shows that the polynomial function correctly predicts 99.9% of the cases. However, the RBF function has properly indicates 89.9% of the cases. we have tested the same model using two other different classifiers, which are KNN and NB. Results are recorded below in table 4.
Table 4. Accuracy of KNN and NB classifiers
Classifier Correct Wrong Accuracy
K-NN 785 174 81.9%
NB 821 138 85.6%
Table 4 shows that the NB classifier correctly predicts 85.6% of the cases. However, the K-NN classifier properly indicates 81.9% of the cases .The comparison of accuracy for SVM, K-NN, and NB classifiers is given bellow in Fig.2.
Training Samples
Remaining Examples
Classifier
Data
Data Sampler
SVM
Fig 2: Accuracy chart for SVM, K-NN, NB classifiers
Figure 2 exhibits that SVM with polynomial kernel functions displays high prediction accuracy amounting to 99.9 percent.
4.2.2
Using SVM as a learner
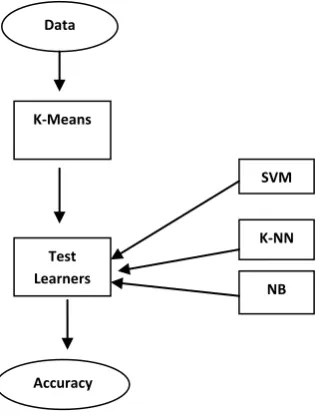
In order to construct the model for SVM learner and compare it in cross-validation with Naive Bayes and k Nearest Neighbors learners, data is initially clustered by applying K-Means clustering algorithm. In our approach the model has been tested with three, four, and five clusters. Data was then tested by different learners. The learners used are SVM, K-NN and NB. For validation purposes, the team has applied the 10-Fold CV method and the Leave-One-Out method as shown below in Fig. 3.
Fig 3: Proposed model for comparing the accuracies of SVM , K-NN, & NB learner
The performance of different learners with respect to the number of clusters is recorded below in table 5.
Table 5 . Accuracy of the three learners with 10 fold CV
learner
10 fold CV accuracy (%) according to number of clusters
3 Clusters 4 Clusters 5 Clusters
SVM 90 91.2 90
NB 80.8 82.3 80.1
K-NN 91.2 92.2 91.2
Based on table 5, it is clear that the K-NN learner gives better accuracy than the SVM and the NB classifiers with 3, 4 and 5 clusters in the 10-Fold CV method. It can also be approved that NB classifier gives the lowest result via the 10-Fold CV method. The comparison of the accuracy of the three learners is given bellow in fig.4.
Fig 4 : Accuracy of SVM, k-NN and NB learners with 10fold cross validation
As seen in fig. 4, analysis confirms that both K-NN and SVM learners provide better accuracy than NB classifier with 10 Fold CV.
[image:4.595.312.549.272.457.2]Leave-One-Out validation method has been used to figure out the accuracy of the three classifiers with the above proposed model. The accuracy of these learners with the Leave-One-Out validation method is presented in table 6.
Table 6. Accuracy of the three learners with leave-one-out
Learner
Leave-One-Out accuracy (%) according to number of clusters
3 Clusters 4 Clusters 5 Clusters
SVM 94.6 91.2 90.9
NB 80.0 82.2 81.3
K-NN 92.1 91.9 91.7
As can be seen from Table 6, the SVM presents best accuracy with 3 clusters in Leave-One-Out validation method, which is 94.6%. The comparison of accuracy of SVM learner in both
0
20
40
60
80
100
120
SVM(RBF) SVM(Poly)
K-NN
NB
Accuracy Chart for SVM, K-NN, and
NB
70
75
80
85
90
95
3 Clusters 4 Clusters 5 Clusters
Accuracy Chart for SVM, K-NN, and NB
with 10 Fold C V
SVM
NB
K-NN
Data
K-Means
Test Learners
Accuracy
SVM
K-NN
[image:4.595.122.283.421.630.2]10 Fold Cross Validation and Leave-Out-one is illustrated bellow in Fig.5.
Fig 5: Accuracy of SVM with the Two Methods
[image:5.595.339.526.280.511.2]Fig.5 shows that SVM provides better results via the Leave-One-Out validation method than the 10-Fold CV method, with 3 and 5 clusters. However, SVM gives the same accuracy with 3 clusters in 10-Fold CV, and Leave-One-Out validation methods.
Fig 6: Accuracy of NB with Two Methods
Fig. 6 shows that NB Learner gives better result in 10fold cross validation method than Leave-One-Out validation method, with 3 and 4 clusters.
Fig 7: Accuracy of K-NN with 10 Fold CV and Leave-One-Out
As shown in Fig.7, K-NN gives better accuracy using the Leave-One-Out validation method with 3 and 5 clusters. However ,K-NN offered better results via the 10-Fold CV than the Leave-One-Out validation method with 4 clusters.
4.2.3
Using SVM as a feature weighting method
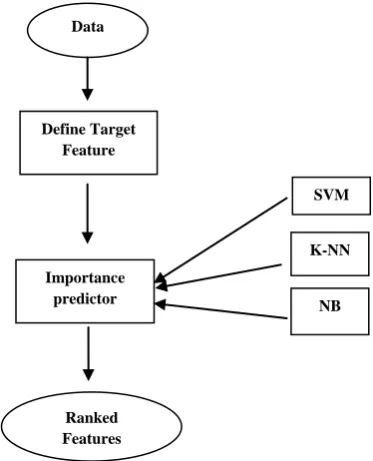
An SVM can be used for feature selection using the importance score method. The method is based on the determining degree of dependence between the target class and other features. This dependence is determined in a form of score for each feature.Score is a number between zero and one. A search is applied in the descending order of the importance scores for the features to obtain the minimum set of features that perform the highest predictive accuracy. Figure 8 shows a description of the proposed model for using SVM as a feature ranking method.
Fig 8: Proposed model for feature ranking using SVM , K-NN, & NB classifiers
SPSS Modeler 14.1 offers a strategic approach to finding useful relationships in large data sets .SPSS modeler was used for building the above described model for feature selection. The SVM node on the SPSS modeler has an option for calculating variable or feature importance that should be selected when building the model. After running the model, data in the below figure 9, which shows the degree of dependence between the target class and each feature, was obtained.
86
88
90
92
94
96
3
4
5
Acc
u
racy
%
NO. of Clusters
Accuracy of SVM learner with 10 Fold CV and Leave-One-Out
10 Fold CV
Leave-One-Out
78
79
80
81
82
83
3
4
5
Accu
ra
cy
%
No. of Clusters
Accuracy of NB Learner with 10 Fold CV and Leave-One-Out
10 Fold CV
Leave-One-Out
90.6
90.8
91
91.2
91.4
91.6
91.8
92
92.2
92.4
3
4
5
Accu
ra
cy
%
No. of Clusters
Accuracy of K-NN with 10 Fold CV and
Leave-One-Out
10 Fold CV
Leave-One-Out
Data
Define Target Feature
Importance predictor
Ranked Features
SVM
K-NN
[image:5.595.52.282.321.498.2] [image:5.595.54.284.548.741.2]Fig 9: Features Ranking using SVM classifier
From Fig. 9, we can conclude that Psite feature has easily the greatest effect in predicting the class value for the data samples is proved. HistType and Sex are also quite significant. It is also proved that the model predicts the feature importance correctly. This is because the Psite value was used in categorizing the data samples during the preprocessing phase .
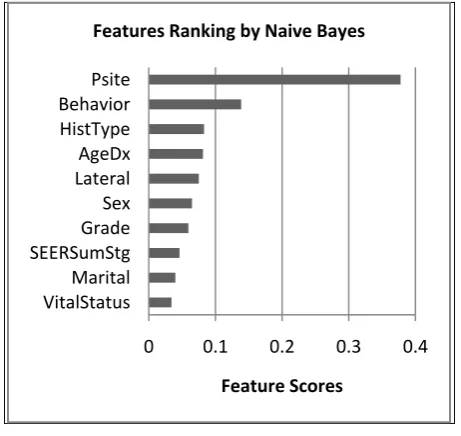
[image:6.595.312.546.70.281.2]We have implemented the same model using Naive Bayes classifier, and features scores are illustrated in Figure 10 .
Fig 10: Features Ranking using NB classifier
As shown in fig.10, it is concluded that Psite feature has easily the greatest importance, while VitalStatus feature has the lowest importance. Finally, the same model has been implemented using K-NN classifiers and features scores are outlined below in Figure 11.
Fig 11: Features Ranking using K-NN classifier
Fig.11 explains that AgeDx feature has the greatest importance, while Marital feature has the lowest one. The comparison of the performance of the three classifiers, as feature weighting methods, is recorded below in table 7.
Table 7. Comparison of the three classifiers as feature scoring methods
Classifier Feature No.
( Top 3 Ranked ) Feature Score
SVM 10 0.69
4 0.09
7 0.08
NB 10 0.38
2 0.14
4 0.08
K-NN 1 0.14
5 0.11
7 0.1
Table 7, illustrates that Psite feature has the greatest score by using two classifiers, SVM and NB classifier . The same feature was not selected as one of the top ranked features, which indicates that the K-NN is giving the lowest accuracy as a feature weighting method. As mentioned before, the Psite feature value has been used in determining the category of each data sample during the categorization process performed in pre-processing phase .
.
0
0.2
0.4
0.6
0.8
Marital
Behavior
AgeDx
Grade
SEERSumStg
VitalStatus
Lateral
Sex
HistType
Psite
Feature Scores
Features Ranking by SVM
0
0.1
0.2
0.3
0.4
VitalStatus
Marital
SEERSumStg
Grade
Sex
Lateral
AgeDx
HistType
Behavior
Psite
Feature Scores
Features Ranking by Naive Bayes
0
0.05
0.1
0.15
Marital
VitalStatus
HistType
Behavior
Lateral
[image:6.595.318.538.388.633.2] [image:6.595.52.283.430.648.2]5.
CONCLUSIONS
Aforementioned comparative study, it is concluded that SVM can be used for feature selection in three different ways. First, by using SVM as a classifier, it is evident that the combination of SVM with polynomial kernel functions can yield high classification accuracy compared with the other two classifiers, which are K-NN and NB.
Second, by using SVM as a learner ,it is manifested that clustering data before classification helps improve the accuracy of classification. This is due to the fact that the clustering method helps to group similar features in the same cluster. The SVM learner gives good accuracy via both 10-Fold CV and Leave-One-Out validation methods. The accuracy of the learning algorithms varies depending on the change of number of clusters.
Third, By using SVM as a feature weighting methods, it is obvious that SVM and NB classifiers present better accuracy as feature weighting methods than the K-NN Classifier.
6.
REFERENCES
[1] (2009) The NCRPE website. [Online]. Available: http://www.cancerregistry.gov.eg/
[2] Payam Refaeilzadeh , Lei Tang , Huan Liu,” On Comparison of Feature Selection Algorithms”
[3] M. Ramaswami and R. Bhaskaran,” A Study on Feature Selection Techniques in Educational Data Mining” ,Journal of Computing, Vol. 1, Issue 1, Dec. 2009. [4] Petr Somol, Jana Novoviˇcov´a and Pavel Pudil,”
NOTES ON THE EVOLUTION OF FEATURE SELECTION METHODOLOGY”. KYBERNETIKA , VOL. 4 3, NUMBER 5 , P.7 1 3 – 7 3 0,2007
[5] Ulf Johansson, Cecilia S¨onstr¨od, Ulf Norinder,Henrik Bostr¨om, and Tuve L¨ofstr¨om, ” Using Feature Selection with Bagging and Rule Extraction in Drug Discovery”, G. Phillips-Wren et al. (Eds.), SIST 4, pp. 413–422.,2010
[6] Isabelle Guyon, Andr´e Elisseeff ”, An Introduction to Variable and Feature Selection ”, Journal of Machine Learning Research ,pp 1157-1182,2003
[7] K. A. Abdul Nazeer, M. P. Sebastian, “Improving the Accuracy and Efficiency of the k-means Clustering Algorithm” , WCE, Vol. I, 2009
[8] DC Sansom, T Downs and TK.Saha,” Evaluation of support vector machine based forecasting tool in electricity price forecasting for Australian national electricity market participants ”, Journal of Electrical & Electronics Engineering, Australia, Vol 22, No. 3,2003 [9] Huiqing Liu, Jinyan Li, and Limsoon Wong, “A
Comparative Study on Feature Selection and Classification Methods Using Gene Expression Profiles and Proteomic Patterns”, Genome Informatics 13,P. 51-60 ,2002.
[10]Jing Yi Tou, 1Kenny Kuan Yew Khoo, 1Yong Haur Tay, 2Phooi Yee Lau “Evaluation of Speed and Accuracy for Comparison of Texture Classification on Embedded Platform”.
[11]I. Rish, “An empirical study of the naive Bayes classifier”.
[12]Huiqing Liu, Jinyan Li ,Limsoon Wong,” A Comparative Study on Feature Selection and Classification Methods Using Gene Expression Profiles and Proteomic Patterns” ,Genome Informatics, 13: 51-60 , 2002
[13]Nevine M. Labib, Michael N. Malek,” Data Mining for Cancer Management in Egypt Case Study: Childhood Acute Lymphoblastic Leukemia,” World Academy of Science, Engineering and Technology 8 ,2005
[14]Yin-Wen Chang,Chih-Jen Lin,” Feature Ranking Using Linear SVM” . JMLR: Workshop and Conference Proceedings, 3: 53-64,2008