Research Article
Volume 4 Issue 2 - May 2018 DOI: 10.19080/JPFMTS.2018.04.555632J Phy Fit Treatment & Sports Copyright © All rights are reserved by Sara C Winter
Centre of Mass Acceleration-Derived Variables
Detects Differences between Runners of Different
Abilities and Fatigue-Related Changes during a Long
Distance Over ground Run
Sara C Winter
1*, Susan Gordon
1,2, Sara M Brice
3and Daniel Lindsay
41College of Healthcare Sciences, James Cook University, Australia
2School of Health Sciences, Flinders University, Australia
3College of Science and Engineering, James Cook University, Australia
4College of Public Health, Medical and Veterinary Sciences, James Cook University, Australia
Submission: May 15, 2018; Published: May 22, 2018
*Corresponding author: Sara C Winter, College of Healthcare Sciences, James Cook University, Townsville, Queensland, Australia, Tel: Email:
Introduction
Long distance running is a popular activity world-wide. People run for many reasons, from recreational runners wanting
to improve their health and fitness, through to competitive
runners wanting to improve performance. Regardless of the reason, it is important that people develop a running movement
that is efficient for better running economy and performance [1-3] and to reduce risk of injury [4,5] Further, running is a very
repetitive activity, therefore better and consistent movement patterns during long distance running may help reduce impacts
Efficient running requires maintaining good postural stability and is an important requirement to conserve energy [9,10]. Coordinated movement of the thorax and pelvis during running is required to minimise acceleration at the centre of mass (COM) [10]. Greater acceleration indicates greater
postural sway or reduced dynamic postural stability and
less efficient running movement [11,12]. A single tri-axial accelerometer placed on the low back provides a reliable [13], and valid [14], method of measuring COM accelerations during
Abstract
Background: Wireless accelerometers provide a method of performing running assessments in sports-specific environments. The purpose
of this study was to investigate differences in running movement using centre of mass acceleration-derived variables between runners of varying
skill levels and examine fatigue-related changes during a long distance over ground run.
Methods: Ninety-two runners performed a self-selected paced long distance over ground run, with a tri-axial accelerometer attached to their low back. Runners were divided into four groups (elite, advanced, intermediate and slow) based on their finishing run time. Spatiotemporal (contact time, flight time, step frequency), dynamic postural stability (ratio of root mean square of accelerations), dynamic loading (peak impact
and braking accelerations) and variability (step and stride regularity), were derived from acceleration data. Speed and acceleration-derived variables were used to investigate between group differences and within group fatigue-related changes.
Results: Faster runners (elite and advanced groups) exhibited significantly shorter contact times and higher step frequencies than the slow
group. Fatigue-related changes throughout the run were only observed amongst the slower runners (intermediate and slow groups). The main
changes in the intermediate group were an increase in ratio of root mean square in mediolateral acceleration, and a decrease in speed in the
slow group.
Conclusion: The shorter contact times and higher step frequencies and no fatigue-related changes exhibited by the faster runners indicate an efficient running movement pattern. Fatigue-related changes in the slower runners were a decrease in postural dynamic stability in mediolateral direction in the intermediate group and a decrease in speed in the slow group which impacted on performance. These runners would benefit from exercise interventions and pacing strategies to reduce these fatigue-related changes and improve performance.
Keywords: Accelerometry; Running; Biomechanics; Fatigue
& Treatment in Sports
three-dimensional (vertical, mediolateral, anteroposterior)
acceleration in “sports-specific” environments. Studies utilising
this method have shown that greater COM accelerations is
associated with reduced running performance [12], and has been shown to increase with fatigue [11,15]. While these studies provide insights into efficient running movement and
fatigue-related changes, these studies were conducted in laboratory
environments using treadmills [12,15], and at set speeds [12,15], which are not applicable to “real-world” situations. Considering, approximately 94% of runner’s run outside and over ground [16], and that treadmill running is not an accurate representation of over ground running [17,18], investigating
running movement outside and over ground results in higher ecological validity. Further, runners train and race at a self-selected pace, therefore having runners run at set speeds may not be a true representation of their natural running pattern throughout a run.
In addition to measuring dynamic postural stability, COM acceleration data can also measure numerous other gait
characteristics to examine efficient and effective running movement. These include contact time, flight time, step frequency,
step and stride regularity and dynamic loading measures. Studies have reported that faster and more economical runners
typically exhibit shorter contact times [2,19], and longer flight times [2]. When able to self-select their pace, faster runners also display higher step frequencies which is related to greater speeds [2]. Again, the limitation of these studies was that they
were conducted in a laboratory and on a treadmill. Bailey et al.
[20] found that stride length and stride frequency combination
was different whether the participant was running on a treadmill or over ground at a given speed, further highlighting the importance of investigating running movement over ground
in a “real-world’ environment.
Step and stride regularity can be measured using autocorrelation procedures and allows measurement of
variability in the gait cycle [21]. Previous studies have found a decrease in step and stride regularity during exhaustive
runs, indicating fatigue-related changes of a decrease in
spatiotemporal periodicity of the running cycle [11,15]. However,
these studies were performed at a constant speed and did not separate runners into different performance-related subgroups, therefore it is unclear how this change is related to performance. Dynamic loading measures of impact and braking acceleration can be measured using vertical and anteroposterior wave forms
during the stance phase of gait [22,23]. Lower braking forces have been associated with better running performance [24], and
changes in these variables are reported to occur with fatigue
[22] found that fatigue-related changes in dynamic loading measures occurred as early as the first mile of a four mile over ground run, highlighting a need for frequent analysis of data
for a better understanding of the impact of fatigue during long
distance running [22]. Study was conducted in an over ground
environment, only dynamic loading measures were measured. Utilising the potential of COM accelerations to measure numerous gait variables will provide greater information on running movement.
Taken together, numerous gait variables can be measured using COM acceleration data collected during an over ground
run, and can inform on running movement in a “real-world”
environment. Further, the continuous collection of data allows for regular analysis of data during a run which provides information about what and when fatigue-related changes occur. Comparing runners of different skill levels and speeds can provide valuable
information about efficient running movement that allow for
better performance. This can provide valuable information to
aid in the development of specific exercise prescription, training
interventions and pacing strategies to improve performance and reduce the impact of fatigue. Therefore, the purpose of this study was to compare COM acceleration-derived variables collected
using a single wireless tri-axial accelerometer during a long
distance over ground run, across runners of different skill levels and performance speeds and investigate fatigue-related changes
in each skill level. The research questions were:
a) Are there differences in COM acceleration-derived variables between groups of runners of different performance running speed? We hypothesised that faster runners would
demonstrate significantly greater dynamic postural stability, shorter contact times, longer flights times, and higher step frequencies, than the slower runners
b) How do speed and COM acceleration-derived variables change throughout a long distance run in the different performance speed groups of runners? We hypothesised that a decrease in dynamic postural stability, an increase in peak impact acceleration, and a decrease in step and stride regularity would be seen within the groups, with the slower
runners exhibiting a greater number of fatigue-related
changes throughout the run.
Methods
Participants
Ninety-two recreational and competitive runners (57
male; 35 female) were recruited. Participants were eligible for inclusion if they were aged 18 to 65 years, ran at least 30km per week, had been regularly running for at least one year, and
were free of any injuries at the time of data collection. Exclusion criteria included any neurological deficits, any known lower
limb deformities (e.g. leg length discrepancies), a systemic disease or any medical condition that may affect their running, pregnancy, or skin sensitivity to adhesive sprays or double sided tape. Participants provided written informed consent before participating in the study. The study was approved by the James
Experimental Protocol
The long distance run consisted of 20 laps (8km) of outdoor 400m all-weather athletics. This distance was chosen as it was
a distance that runners with the weekly volume required for
inclusion criteria would be familiar with. Participants were asked to perform the run at a self-selected time-trial pace to ensure best performance was realised. Self-selected pace was chosen as individualised test speeds are important when runners differ
in skill level and running speed [19,23]. Participants wore their
own clothing and shoes and undertook their own warm-up prior
to the run. A stopwatch was used to record the participant’s finishing time. The participant’s time was also taken when they passed the 70m line on the home straight of the running
track for each lap. This was to ensure that the acceleration data was analysed at the same point during each lap and when participants were running on the straight, as running movement
changes when running the curves of the track [25].
Data Collection
A wireless tri-axial accelerometer (52mm x 30mm x 13mm,
mass 23g; resolution 16-bit, full-scale range ±16g, sampling at 250Hz; SABEL Labs, Brisbane, Australia) was used to collect COM acceleration data which was wirelessly transferred to a computer for analysis. Prior to data collection, calibration was performed for each accelerometer as per the instruction manual. Participants stood while the accelerometer was positioned on
the lower back at the L5/S1 vertebrae and attached using quick
drying adherent spray and double sided adhesive foam tape.
This position corresponded closely to the runner’s COM and was unobtrusive [14,22]. A moisture wicking fabric was placed
around the accelerometer and secured with an elastic bandage.
Group Allocation
Currently there is no general consensus of how to divide runners into groups of different abilities, i.e. what constitutes a higher skilled runner and what constitutes a lower skilled runner. Previous studies have used recent 10km time to divide
runners in their respective groups [2,26], however the times
used differed between studies. Others studies have grouped participants based on their skill level and running speed during
the running test [7], or finishing run time [24]. Similar to [24]
runners in this current study were grouped based on their
[image:3.595.303.556.146.243.2]finishing run time to best represent the runner’s current form
(Table 1).
Participant characteristics are presented in Table 2. Analysis
revealed the elite and fast groups were both significantly younger
than the intermediate group (p=0.013 and p=0.004), and the
intermediate group were significantly taller than the slow group
(p=0.023) (see statistical analysis for description of analysis). These factors were considered as potential confounders. Additionally, gender was considered as a potential confounder as there was a large difference in the number of females between
the groups, especially between the elite and slow runners (Table 1), and differences in kinematics between male and females
[image:3.595.304.556.274.544.2]during running have been reported [27] (Table 2).
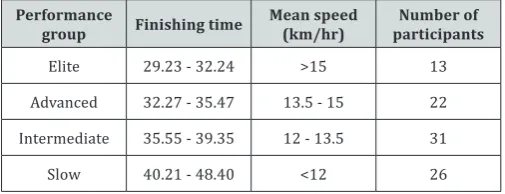
Table 1: Performance group, finishing time, mean speed and number
of participants in each group.
Performance
group Finishing time Mean speed (km/hr) participantsNumber of
Elite 29.23 - 32.24 >15 13
Advanced 32.27 - 35.47 13.5 - 15 22
Intermediate 35.55 - 39.35 12 - 13.5 31
Slow 40.21 - 48.40 <12 26
Table 2: Participant characteristics of elite, advanced, intermediate and slow groups, Mean (SD).
Elite
(n=13) Advanced (n=22) Intermediate (n=31) (n=26)Slow
Male 11 14 23 9
Female 2 8 8 17
Age
(years) (10.08)35.23 (10.10)35.86 47.35 (11.77) (13.12)42.19 Height (m) 1.75 (0.09) 1.74 (0.10) 1.75 (0.07) 1.68 (0.09)
Mass (kg) (9.08)68.15 (12.77)67.68 70.42 (8.22) (13.49)67.15
Years
Running (8.72)11.00 (12.87)14.80 18.32 (13.16) (11.89)15.75 Weekly
distance (km)
58.85
(20.33) (66.66)60.27 51.89 (32.70) (10.82)39.25
Runs per
week 4.69 (1.30) 4.66 (1.51) 4.82 (1.99) 4.06 (0.74) Finishing
time (min) (1.19)31.02 (0.98)33.78 37.52 (1.16) (2.36)43.23 Mean
speed (km/hr)
15.44
(0.50) (0.40)14.08 12.71 (0.40) (0.61)11.05
Data Analysis
Analysis of acceleration data was performed using a custom written program in MATLAB R2014a (The Mathworks Inc.,
Natick, MA). All data analysed was filtered using a zero-lag 4th order low-pass Butterworth filter with a cut-off frequency
of 25Hz, determined to be optimal following a residual analysis. Acceleration-derived variables were computed from
10 seconds of data collected at the 70m point on the home straight and analysed at laps two (730m), six (2330m), 10 (3930m), 14 (5530m), and 18 (7130m). These were equivalent to approximately 10%, 30%, 50%, 70% and 90% of the run.
In order to get time points for data analysis, participants were
asked to stand still for five seconds prior to start of the run to ensure there was a period where there was only the influence of
anteroposterior and mediolateral directions. The samples point in acceleration data for the start of the run was the determined by a change into positive vertical acceleration data as the participants pushed-off to start the run. Analysis of acceleration for each time point was determined by converting time in seconds into the sample rates of accelerometer (250Hz) and then calculating these points from the sample start point of the run. The acceleration-derived variables were averaged for each participant at each time point.
Outcome Measures
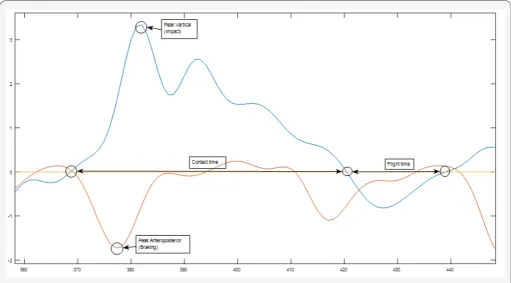
Spatiotemporal variables calculated were contact time,
flight time and step frequency. Contact time and flight time were
calculated from vertical acceleration data (Figure 1). Contact time was obtained based on the premise that as long as the
body’s acceleration is greater than zero, the body is accelerating
upward and the foot should still be in contact with the ground
[28,23]. Flight time was thus calculated when the acceleration value of vertical acceleration fell below zero [28]. Step frequency
is typically reported as the number of steps a runner takes per minute. This was computed from the vertical acceleration data
using samples of the dominant period of the autocorrelation’s peak and sampling frequency of the accelerometer [15].
Dynamic loading measures during stance were determined using peak positive vertical and peak negative anteroposterior accelerations (Figure 1). Peak vertical corresponds to deceleration during the landing or impact phase of the gait cycle, and peak anteroposterior corresponds to deceleration during
the braking phase of the gait cycle [22]. A higher absolute value
[image:4.595.42.554.275.558.2]indicates greater impact or braking accelerations.
Figure 1: Typical acceleration wave form displaying estimation of contact time and flight time calculated in vertical acceleration, and peak vertical (impact) acceleration, and peak anteroposterior (braking) acceleration points. Vertical axis units are Gs, and horizontal axis units
are samples
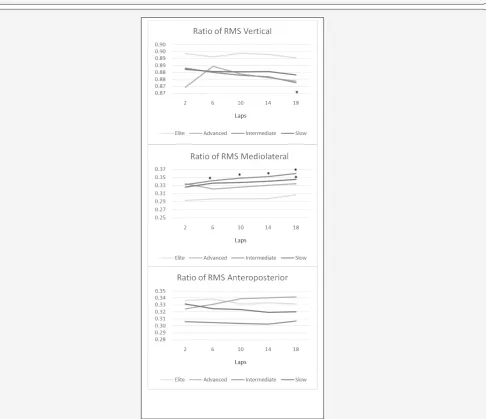
Dynamic postural stability was measured using ratio of root
mean square (RMSR). The RMSR represents the ratio between
RMS in each acceleration direction normalised by the magnitude
of RMS in all directions [29]. This measurement has been used
previously to measure gait abnormality and dynamic postural stability when participants walk or run at a self-selected pace
[23,29]. The RMSR was calculated using the following equation:
RMSx RMSx RMST
=
/
Where x represents the acceleration direction and RMST is the magnitude of RMS in all directions [29]. A higher RMSR value
indicates a greater proportion of acceleration in that direction to overall movement.
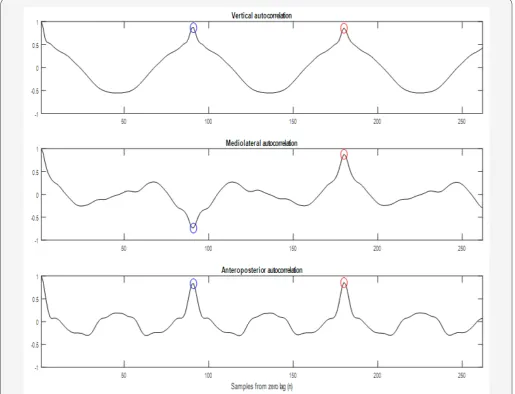
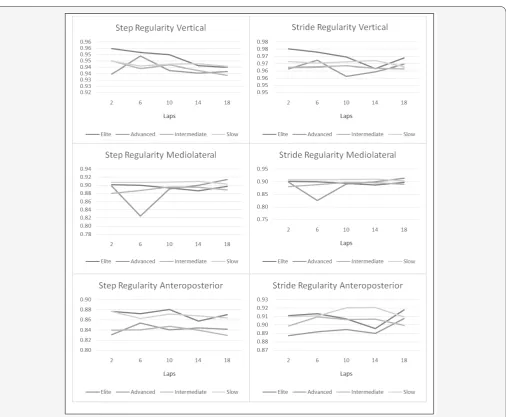
Variability was measured using step and stride regularity
calculated in each acceleration axis using unbiased autocorrelation procedures [21] (Figure 2). Step regularity
represents the regularity between consecutive steps, and can be considered as an indication of symmetry, and stride regularity
represents regularity between consecutive strides [15]. A lower
Figure 2: Unbiased autocorrelation patterns of vertical, mediolateral and anteroposterior acceleration signals of a participant running. The
first circle represents step regularity or symmetry (first dominant autocorrelation peak), and the second circle represents stride regularity
(second dominant autocorrelation).
Statistical Analysis
Statistical analysis was performed using IBM SPSS Statistical software, Version 22 (SPSS Inc, Chicago, IL, USA). Comparison of participant characteristics was performed using one-way analysis of variance (ANOVA). Post-hoc tests were performed using the
Bonferroni adjustment. Levene’s statistic for homogeneity of variances was used, and if the F-Test was significant, the Welch test of unequal variances t-test was performed, and post-hoc tests were Games-Howell.
To answer the first question, one-way analysis of covariance
tests (ANCOVA), with age, height and gender controlled as potential confounders, were used to compare acceleration-derived variables between groups at the initial measurement of lap two when the runners would be in the least fatigued state.
To answer the second question, a repeated measures analysis of
variance (ANOVA) was performed comparing each measurement
to the initial measurement at lap two for each group. Sphericity
was verified by the Mauchly’s test for Sphericity. If the assumption of sphericity was violated, significance of the F-ratios was adjusted to the Greenhouse-Geisser procedure. Post-hoc tests
were performed using Bonferroni adjustment. Effect size was
computed for differences between groups. According to Cohen’s classification, 0.2 represents a small effect size, 0.5 represents
a medium effect size, and 0.8 represents a large effect size 26.
The level of significance for all tests was set at α = 0.05. Only significant findings after adjustment have been reported in this
paper.
Results
Differences in acceleration-derived variables between
groups at lap two
Related to the first research question, there were significant
p=0.001, Effect size = 0.174) and step frequency, (F(3,85)=4.675,
p=0.005, Effect size=0.142) (Table 2). Post hoc comparisons
revealed that the elite and advanced groups exhibited shorter
contact times (p=0.012 and p=0.001), and a higher step
frequency (p=0.027 and p=0.030) compared to the slow group
(Table 3)
Changes in speed and acceleration-derived variables
throughout the run for each group
Speed and acceleration-derived variables for each time point throughout the run for each group are presented in Figures
(3-6). Analysis compared each subsequent measurement point to
[image:6.595.44.556.188.728.2]the initial measurement at lap two Figures (3-6).
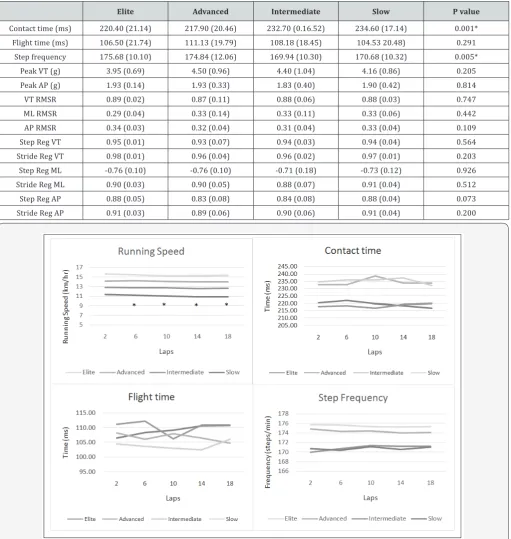
Table 3:Comparison of acceleration-derived variables between elite, advanced, intermediate and slow groups at lap two with age, height and gender as covariates, Mean (SD).
Elite Advanced Intermediate Slow P value
Contact time (ms) 220.40 (21.14) 217.90 (20.46) 232.70 (0.16.52) 234.60 (17.14) 0.001* Flight time (ms) 106.50 (21.74) 111.13 (19.79) 108.18 (18.45) 104.53 20.48) 0.291
Step frequency 175.68 (10.10) 174.84 (12.06) 169.94 (10.30) 170.68 (10.32) 0.005*
Peak VT (g) 3.95 (0.69) 4.50 (0.96) 4.40 (1.04) 4.16 (0.86) 0.205
Peak AP (g) 1.93 (0.14) 1.93 (0.33) 1.83 (0.40) 1.90 (0.42) 0.814
VT RMSR 0.89 (0.02) 0.87 (0.11) 0.88 (0.06) 0.88 (0.03) 0.747
ML RMSR 0.29 (0.04) 0.33 (0.14) 0.33 (0.11) 0.33 (0.06) 0.442
AP RMSR 0.34 (0.03) 0.32 (0.04) 0.31 (0.04) 0.33 (0.04) 0.109
Step Reg VT 0.95 (0.01) 0.93 (0.07) 0.94 (0.03) 0.94 (0.04) 0.564
Stride Reg VT 0.98 (0.01) 0.96 (0.04) 0.96 (0.02) 0.97 (0.01) 0.203
Step Reg ML -0.76 (0.10) -0.76 (0.10) -0.71 (0.18) -0.73 (0.12) 0.926
Stride Reg ML 0.90 (0.03) 0.90 (0.05) 0.88 (0.07) 0.91 (0.04) 0.512
Step Reg AP 0.88 (0.05) 0.83 (0.08) 0.84 (0.08) 0.88 (0.04) 0.073
Stride Reg AP 0.91 (0.03) 0.89 (0.06) 0.90 (0.06) 0.91 (0.04) 0.200
[image:6.595.44.555.191.730.2]
Figure 3: Running speed, contact time, flight time and step frequency for the elite, advanced, intermediate and slow groups at laps 2, 6, 10, 14 and 18 during the 8 km (20 laps) run). * P<0.05, significantly different from initial.
Figure 4: Peak impact (vertical acceleration), peak braking (anteroposterior acceleration) for the elite, advanced, intermediate and slow groups at laps 2, 6, 10, 14 and 18 during the 8 km (20 laps) run). * P<0.05, significantly different from initial measurement at lap 2.
[image:7.595.64.551.297.716.2]Figure 6: Step and stride regularity in vertical, mediolateral and anteroposterior accelerations for the elite, advanced, intermediate slow
groups at laps 2, 6, 10, 14 and 18 during the 8 km (20 laps) run. *P<0.05, significantly different from initial measurement at lap 2.
Related to the second question, the intermediate and slow groups were the only groups that exhibited significant changes
throughout the run. The elite and advanced groups demonstrated
no significant differences in any acceleration-derived variables or speed between subsequent laps and the initial measurement
(p<0.05).
The intermediate group demonstrated a significant increase
in mediolateral RMSR at laps 6 (p=0.02), 10 (p=0.004), 14
(p=0.001), and 18 (p=0.001), and a significant decrease in
vertical RMSR at lap 18 (p=0.005), compared to lap two.
The slow group demonstrated a significant decrease in speed at laps 6 (p=0.034), 10 (p=0.003), 14 (p=0.007), and 18
(p=0.018), compared to lap two, with the greatest decrease
in speed observed at lap 14. A significant decrease in peak
anteroposterior braking accelerations (p=0.0048), and anteroposterior RMSR (p=0.021) were observed at lap 14,
compared to lap two. Mediolateral RMSR significantly increased
at lap 18 (p=0.036), compared to lap 2.
Discussion
This study used COM acceleration-derived measures
collected in a “real-world” environment, to examine differences
in running movement between groups of runners of different skill levels and performance speeds during a long distance over ground run, and investigate fatigue-related changes in
each group. The first finding of this study was that significant differences in contact time and step frequency was observed
a) Differences in Acceleration-Derived Variables between Groups
In support of our hypothesis, the faster runners (elite and
advanced groups) exhibited shorter contact times and higher step frequencies compared to the slow group. These findings are
not surprising as it is well known that greater speeds are related
to increases in step frequency and a decrease in contact time [30]. As step frequency increases with increases in speed, contact time and flight time decrease [30]. In this current study, greater speeds with higher step frequencies were observed with only a significant decrease in contact time. This suggests that contact time had greater influence on step frequency than flight time.
Previous studies have also reported shorter contact times in better performing and more economical runners during running
[2,30]. Shorter contact times indicate a neuromuscular system
that has the capability to tolerate impact forces, store and utilise
elastic energy and generate force rapidly for propulsion [31,26]. Higher step frequencies have been reported to be related more to speed [32,19], than better running economy [1,30]. Similar to this current study, Ruiter et al. [19] found that when runners
are able to self-select their pace, higher skilled runners ran with
higher step frequencies and shorter contact times than lower
skilled runners which was related to faster speeds. While the results of this current study are in-line with previous work, the
collection of data in this current study in a “real-world” and over
ground environment with runners running at a self-selected pace, gives a true representation of running movement. The
shorter contact times and higher step frequencies exhibited
by faster runners appear to play an important role in distance
running performance and is a demonstration of efficient running
movement patterns. Therefore, runners should aim for shorter
contact times and higher step frequencies which may enhance
performance.
b) Changes In Speed And Acceleration-Derived Variables Throughout The Run For Each Group
Related to question two and in support of our hypothesis, the slower runners (intermediate and slow groups) exhibited
numerous changes throughout the run, while the faster runners
exhibited no changes. Interestingly, the intermediate and slow group exhibited quite different fatigue-related changes. The most
notable change demonstrated by the intermediate group was an increase in mediolateral RMSR throughout the run, whereas a decrease in speed was the most evident change demonstrated by the slow group.
The intermediate group exhibited an increase in mediolateral
RMSR during the run which indicates a decrease in dynamic postural stability and an increase in trunk postural sway in
the mediolateral direction [12]. Running primarily occurs in
the sagittal plane so an increase in postural movement in the mediolateral direction suggests a loss of coordination in the
frontal plane with subsequent increase in energy expenditure that does not contribute to the forward propulsion [11]. These
changes were present from lap six of the run and continued
throughout, indicating the intermediate runners were running with these fatigue-related changes for the majority of the run. The decrease in postural dynamic stability in the mediolateral
direction may be caused by insufficient trunk strength and endurance [12]. Implementing trunk endurance strengthening exercises in runners with similar running speeds to that of the
intermediate group may help to reduce the effects of fatigue and improve performance.
The intermediate group also exhibited a significant decrease
in vertical RMSR at lap 18, the point where mediolateral RMSR was at its highest (Figure 3). Forward motion is mainly caused by vertical and anteroposterior movements in the sagittal plane
[9], and less movement in the mediolateral direction [29]. This may explain why vertical acceleration contributed less to
overall movement, as this was at the point when mediolateral acceleration was at its greatest and contributed more too overall
movement with fatigue. This finding further highlights the increases in mediolateral RMSR acceleration exhibited by the
intermediate group and a need to address this.
The slow group decreased their speed throughout the run; however this did not appear to occur with consistent changes in COM acceleration-derived variables. The greatest decrease in speed occurred at lap 14, which was also accompanied by a
significant decrease in both peak braking and anteroposterior
RMSR. It is likely that the decrease in running speed was due to fatigue and the decreases in anteroposterior COM
acceleration-derived variables were due to the decrease in speed [12]. The slow group also demonstrated a significant increase in
mediolateral RMSR at lap 18. Similar to the intermediate group, this increase is most likely a fatigue-related change in kinematics
towards the end of the run. This group would benefit from
training interventions and pacing strategies, as well as trunk
strength endurance exercises to improve performance.
The differences in changes exhibited between the
intermediate and slow group runners throughout the run are interesting. The decrease in mediolateral dynamic stability throughout the run with no decrease in speed seen in the
intermediate group may indicate these runners sacrificed
dynamic stability to ensure speed was maintained. Whereas,
the slow group appear to sacrifice speed rather than change their running movement throughout the run. It is difficult to
hypothesise why these differences were observed. The faster
runners did not exhibit any significant changes in speed or acceleration-derived variables throughout the run. The efficient running movement pattern exhibited by the faster runners,
compared to the slow group, of shorter contact time and higher
step frequencies, suggests that this running style is effective and efficient and doesn’t alter with fatigue or throughout a run. These findings and previous work suggests that faster runners display a running technique that reduces the energy
performance [19,24]. As the intermediate group did not exhibit this significant difference in running movement compared to the slow group, may indicate a less efficient running style and may
be a reason why fatigue-related changes were observed in this group. The difference observed in the groups indicates that a comprehensive running assessment prior to the implementation
of specific interventions to improve performance is required.
However, it is unknown whether the fatigue-related changes are related to injury risk. For safe advice regarding training
methods, pacing strategies and alterations in running technique,
more understanding of whether these changes may be related to
injury is required.
Variability measures of step and stride regularity did not demonstrate any between group differences or fatigue-related changes. Previous studies have reported fatigue-related changes
in regularity during shorter constant paced exhaustive runs [11,15]. The findings of this current study suggest that healthy
runners performing a long distance (eight km) run at a
self-selected pace run exhibited similar step and stride regularity
which was maintained throughout the run. Thus, when using a similar protocol to investigate running movement and performance, measuring step or stride regularity may not to be needed.
Implications
An unobtrusive wireless tri-axial accelerometer with the
capability to continuously measure COM accelerations during an outdoor, long distance over ground run was able to detect movement differences and fatigue-related changes in runners of different skill levels and different performance speeds. Speed and acceleration-derived variables of dynamic stability, dynamic loading and spatiotemporal measures were able to detect differences between groups and fatigue-related changes within groups. It is recommended that these are the variables of interest when investigating running performance using
wireless accelerometers during a long distance run. The findings
of this study suggest that runners should aim for shorter
contact times and higher step frequencies to help improve
running performance. Runners comparable to the speed of
the intermediate and slow groups would benefit from trunk endurance exercises to help control fatigue-related changes in
mediolateral dynamic stability. In addition, slow group runners
would also benefit from training interventions and pacing
strategies to minimise a decrease in speed during a long distance run. It is recommended that future research investigate whether
the fatigue-related changes exhibited by the slower runners
(intermediate and slow groups) are related to injury risk for safe
implementation of training, pacing and exercise interventions.
Limitations
The first limitation is that participants were asked to run
at a time-trial pace, however no measurements were taken to
ensure that fatigue occurred. The non-invasive Borg’s Ratings
of Perceived Exertion could be utilised before and after the run which is a practical and valid tool for monitoring exercise intensity [33]. Another limitation of this study is the close finishing run times that occurred between some runners in
different groups (Table 2). This may have affected the results and needs to be taken into consideration when interpreting the
findings of this study. Previous studies investigating runners
of different skill levels have used groups of runners with large differences in skill range and speeds, e.g. comparing novice and
experience runners [19,2].
Conclusion
This study found that faster runners demonstrated shorter
contact times and higher step frequencies compared to the slow group runners. The running movement exhibited by the faster
runners was related to faster speeds and demonstrates a more
efficient running technique for enhanced performance and
reduced the impact of fatigue-related changes throughout the
run. The intermediate group runners exhibited fatigue-related
changes with the main change being a decrease in dynamic postural stability in mediolateral acceleration throughout the run. The slow group demonstrated few changes in acceleration-derived measures; however fatigue caused a decrease in speed
during the run. For a more efficient running movement, aiming for shorter contact times and higher step frequencies may
enhance performance. Intermediate and slow group runners
may benefit from trunk endurance strengthening exercises, and slow group runners would also benefit from training
interventions and pacing strategies to improve performance and reduce impact of fatigue.
References
1. Kryolainen H, Belli A, Komi PV (2001) Biomechanical factors affecting
running economy. Med Sci Sports Exerc 33(8): 1330-1337.
2. Santos Concejero J, Granados C, Irazusta J, Bidaurraazaga Letona I, Zabala Lili T, et al. (2014) Influence of the biomechanical variables of
the gait cycle in running economy. Int J Sport Sci 36: 95-108.
3. Saunders PU, Pyne DB, Telford RD, Hawley JA (2004) Factors affecting
running economy in trained distance runners. Sports Medicine 34(7):
465-485.
4. Dierks TA, Manal KT, Hamill J, Davis IS (2008) Proximal and distal influences on hip and knee kinematics in runners with patellofemoral
pain during prolonged run. Journal of Ortho & Sports Phys Therapy 38(8): 448-456.
5. Noehren B, Davis I, Hamill J (2007) Prospective study of the
biomechanical factors associated with iliotibial band syndrome. Clinical Biomechanics 22: 951-956
6. Girard O, Millet GP, Slawinski J, Racinais S, Miscallef JP (2013) Changes
in running mechanics and spring-mass behaviour during a 5km time trial. Int J Sports Med 34(9): 832-840.
7. Strohrmann C, Harms H, Kappeler Setz C, Troster G (2012) Monitoring
kinematic changes with fatigue in running using body-worn sensors. IEE Trans Inf Tech Biomed 16: 983-990.
9. Novachek T (1998) The biomechanics of running. Gait and Posture 7 (1): 77-95.
10. Preece S, Mason D, Bramah C (2016) The coordinated movement of the spine and pelvis in running. Human Movement Sci 25: 110-118. 11. Le Bris R, Billat V, Auvinet B, Chaleil D, Hamard L, et al. (2006) Effect of
fatigue on stride pattern continuously measured by an accelerometric
gait recorder. J Sports Med Phys Fitness 46(2): 227-231.
12. Lin SP, Sung WH, Kuo FC, Kuo T, Chen JJ (2014) Impact of centre-of-mass acceleration on the performance of ultramarathon runners. J Human Kinetics 44: 41-52.
13. McGregor S, Busa M, Yaggie J, Bollt E (2009) High resolution MEMS
accelerometers to estimate VO2 and compare running mechanics between highly trained inter-collegiate and untrained runners. PLOS
One 4(10): 7355.
14. Winter S, Lee J, Leadbetter R, Gordon S (2015) Validation of a single
inertial sensor for measuring running kinematics overground during a prolonged run. Fitness Rez 5: 14-23.
15. Schutte K, Maas E, Exadakytypos V, Berckmans D, Venter R, et al. (2015) Wireless tri-axial accelerometry detetchs deviations in dynamic centre
of mass motion due to running-induced fatigue. PLOS One 10(10):
0141957.
16. Taunton JE, Ryan MB, Clement DB, McKenzie DC, Lloyd Smith DR, et al. (2003) A prospective study of running injuries: The Vancouver sun run
“in training” clinics. Brit J Sports Med 37: 239-244.
17. Riley PO, Dicharry JAY, Franz J, Croce UD, Wilder RP, et al. (2008) A kinematic and kinetic comparison of overground and treadmill
running. Med Sci Sports Exerc 40(6): 1093-1100.
18. Sinclair J, Richards J, Taylor P, Edmundson C, Brooks D, et al. (2013) Three-dimensional comparison of treadmill and overground running.
Sports Biomech 12(3): 272-282.
19. Ruiter C, Verdijk P, Werker W, Zuidema M, De Haan A (2014) Stride
frequency in relation to oxygen consumption in experienced and
novice runners. European Journal of Sport Science 14(3): 2541-2258. 20. Bailey J, Mata T, Mercer J (2017) Is the relationship between stride
length, frequency, and velocity influenced by running on a treadmill or overground? Int Journal of Exerc Sci 10(7): 1067-1075.
21. Moe Nilssen R, Helbostad J (2004) Estimation of gait cycle
characteristics by trunk accelerometry. J Biomech 37(1): 121-126.
22. Bigelow E, Elvin A, Arnoczky S (2013) Peak impact accelerations during track and treadmill running. J Appl Biomech 29(5): 639-644. 23. Schutte K, Aeles J, Op De Beeck T, van der Zwaard B, Venter R, et al.
(2016) Surface effects on dynamic stability and loading during outdoor
running using wireless accelerometry. Gait and Posture 48: 220-225.
24. Paavolainen L, Nummela A, Ruskp H, Hakkinen K (1999) Neuromuscular characteristics and fatigue during 10km running. Int J Sports Med 20(8): 516-521.
25. Alt T, Heinrich K, Funken J, Potthast W (2015) Lower extremity
kinematics of athletics curve sprinting. J Sports Sci 33: 552-560. 26. Siler WL, Martin PE (1991) Changes in running pattern during a
treadmill run to volitional exhaustion: Fast versus slower runners. Int J Sports Biomech 7: 12-28.
27. Willson JD, Petrowitz I, Butler RJ, Kernozek TW (2012) Male and
female gluteal muscle activity and lower extremity kinematics during running. Clin Biomech 27(10): 1052-1057.
28. Gaudino P, Gaudino C, Alberti G, Minetti AE (2013) Biomechanics and
predicted energetics of sprinting on sand: Hints for soccer training. J
Sci Med Sport 16(3): 271-275.
29. Sekine M, Tamura T, Yoshida M, Suda Y, Kimura Y, et al. (2013) A gait
abnormality measure based on root mean square of trunk acceleration. J Neuroeng Rehab 10: 1-7.
30. Nummela A, Keranen T, Mikkelsson L (2007) Factors related to top
running speed and economy. Int J Sports Med 28: 655-661.
31. Nicol C, Komi PV, Marconnet P (1991) Fatigue effects of marathon running on neuromuscular performance. I. Change in muscle force and stiffness characteristics. Scan Journal of Med & Science in Sports 1:
10-17.
32. Kryolainen H, Komi PV, Belli A (1999) Changes in muscle activity patterns and kinetics with increasing running speed. Journal of Strength & Cond Res 13(4): 400-406.
33. Scherr J, Wolfrath B, Christie J, Pressler A, Wagenpfiel S, et al. (2013) Associations between Borg’s rating of perceived exertion and physiological measures of exercise intensity.European Journal of Appl. Phys 113(1): 147-155.
Your next submission with Juniper Publishers will reach you the below assets
• Quality Editorial service • Swift Peer Review • Reprints availability • E-prints Service
• Manuscript Podcast for convenient understanding • Global attainment for your research
• Manuscript accessibility in different formats ( Pdf, E-pub, Full Text, Audio)
• Unceasing customer service
Track the below URL for one-step submission
https://juniperpublishers.com/online-submission.php
This work is licensed under Creative Commons Attribution 4.0 License