Report of a feasibility study
f0v~
· ·
·~
on the distribution and use
COMMISSION OF THE EUROPEAN COMMUNITIES
" 1 R
(,.:Jr. I
. environment and quality of life
1978
I. /. I
/Report of a feasibility study
on the distribution and use
of simulated water
sam~ples
for
comparative bacteriological analysis/
by
eJ)
G.l.
BARROW~D.C.
MILLERPublic Health Laboratory, Royal Cornwall Hospital (City), Infirmary Hill, Truro, Cornwall, TR1 2HZ
A.D.
GRAY & G.H. LOWEPublic Health Laboratory, Clytha Square, Newport, Gwent, NPT 2TZ
Environment and Consumer Protection Service Directorate General 'Employment and Social Affairs'
/.7'
EUR 6037
E~
Published by the
COMMISSION OF THE EUROPEAN COMMUNITIES Directorate-General
'Scientific and Technical Information and Information Management' Batiment Jean Monnet
LUXEMBOURG
LEGAL NOTICE
Neither the Commission of the European Communities nor any per son actmg on behalf of the Commission is responsible for the use which might be made of the
following information
A bibliographical slip can
be
found at the end of this volume@ecSC-EEC-EAEC, Brussels-Luxembourg, 1978
Printed in Belgium
-3-CONTENTS
Introduction 5
Material
&
Methods 6Simulated Water Samples 7
Statistical Analysis 8
Results 9
Discussion 1 3
Summary 16
Acknowledgements 16
References 1 7
Appendix A 21
Appendix B 22
Appendix C 25
Appendix D 34
-5-INTRODUCTION
A Technical Seminar commissioned by the Health and Safety Directorate for comparison of some of the media and methods used in member states of the European Economic Community (EEC) for the bacter-iological examination of drinkinl) water vTas held at the Pasteur
Institute at Lyon in
1975
(Vial,1976).
The results obtained were subsequently discussed at a meeting of Technical Experts at Luxembourg where it was agreed that the Seminar had been very useful in permitting exchange of information and ideas as well as in pin-pointing some of the difficulties inherent in comparing different media and methods emp-loyedin different countries. At this meeting, a small group ofexperts was asked to formulate proposals for future work, and these were later discussed. The proposals included the distribution of simulated v1ater samples for bacteriological analysis as currently used for quality control purposes in the Public Health Laboratory Service (PHLS) in Britain for coliform organisms and Escherici® coli
-6-of this method should be carried out among me~ber states during
1976 -
77.
This report describes briefly the nature of the study, the work done and the results obtained. Desnite some limitations,the study confirms that the distribution of simulated \~Tater .sampler
for bacteriological analysis is both feasible and practicable ~ong
countries within the EEC. V-Ie suggest that such comparati 'Te studies
should be continued and later expanded to include the distribution
of other indicator organisms as well as various culture media witt
detailed instructions for their preparation and use. In this way,
considerable harmonization could well be achieved, not only of thP
media and methods used but also of th,:: way in which results are
recorded, interpreted, and reported.
MATERIAL
&
METHODSTHE STUDY
For this feasability study, arrangements were made for thr8e
distributions of specimens each containing ~nown numbers o~ colifor~
organisms during
1976.
The specimens consi0ted of 2tablP. suspen~ionsof concentrated viable bacteria in a modified glutaT~ate ~edium
containing a preservative. These were distributed in bijoux.bottle0
together with detailed instructions for the prepa:r-ation and
exR"1i:n-ation of the simulated water samples on specified dates. All E~C
laboratories \vhich participated in the Technical Seminar at L~.ron:·
were asked to examine these si~ulated sa~ple~ by their nor~~:
rou-:ine media and methods. For cor.1pa:::-ison, a si"!1ilar :number o:£' PELS
laboratories in the United Kine;dom v:ere o.lso asked to cxar:;inP &:J.d
report similarly on the same samples. On eact: occa~::.or:., t!l.e i:::osuin~~
-_,_
the specified dates by both multiple tube and membrane filtration methods after postal distribution and return within the United Kingdom. These formed the basis of the "expected" results. In order to record the information and results, standard forms were devised for use by all laboratories; despite their apparent simplicity, however, it is clear that these forms were not fully understood by some participants, possibly because they normally
record and report their results in a different way. Although customs clearance for these specimens could not be guaranteed, we were
assured by the relevant authorities that the postal arrangements were satisfactory and that, given normal conditions, there should be no undue delays. In addition, arrangements were made to trans-cribe the results for statistical analysis by computer at the Epidemiological Research Laboratory, Colindale. Preliminary and final reports on the results obtained were sent to all participants after each distribution.
SIMULATED WATER SAMPLES
These were prepared and distributed as previously described by Gray and Lowe
(1976)
for laboratory quality control purposes in the United Kingdom. Briefly, varying numbers of selected strains of Esch. coli and of Klebsiella aerogenes were added to lactose• and indicator-free improved formate glutamate medium (Gray1964)
-8-specified were given with each distribution (see Appendix A). Essentially, this consisted of addine the specimen3 to a stated
volume of sterile deionized water so that the prepared samples theoretically should then contain calculated numbers of viable organisms \<lith the
bacteriostatic effect of boric acid diluted ·out. The importance of thoroughly shaking the samples to ensure homogenous distribution of the organisms during all stages of preparation and examination was stressed.
After reconstitution of the simulated v1ater samples by dilution of the bacterial suspensions, all laboratories were asked to examine them by their usual methods - multiple tubes, membrane filtration or both - as though they were normal routine samples of water and to record and express their results in terms of numbers of coliform organisms anq/or Escherichia coli (faecal coliforms) present per
100 ml. on the forms provided (see Appendix B). It was appreciated that because of the many variations in media and techniques used among different EEC countries, direct comparison of results would not be possible at this stage, although some idea of their range would be obtained. It would also yield useful information on the analytical methods as well as the confirmatory tests and incubation times and temperatures used.
STATISTICAL ANALYSIS
All the results received for each distribution were transcribed where possible for analysis by computer. Because the bacterial
-9-and final reports on each distribution were sent to all participants, and these are included in this paper as Appendices C, D, and E.
For each specimen in each distribution, the issuing laboratory kept 2 bottles and posted j other bottles of the concentrated
suspensions of organisms to another laboratory for subsequent return by post. All
5
of these samples were prepared and examined on the specified dates by (1) the multiple tube (MT) method (1 x 50~1j5 x !C'"'1:_; 5 :~ 1 .. 0ml and where necessary 5 x 0.1ml) with minerals
modified glutamate Medium incubated for
48
hours at37°C.
and (2) by the membrane filtration (MF) method with 0.4% enriched teepol broth (Oxoid) using 100ml each respectively for coliform organisms at37°C
with pre-incubation at25°C
for4
hours and for E. coli at44°C
with pre-incubation for6
hours at 30°C (Report 1969). The maximum and minimum numerical values thus obtained for each organism in each sample by either method were regarded as the "expected" results. In practice, individual laboratory values for any sample within a range of twice the maximum and half the minimum values of those "expected" were arbitrarily regarded as "satisfactoryn.With each method (MT and MF), the range, the mean and standard deviation values were determined for the results for each sample from (a) the issuing laboratory (b) all EEC laboratories (c) all PHLS laboratories and (d) both EEC and PHLS laboratories, thus allowing some comparisons to be made. These values are shown in Appendices C, D, and E.
RESULTS
-10-results of each distribution (see Appendix C, D, and E). On each occasion, the samples were sent to a total of 27 EEC laboratories and 21 constituent laboratories of the PHLS in the United Kingdom. Each laboratory was identified by a code number known only to
itself, and to us. In general, the response from participants was very good, although some replies were received too late for inclusion in the analyses of the relevant distributions. In addition, for
various reasons, the actual number of laboratories which did report varied slightly with each distribution.
Distribution of Samples. The concentrated bacterial suspensions for preparation of the simulated water samples were dispensed in bijoux bottles. These were packed in approved cardboard boxes and despatched by "letter" post. Those for EEC laboratories \vere r.1arked "Air Mail11 and "EEC Quality Control Trial - 5ml. \vater Samples for
Analysis - Net Weight 100gm" on Customs/Douane labels. No leakages or breakages occurred during transit and the majority of both EEC and PHLS laboratories received the specimens well before the dates specified for starting the bacteriological analyses. It is therefore evident that, under normal circumstances, the distribution of such samples by post for bacteriological examination is entirely satis-factory.
11
-Nedia. A. shown in Appendices C, D, and E, several media were used.
In General, most PHLS laboratories used the xultiple tube method with
commercial (Oxoid) miner·als modified glutamate medium (PHLS, 1969)
based on Gray's
(1964)
improved formate lactose glutamate medium.A.lthour;h relatively few PHLS laboratorieo used the membrane
:iltration method, all except one employed Oxoid
0.4%
enrichedTeepol broth (Report,
1969).
The majority of F~C laboratories usedboth ~:1ul tiple tube and me:nbrane filtration methods, although it is
not yet known whether these ~ethods are employed together as a
routine. EEC laboratories used either glutamate media, MacConkey
or lactose broth for multiple tube tests; for membrane filtration,
hmvever, TTC Tergitol agar war> the medium most frequently employed.
Laboratory Reports• Although cumulative analysis of the collective
results reported by each laboratory was not possible, considerable
difficulties ':Jere experienced in collating and interpreting many of
the actual reports. Some of these difficulties v1ere technical in
nature, some were due to misunderstanding of the report form, and
~thers arose because the reoults were recorded in such a way that
they could only be interpreted by us with difficulty. They included:
(i) A few laboratories clearly did not follow the instructions
and shake the bottles thoroughly to ensure-homogenous
distribution of the organisms during each stage of
preparation of the samples.
(ii) Variation in the times and temperatures of incubation
-for example some laboratories incubated -for coli-form
0
organisms at 30 C and others gave multiple tube results
for coliform organisms Rfter incubation for only 24 hours
0
-12-(iii) Some laboratories used pre-incubation at lower temper- ·
atures with both the multiple tube and membrane
filtration methods for coliform organisms and Esch. coli.
(iv) Many different volumes of water were examined, ranging
from
3
x 100ml to5
x 1.0m1 for multiple tube tests;in contrast for membrane filtration, some laboratories
calculated results per 100 ml from the examination of
as little as 1.0 ml of the water samples.
(v) Some laboratories used multiple membranes with several
volumes of water and either averaged the results or
gave more than one set of results. One laboratory used
as many as
18
different membranes for each sample.fvi) Some laboratories identified completely the organisms
present, whereas some others did not use any
confirm-atory tests for either multiple tube or membrane
filtration results.
(vii) Some laboratories gave Each. coli results after incubation
of multiple tubes at 3?°C for only 24 hours.
(viii) Some laboratories incubated tubes directly at 44°C for
Each. coli.
(ix) The choice of statistical tables varied with the sets
of tubes and volumes of water used.
and (x) Similarly some laboratories reported inadequate numerical
results for coliform organisms anQ/or Each. coli (e.g. 18+
or 18o+) due to insufficient numbers of tubes used in the
-13-Despite these difficulties, we were able to interpret the
majority of the reports received. The ranges of results "expected"
by t1T and MF methods for each sample in each distribution are shown
in Table 1. The numbers of EZC and PHLS laboratories which obtained
numerical results 1:Ji thin these "expected" ranges are shown in Tables
2 and
3.
These also show the numbers of laboratories outside theselimits but which were arbitrarily regarded as "satisfactory" in
that their results \vere 1:Ii thin ranges from half the minimum to
twice the maximum values of those "expected". In fact, the greater
majority of these results viere V·~ry close to the "expected" values •
.For convenience, the coliform results v1ithin the "expected" and
"calisfactor:r" ranges are shown in Table 2 and those for Esch. coli
(faecal coli) in Table
3.
It should be noted, however, that thisartificial separation of organisms and results is only for clarity.
It is evident that, 1..rhatever the media and techniques used, more
than of all t~e laboratories obtained acceptable
results for all speci~cn~.
:UISCUSSION
Inter-laboratory calibr~tio~ program~es involving the
distri-bution of water sarnples for analy:-~is are \vell e~tablished in the
physico-chemical field, but until recently the difficulties i~herent
i~ i t.s application to :"licrobioloe;y \-Jere thought to be too great for
practicability. Hm.1ever, 9. satisfactory method usinG simulated
,,;ater Gamp1e~ containi '!.f" sta.ble bacteria.l suspensions has recently
been developed by Gra~,' ·.--. <.rt Lm·te ( 1976) for ~icrobiological laboratory
quality cont~ol p~~noPP~.by ~he Public Health LGboratory Service in
tLe United Kin~dom. fJ:'hr:: -;rc!.-::ent fA~sAbility Gtudy was undertaken
.. ~ 4.
samples was suitable for comparat1ve bacteriological analytical wor1:
among member states of the EEC. It i~~ clear from the resul tc· of
the three distributions in this study that it 1~ in fact. batt
feasible and practicable.
In the report on -che first distributior:, ttie importanct- o:
thoroughly shaking thE' sarnpleE> durinc preparA-tion to ensure
homog-enous distribution of the organisms was emphasized. It waE arbitrarily
suggested that failure to find less than 20 coliforr:1 organisvns or E. coli
per 100ml inaay s~leshould be regarded as unsatisfactory; this
applied to 6 of 27 EEC laboratories and 10 of 21 P.HLS laboratories,
though no laboratory failed to detect their presence. The
second distribution showed that small numbers of organisms gave
good and uniform results. The third distribution in vJhich there ~,;ere
similar numbers of one of the organisms in each pair of samples, indicated
that a reasonable degree of reproducibility vm.s achieved -
partir-ularly with the membrane filtration nethod a~ong EEC laborato~ies.
This method lS also suitable not only for ongoinc quality
control work but for prior comparison and evaluatior: of ~iffe~ent
media ann methods before extensive fi~:.!lt.:. trial.:.. .\.l t:hough onl_v
coliform organismt-> and Esch. coli (faecal co~i) ':Jr?~e uses :i "". tr.:i .. ·
.:;tudy, the same approach can easily br PYtend<:>cl to 0they· bac-teria:
indicator organisms and developed to include thE:- distri bu:- ior-. c>:·
prepared dehydrated medic:. to asses::.._; technical perfor~u.ncr..::,
especially with small numbers of o:!"'ganls~.;,-:;. ln..dee~~ :o"· ·;Y';_n'··.l!'~;
water safety, i l t ~no:~ ir::nortant. to llSf\ ""iedia gn.d :1et~1oc~ ·.~~1-~ -;_ ~~ ~
organisms and Esch. coli than nece.csn.rll,'/ f::l v·=-- :·"!'PCJ.te:· :::t ..
Y'lps.r~bl.li-r.~-vli th larger numbers.. For this re2,son, not only are frequent labora. ...
they should be based essentinlly on samples with sr.1all number:~
o.r
or5anis~s. For the same reasons, satisfactory evaluation should
eventually include the UE"le of stressed or damaged organisms in order to shaH up small differences r.1ore quickly and thus aid any
subseqw:._.nt field ,,.mrk. It is ir.1portant to appreciate that in practice the
nature and quality of the water to be examined may affect the choice of the media and methods uced for bacteriological analysis. It seems probable that alternative but comparable cultural methods Hill continue to be needed in different areas for different reasons: a universal best method or medium, although ideal, is unlikely to be achieved in practice in the forseeable future.
Despite some difficulties of interpretation, the results of thic study suggest that, with the simulated water samples distrib-uted the membrane filtration method gave results consistently closer to those expected than the multiple tube method, although Endo
medium tended to give low numbers. Indeed, one laboratory failed to detect Esch. coli or coliform organisms in all three samples in the third distribution by the membrane filtration method with Endo broth. This laboratory, however, obtained the "expected" results in duplicate membrane tests on the same samples using enriched
teepol broth. The study has been useful in revealing some differences in the details of the methods used and the need for greater uniform-ity. It has also shovm the importance of actual numerical results in any future comparative work on media and method evaluation as well as the necessity for all test results to be accurately recor-ded in the same way. We suggest that, in addition to complementary research, exchange visits between laboratories and occasional
-16-quality control purposes should be continued and expanded to aid
harmonization and ultimate standardization, not only of media and
methods, but of the way in \.Jhich bact eriolo.e_:ical results are
recorded, interpreted and reported runong member states of the EEC.
SUMMARY
A feasability study is described in vihicrJ. si:.mlated \-Jater
samples were distributed by post on three separate occasions to a
total of 27 laboratories within the EEC and 21 laboratories in the
PID..S in Britain. Bijoux bottles containing· concentrated suspensions
of viable coliform organisms anq/or Escherichia coli in a modified
glutamate medium containing boric acid as a preservative were
issued with precise instructions for the preparation of the simulrrted
water samples. All laboratories were asked to prepare the samples
on specified dates and then examine them for these organinms by
their normal bacteriological methods as though they were routine
samples of water and report their results on forms provided. The
response was very good and the results of the study indicate that
the distribution of such samp::.es i.:- not only practicable but thet
this quality con~rol approa~h co~ld be 'used for ~ngoing evaluation
of techniques and media performance for coliform a~d other
organ-isms, as vJell as for harmonization of the v.Jay in\vhich resul tc are
recorded, interpreted and reported. This could usefully supple~ent other
work and occasional technical seminars.
ACKNO':!LEDGEHENTS
We are grateful to the Health and Safety Directorate,
Commission of the European Co~munities, Luxembourg, for encouraGement
-17-of the Epidemiological Research Laboratory, Central Public Health Laboratory, Colindale, for statistical analyses; and the staff of the participating laboratories for their cooperation.
R.~ERENCES
Gray, R.D. ( 19GL~). An improved formate lactose glutamate medium fo:-the detection of EGcherichia coli and ofo:-ther coliform organisms in water. J. Hygiene, Ca~bridge, 62,
495.
Gray, R.D. & LO\ve, G.H. ( 1976). The :9reparation of simulated water samples for the purpose of bacteriological quality control. J. Hygiene9
Cal'!lbridge, 76, lt9.
Public Health Laboratory Service
{1969).
A Minerals modifiedGlutamate medium for the enumeration of coliform organisms in watero Report by the Standing Co~mittee on the Bacteriological Examination of \~ater Supplies. J. E~r."'iPnn, G?.I!D::."irl(""', G7, 367.
Report
(1969).
The Bacteriological Examination of Water Supplies.Reports on Public Health and Hedical Subjects, No. 71, London, H.M.S.O.
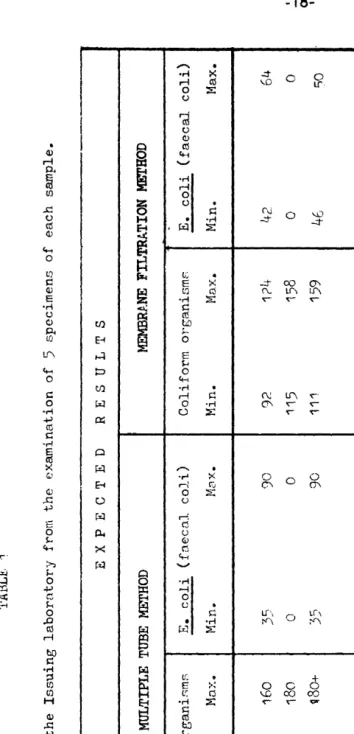
TABLE 1 Range of "E>..-pected" results obtained by the Issuing laboratory from the examination of 5 specimens of each sample. EXPECTED RES U L T S MULTIPLE TUBE METHOD MEMBRANE FTI..TRATION METHOD Distribution Sample No. (Bottlr) Coliform organisms E. coli (fnecnl coli) Coliform organiGmP-E. coli (faecal Min. Mnx. Min. Mox. Min. Max. Min. 1
..
5C 160 35 90 92 1 ?L+-42 I February ... 90 180 0 0 115 158 0 ,: 1976 3 90 ~80+ 35 90 111 159 46 2 195 1700 5500 1700 5500 1850 2500 1850 April/May 196 35 160 8 35 )l+-64 21976 3
(A) 231 3 13 3 13 8 14 3 December (B) 232 17 35 8 17 11 22 5 1976 (C) 233 13 ~r·· 8. 25 1c:. 25 "'Z, <-) j / "'
coli) Max.
64 0
so
2500 8 7 13 14
I _..
[image:20.883.143.497.80.813.2]TABLE 2 Nur1ber of laboratories recording resul tr; for coli forn ort~Hnisr>J::: ,.Ji thj n thP 11 expected" a!ld ";sA. t j .cf.qctory" range SAMPLE NUfJIBER 0 F LA R 0 R A T 0 R I E S Distribution (BOTI'LE) LABORATORIES MULTIPLl.: TUBE; HE"l:'HOD M~~RANE FILTRATION ~THOD No. E* ~
o•
'rt E* S* 0* E E C 11 4 2 9 ~ 17 10 1 1 PH L S 10 7 ') ?0 5 3 0 -! ' February E E C 6 8 3 17 6 11~ 0 2 1976 PH L S 9 11 0 2G ~ 3 0 E E C 11 5 1 17 14 6 0 3 PH L S 16 2 2 20 4 4 0 195 E E C ~ 4 6 18 7 10 4 2.
PH L S 12 4 4 20 1 2 2 April/May 1976 196 E E C 12 2 3 17 15 4 1 PH L S 19 1 ·o 20 l~ 1 0 (A) E E C 14' 3 0 17 10 7 2 231 PH L S 16 0 0 16 5 1 0 3 December (B) E E C 6 6 5 17 14 3 2 232 PH L S 11 4 1 16 4 2 0 1976 (C) E E C 7 7 3 17 12 5 2 233 PH L S 8 8 0 16 2 3 1 E* "Expected'. resultss•
Satisfactory resultso•
Other results T* TotalT* 20 8 20 8 20 8 21 5 20 5 19 6 19 6 19 6
TABLE 3 Number of laboratories recordin~ results for Esch. coli (faecal coli) within the "expected" and "~>ntisfactory" range NUMBER 0 F L A B 0 R A T 0 R I E S SAMPLE Distribution (BOTrLE) LABORATORIES MULTIPL~ TUBE METHOD HEHBRAN.t!.: FILTRATION l1EirHOD No. E*
s•
o•
'l* E* S* O* 'l* -1 E E C 7 8 2 17 10 9 1 20 PH L S 12 z 5 20 5 j 0 8 ~ i 16 E ~ C 0 1 17 19 0 1 20 Februar-y ') PH L S .20 0 !) 20 8 0 0 8 19?f 3 E E C 11 3 3 17 6 12 2 20 PH L S 1? 3 5 20 j 3 2 8 2 E E C 7 _5 8 18 7 ~ 6 21 195 April/May P II L S 11 l~ 5 ~c 1 2 2 5 1976 196 E E C ~ 5 l+ 17 R 5 7 20 j PH L S 15 "1 4 20 .5 1 1 5 (A) E E C 14 1 ,.-17 11 7 1 19 .. 231 P H L S 13 "Z 0 1f) ll-1 1 G •·. \ (B) B E C h r; 14 December 7 1'7 5 0 \ 19 197t 232 PH L S 12 .. 2 1() It 2 0 6 (C) E E C 12 2 3 17 15 3 1 19 ?33 PH L S 1~ 1 1 1(,'+
1 1 6 E* "Expected 11 resulte S* "Satisfactory re::;ult::-: I
-21-APPENDIX A.
Exa~ple of instructions for the preparation and examination of the simulated water snmples.
PUBLIC HEALTH LABORATORY SERVICE WATER COMMITTEE
E.E.C. WATER QUALITY CONTROL TRillL (3) -DECEMBER 1976.
NOTES , 'ROM PUBLIC HEALT/1 LABORATORY 1 NEWPORT
Three samples are ~nclosed. They are numbered 231 A, 232 Band 233
c.
They should all be ·egarded as rural unclllorinated water.INSTRUCTIONS
The bottles should :e stored UNOPENED at room temperature in the dark and examined on December 7 for the numbers of coliform organisms and Escherichia coli (faecal coli) ONLY. If received after this date, they sho,uld be examined immediately.
PREPARATION OF SAMPLES
It is important that the instructions given are followed precisely. Prepare EACfi SAMPLE SEPARATELY as
follows:-POUR HALF OF THE CONTENTS OF THE SMALL BOTTLE INTO A LARGER STERILE BOTTLE (25-SOml) MARKED WITH THE SAMPLE NUMBER·.
2 THE WATER REMAINING IN THE SMALL BOTTLE SHOULD BE THOROUGHLY MIXED BY SHAKING VIGOROUSLY~ THEN ADO THIS \/ATER TO THE REST OF THE WATER IN THE LARGER BOTTLE. 3 SHAKE .THIS BOTTLE VIGOROUSLY BY HAND FOR AT LEAST TWO
MINUTES TO ENSURE THOROUGH MIX ltJG OF THE WATER AND THEN ADD 3ml ASEPTICALLY TO 400ml OF STERILE DISTILLED OR DEIONISED WATER IN A STERILE BOTTLE. THIS NOW CONSTITUTES THE SIMULATED ~ATER SAMPLE.
4 EACH SIMULATED WATER SAMPLE SHOULD BE SHAKEN THOROUGHLY AND THEN EXAMINED BY YOUR USUAL METHOD (MULTIPLE TUBES, MEMBRANE FILTRATION OR BOTH) \.JITH YOUR USUAL MEDIA.
•
RECORDING OF RESULTS
Forms on wllich to record your results have
already been sent to you by Dr. G.I. Barrow. The coloured forms are maiked 'A', 'B' and
'C'. Please check that the results are
recorded on th~ correct forms.
~---·---·---·----~
You will be informed later of (a) tl1e intended resul.ts and
(b) the actual results obtained in this water quality control trial. Please return forns BY AIW~AIL to:
Dr. G.I. Barrow,
-22-APPENDiX B.
Exar:1ple of Forr~1s for recording laboratory resul b:; and other infor~nntion
Public Health Laboratory Service Water Committee
Issued by:
BOTTLE NO. 231
E.E.C. WATER QUALITY CONTROL TRIAL (3)
Dr. R.D. Gray, Public llcalth I .. c1boratonJ,
Clytha Square, :.'c•:-port, Ct·:cnt ,'.'l''F ?:"'7, ~·.I:.
Issued November 29, 1976.
Rural unchlorinated water
PLEASE RECORD:
Date sample received: Date examination started:
Membrane Filtration Method and Results
F0Rt1
A
LAB. IDENTITY CODE NO.
1. Volume of water fi 1 tered through each membrane: _ _ _ _ No. of membranes
2. Media used:
Incubation
Time Temp
3. Tota 1 co 1 i form organisms _ _ _ per 100 ml. hr
4. Number of Escherichia coli (included in 3)
(faecal coli) per 100 ml
----
hr5. Confirmatory tests used:
---Any comments?_. _________________________________________________ _~ultiple Tube Method and Results
a) Number of tubes/bottles and volumes of water used.
Volume (ml)
No. tubes etc.
b) Media used:
---Host Probable Number (MPN) per 100 ml. of
c) Coliform ·organisms--- per 100 ml.
d) Escherichia coli (faecal coli)
(included in c) per 100 ml.
Incubation
Time Temp.
oc.
_ _ _ hr. _ _ _
_ _ _ hr.
e) Confirmatory tests __________________________________________________ ___
Any convnents?
Please return this form by AIRMAIL as soon as tests are completed to:
fEnter date posted
•
Dr. G.l. Barrow,
Public Health Laboratory, Royal Cornwall Hospital (City),
I n f i rma ry H i 1 1 ,
-23-Publ1c Health Laboratory Service Water Col!lllittee
E.E.C. WATER QUALITY CONTROL TRIAL (3)
FO~B
Issued l•y: Dr. R.D. Gray, Public Health l4iJboratory, Clytha Square, Nel-!port, Gwcnt NPT 2TZ, U.K.
BOTTLE NO. 232 Issued November 29, 1976.
Rural unchlorinated water
PLEASE
RECORD:LAB. IDENTITY CODE ·NO.
Date sample received: Date examination started:
Membrane F i 1 t ra·t ion Method and Resu 1 ts
1. Volume of water filtered through each membrane: ________ No. of membranes 2. Hedla used:
Incubation Time Temp 3. Total col I form organisms ___ per 100 ml. hr
4. Number of Escherichia coli (included in 3)
(faecal coli) per 100 ml _ _ _ hr
---
°C5.
Confirmatory tests used:---Any comments? __________________________________________________ _
~u1ttple Tube Method and Results
a) Number of tubes/bottles and volumes of water used.
Volume (ml) No. tubes etc:.
b) Hedla used:
---Host Probable Number (MPN) per 100 ml. of
c) Co II form ·ot'gan Isms - - - per 100 ml.
d) 8scber1chia coli (faecal coli)
(Included Inc:) per 100 ml.
Incubation Time Temp.
oc.
___ ,hr. _ _ _
___ hr.
e)C~f~~~ry~su _________________________ _
Ally· c011nents?
Please return this form
by
AIRMAIL
as soon asteats are completed to: ---cD:~--•
(later date posted
0 r • G • I • Bar row,
Public Health Laboratory,
Royal Cornwall Hospital (City), lnfl rmary Hl 11,
-24-Public Health Laboratory Service Water Committee
Issued by:
BOTTLE NO. 233
E.E.C. WATER QUALITY COtlTROL TRIAL (3) Dr. R.D. Gray, Public l!ealth Laborator;r, Clytha Square, Nev:port, G~~·cnt r.lPT 2TZ, c..:.K.
Issued November 29, 1976.
Rural unchlorinated water
PLEASE RECORD:
Date sample received: Date examination started:
Membrane Filtration Method and Results
LAB. IDENTITY CODE NO.
l. Volume of water filtered through each membrane: ________ No. of membranes
2. Media used:
Incubation
Time Temp
3. Total coliform organisms _ _ _ per 100 ml. hr
~. Number of Escherichia coli (included in 3)
(faecal coli) per 100 ml _ _ _ hr
5. Confirmatory tests used:
---Any comments? ____________________________________________________ __~ultiple Tube Method and Results
a) Number of tubes/bottles and volumes of water used.
Volume (ml)
No. tubes etc.
b) Media
used=---Most Probable Number (MPN) per 100 ml. of
c) Coli form organisms--- per 100 ml.
d) Escherichia coli (faecal coli)
(included in c) per 100 ml.
Incubation
Time Temp.
oc.
_ _ _ h r .
-___ hr.
e) Confirmatory tests ____ ~---~----~~---~--~--~~---~
Any COITI1lents7
Please return this form
by AIRMAIL as soon as
tests are completed to:
IEnter date posted
•
Dr. G.l. Barrow,
Public Health Laboratory,
Roy a 1 Cornw·a 11 Hosp ita 1 (City} ,
Infirmary Hill,
-25-APPENDIX C.
Preliminary Report - Distribution No. 1.
TRURO
3029
PUBLIC HEAL Tll LABOR.ATOR Y SERVICE
(Headquarters O{(icr: Colindale Avc·nue, London N\~'9 sgQJDear Participant,
PUBLIC HEALTH LABORATORY.
ROYAL CORNWALL HOSPITAL (C'ITY).
1Nf1Rf\1ARY HILL.
TRURO. CORNWALL.
7th Apr i 1 , 1 97ft .
E.E.C. Water Quality Control Trial
The results of the first distribution of simulated samples of water for bacteriological examination are now being analysed and a full report will be sent to you about the end of April. Meanwhile, the following
preliminary information may be of interest:
1. In general, this exercise went smoothly. The postal services
were satisfactory and most E.E.C. laboratories received .the
samples within a few days.
2. Results were received
from
25 of 27 laboratories tn theE.E.C. and from all of 21 laboratories in the U.K.
3.
The results apoear to be reasonably uniform, with onlya few outside the expected limits.
4.
The minimum and maximum results obtained by the issuinglaboratory using both membrane filtration and
MPN
methodswere as follows:
Bottle tlumber 1 2
3
Coliform organisms 50-160 90- >180 90- >180
Escherichia coli
35-90
.I
035-90
( f aeca 1 col i )
-The second set of simulated water samples.compristng two bottles, will
be distributed during the week beginning 26th April, for bacteriological
examination on t\ay
4.
Coliform organisms and/or faecal coli should bepresent in these samples and we would like to know the ACTUAL NUMBERS you
find using your usual techniques and media. Any technical or other
difficulties experienced with the preparation and exami~ation of these
samp 1 es, s hou 1 d be recorded on the f~rms under 11Any Comments 711
Yours sincerely,
f~J·
v\,
~
-26-APPENDIX
c.
lt'1.nal Report - Dir;tribution No. 1
PUBLIC HEALTH LABORATORY SERVICE
fRl'RO
l02Q
(Hrodquartrrs O(fic-r: ]4 Park Crrsttfllt, London, WIN 4DA)
. PUBLIC HEALTH LABORATORY.
ROYAL CORNWALL HOSPITAL (CITY). INFIRMARY HILL.
TRURO, CORNWALL.
E.E.C. WATER QUALITY CONTROL TRIAL REPORT ON DISTRIBUTION N0.1 (FEBRUARY, 1976)
1. LABORATORIES A total of 45 laboratories participated: 21 P.H.L.S. laboratories in the U.K. and 27 other E.E.C. laboratories. Of these,
7
used the membrane filtration method, 17 used the multiple tubes method and 21 used both methods. 2. TIME SPECIMENSIN TRANSIT
3.
DELAY IN STARTING TESTSDa~s to Receiet
2
3
4
7 - 13
14 - 20
Not stated
Da~s late starttns
0
2
3 7+
Not stated
No. of Labor a tortes 16
7
9 4
5
3
No. of Laboratories 38
2
2'
1
2
Delays in transit or in starting the examinations did not affect the results.
4.
MEDIA Hed1a used No. of Laboratories Multiple tubes: HacConkey Broth5 Lactose Broth 7
Purple HacConkey Broth 4 Glutamate media 22
Membrane filtration: Media used No. of Laboratories Endo (agar) 2
Tergitol
4
TTC Tergitol agar 11 HF Endo Medium (broth) 2
•
Membrane enriched Teepol
broth 8 HFC Broth
-1-/2
-27-Although statistically there Is no significant difference, It Is not possible
to evaluate media performance from this distribution because of (a) lack of
detailed information
(b) variations In the v.olumes of samples used for
examination,
(c) Inadequate confirmation of presumptive pos·ttlve reactions,
and (d) differences In the way in which some results were reported.
\ .
5.
SIMULATED WATER SAMPLES
Thes. were prepared by the addition of known
organisms to lactose-free IFLG medium containing boric acid as a preservative
so that after distribution and dilution, the simulated test sample should
con-tain calculated numbers of organisms. Bottles 1 and
3contained a mixture of
selected strains of Escherichia coli and Klebsiella aerogenes; and Bottle 2
contained K. aerogenes only. Five samples of each bottle, including
~stored
and
3
postal, were examined by the Issuing laboratory according to the
instructions issued, and the expected results are based on these findings.
The maximum and minimum results are as follows:
Total no. of
BOTTLE NUMBER
organisms
per1
2 3100 ml.
MPN
MF
MPN
· MFHPN
MF
Co 1 i forms
50-160
92-12lt
90--180115-158
90-180+
111-159
E. coli
( f aeca 1 co 1
t )35-90
42-64
-
-
35-90 Ilt6-50
MPN
=
Multiple Tube Method
KF
=Membrane Filtration
6.
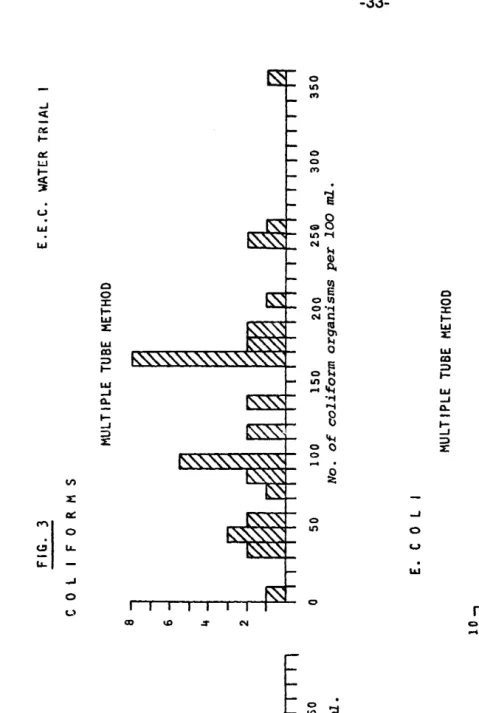
RESULTS
The results reported from all laboratories are shown In Tables 1
and 2 and in Figures 1, 2 and
3.
Findings:
No statistically significant difference was found
elthe~In the
average results or in the spread of results for coliform organisms or E.coll
(faecal coli) between P.H.L.S. and other E.E.C. laboratories for any bottle
(Table 1). The results from all laboratories for each bottle were therefore
pooled for further analysis.
Coliform organisms: No significant differences were found In the average
results or the spread of results obtained by all laboratories compared with
the expected results for any bottle (Table 2). Some laboratories, however,
obtained consistently lower results using membrane filtration with certain
media (notably laboratories 500 and
017).
Escherichia coli (faecal coli)
Bottle 1: No difference was found between the results from all laboratories
and the expected results either on average or In the spread
/3
-28-Bottle 2: This
~ottledid not contain E. coli. One laboratory, however,
reported 1 E.colt
per
100
ml.
using the multiple tube method,
but not
bymembrane filtration.
Bottle
3:
The average results from all laboratories agreed with the
expected results. The membrane filtration method, however,
appearedto have a significantly greater spread (Table 2)
because the
expe~tedresults
were
all
cloi~tugether.
].
CONCLUSIONS
In general, the Tables and Figures Indicate
reasona~le~arability of
results.
On average,the
membranefiltration
rnethodand
the multiple tube method gave similar results although when compared with
the expected results, the membrane filtration method was In all cases
sig-nificantly more accurate.
It
Isarbitrarily suggested that for any bottle,
the finding of less than 20 Collforms or E. coli per 100 ml. should be
regarded as unsatisfactory. This could be due to
(a) medium used
(b) technique, or most probablX {c) Insufficient shaking to ensure
homogenous distribution of organisms at each stage of preparation and
examination of the samples.
This distribution has been useful In revealing a number of areas of
non-uniformity In techniques used and In reporting results, which
wfllbe
taken Into account In planning future dlstrlbutlons.
Public
Health Laboratory,
Royal Cornwall Hospital (City),
I nf
t·rmary Hi 11 ,
Truro TRl 2HZ,
Cornwa 11 , U.K.
27th
Hay'1976
TABLE 1 E.E.C. WATER TRlAL 1
r---·
~---C 0 L I F 0 R M SE.
c
gL
I
i
Method Bottle Laboratories No. of No. eer 100 ml. No. of No. ~er 100 ml.I
reports Mean S.D. Range reports Mean S.D. RangeI
..I
Membrane 1 E.E.C. 21 102.4 25.2 50-170 20 53.5 17.3 29-90 II
P.H.l.S.7
103.6 31.6 59-160 7 4Lt.4 13 .. 1 27-62 I filtration I 2I
E.E.C. 21 110.0 49.2 27-280I
P.H.L.S.7
101 .4 26.6 64-134i
I
' N co I
TABLE 2 E.E.C. WATER TRIAL 1. No. of collforms No • of E • co 1 l No. of ·per 100 ml · per 100
m1
Method Bottle Laboratories result~ Standard Standard Mean deviation Mean deviation Membrane 1 All labs 28t 102.7 26.3 51.1 16.6 Issuing 5 104.8 14.4 55.8 g,g r 11 tration laboratory 2 All labs 28t 107.9 44 .l• 0 -Issuing 5 131.8 16.7 0 -laboratory 3 All labs 28t 120.7 31.7 46.5 19.0 Issuing 5 126.4 19. 1 48.0 1.4 laboratory I(,.) 0 I
8
.
6 Cl) .q IQ ...It
... 0
.
~2 BOTTIF 1 MEMBRANE FILTRATION METHOD 50 150 200 250 No. of coliform organisms per 100 ml
.
~ MEMBRANE FILTRATION METHOD 0 so 100 No. of E.Coli (faecal coli) per lOO ml F~G. 1 F.F.C. WATFR TRJAL 1 C 0 L I F 0 R M S MULTIPLE TUBE METHOD 0 50 100 150 . 200 250 300 350 No. of coliform organisms per 100 ml E. C 0 L I MULTIPLE TUBE METHOD10 8 6 It 2
~~~~~~,_~~~~~~~~~---~
I I~
0 50 100 150 200 250 No. of E.coli (faecal coli) per l:JO mlBO.TTLE
NO.
2
FIG.
2
E.E.C.
WATER
TRIAL
1
C
0
L
I
F
0
R
H
0
R
G
A
N
I
S
M
S
KEMBRANE
FILTRATION
METHOD
MULTIPLE
TUBE
METHOD
8 6 2
50
100
150
200
250
0
so
100
150
200
250
300
No.
of
coliform
organisms
per
100
ml
No.
of
coliform
organisms
per
100
ml
350
I cu
a
.
c2 ~ BOTTLl NO. 3 MEMBRANE FILTRATION METHOD 50 100 150 200 250 No . of coliform organisms per 100 ml • MEMBRANE FILTRATION METHOD
10 8
.
Cl) .q6
ltJ
....
14-f 04
.
~ 20 so 100 No. · of E. coli per 100 ml •
8 6 4 2
FIG. 3 E.E.C. WATER TRIAL 1 C 0 L I F 0 R M S MULTIPLE TUBE METHOD 0 50 100 150 200 250 300 350 No. of coliform organisms per 100 ml. E. C 0 L I MULTIPLE TUBE METHOD 0 50 100 150 200 250 No. of E .coli ·per 100 ml •
[image:35.893.68.547.84.797.2]
-34-APPENDIX D.
Preliminary Report - Distribution No. 2
li<LkO 302\1
PUBLIC HEALTH LABORATORY SERVICE
PURUC HEALfH LABORAlORY.
ROYAL CORT\WALL HOSPITAL. !CI fYl.
I~FIRtv1t\KY HILL TRURO. C<lR~\VALL.
I Rl 2HZ
30th June, 1976
Dear Participant,
E.E.C. Water Quality Control Trial
The results of the second distribution of simulated samples of water for bacteriological examination are now being analysed and a full report will be sent to you in due course. Meanwhile, the following preliminary infor-mation may be of
interest:-1. In general, this exercise a9ain vJent sr..oothly. The postal
services were satisfactory and all but one of the E.E.C. laboratories received the samples within a few days.
2. Results have been received from 24 of 27 laboratories In the
E.E.C; 86 other results have also been received from the Microbiology Quality Control Scheme.
3. The results appear to ~e generally fairly uniform, but a few
were outside the expected limits.
4. The minimum and maximum results obtained ty the issuing
lab-oratory, usinq both membrane filtration and MPN methods, were
as fo 11 ows :.
Organism Bottle No. 195 1 Bottle No. 196 2
Coliform organisms 1,700-5,500 34-160
Escher-ichia co 11 1,700-5,500 2-35
{ f aeca 1 co 1 i
J
The third set of simulated water samples will be distributed later in the year, poss-ibly towards the end of August, but you will be notified of this before the actual distribution.
Yours sincerely,
APPENDIX D
-Final Re-port
~35-D:Etribution No ..
E.E.C. WATER QUALITY CONTROL TRIAL
RE.>r>ORT ON DISTRIBUTION N0.2 (APRIL/NAY 1976)
1« A total of 46 laboratories participated: 21 British laboratories and
25 other E.E.C. laboratories._ One laboratory (504) has however been
omitted from this analysis because the report forms were incomplete
and the results could not be interpreted. Of the /i-5 laboratories, 7
used the membrane filtration method only, 19 used the multiple tube
method only and 19 used both.
2. TIME SPECIMENS IN TRANSIT
(E.E.C. laboratories
only)
J.. DELAY IN
STARTING TESTS
(E.E.C. laboratories only)
Dax:s to Receipt
1
2
.3
4
7 - 13
14 -
20 Not statedDax:s late startin2
0
2
.3
7+ Not stated
No. of Laboratories
2 2 5
6 5
1
.3
No. of Laboratories
18
2 2 .
1'·
1
Delays in transit or in starting the examinations did not appear to affect the results.
4. MEDIA Media used No. of Laboratories
E.E.C. British
Multiple tubes: MacConkey Broth 2 1
Lactose Broth 6 0
Purple MacConkey Broth 5 2
Glutamate media 5 17
Membrane filtration: En do (agar) 2 0
TTC Tergitol agar 15 0
En do (broth) 1 1*
Membrane enriched Teepol 3 4
broth
MFC Broth 0 1*
*same
It is again not possible to evaluate media performance yet because of (a) insufficient information given (b) considerable variations in the actual volumes tested by different laboratories (c) inadequate confirm-ation of presumptive reactions, and (d) difficulty in understanding some
Lab.
of the results and comments given on the forms. However, all the
informa-tion gained will be summarized and reported after the 3rd distribuinforma-tion.
5. SI~IULATED WATER SAMPLES. These were again prepared by the addition of
known organisms to lactose-free Improved Formate Glutamate medium
containing boric acid. Bottle No. 195 contained Escherichia coli only;
and Bottle No. 196 contained a mixture of E. coli and Klebsiella aerogenes.
-36-/2
obtained from the examination of 5 samples of each bottle by the Issuing
laboratory. These were as follows:
Total number per 100 ml
Organism Bottle 195 Bottle 196
MPN J.lF MPN MF
Coliforms 1700 - 5500 1850 - 2500 35 - 160 J4 - 64
E. coli
1700 - 5500 1850 - 2500 8 - 35 2 - 8
~faecal coli)
MPN • Multiple Tube Method MF • Membrane Filtration
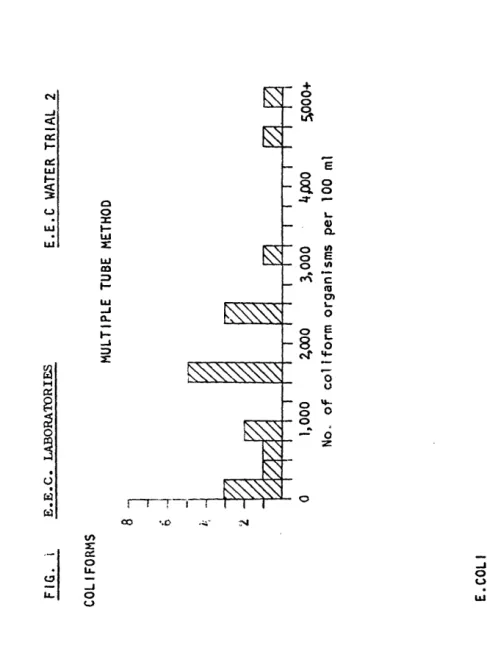
6. RESULTS. Some difficulty was experienced in collating the results from
this distribution, and for the analysis.
(1) where coliform or E. coli counts were given as
>•y•,
the numericalresult has been regarded as tyt.
(2) the results for any sample have been excluded if either the
coliform or E. coli count was not reported.
(3) the results from one laboratory (507) for Bottle 195 have been
excluded because of discrepancies in the report.
(4) one laboratory (525) did not report on Bottle 196.
(5) one laboratory (014) did not give membrane filtration results
for Bottle 195.
Taking these factors into account, the results are shown in Table 1 and
Figures 1 -
3·
Findings:
1. There was no statistically significant difference in the average
results obtained by the E.E.C. laboratories, the British laboratories and the Issuing laboratory for either of the bottles by either the multiple tube or membrane filtration method.
2. On average the membrane filtration and the multiple tubes method
gave the same results. However, the spread of the membrane
filtration results was significantly less than the spread of the
·multiple tubes results~in all but three cases. For both the coliform
and E. coli counts on bottle 196 by the British laboratories there
was no significant difference in these spreads and for the E. coli
count on bottle 196 by the E.E.C. laboratories the spread of the
multiple tubes results was just significantly smaller.
). ln general, there was no significant difference between the spread
of the results from the E.E.C. laboratories and that of the issuing
laboratory. With membrane filtration, however, the spread of the
results from the E.E.C. laborat.ories was significantly greater than
that of the issuing laboratory for the coliform count of bottle 195
-37-/3
4.
In most cases the spread of the results of the British laboratorieswas significantly greater than that of the issuing laboratory.
For the multiple tube results of bottle 196 there was no
significant difference.
5.
In most cases there was no significant difference in the spreadof the results of the British laboratories and th~t ·of the E.E.C.
labora·tories. However for both the multiple tubes coliform and
E. coli count for bottle 195 and for the membrane filtration
coliform count for bottle 196 the spread of the British results was
significantly greater.
6. Bottle 195 contained E. coli only, so. as would be expected there was
no difference between the average results of the coliform and
E. coli counts or in the spread of these results.
7• COMMENTS. As expected, bottle 195 containing large numbers of E. coli
yielded a wide range of numerical results. No laboratory, however, failed
to detect the presence of E. coli by membrane filtration, although J E.E.C.
laboratories failed to confirm its presence by the multiple tube me~hod;
these J laboratories all used purple MacConkey bro·th. However, 4 other
laboratories using this medium obtained satisfactory results. It is
interesting to note that surprisingly good results were obtained with bottle
196 which contained a mixture of small numbers of organisms: only 2
laboratories failed to find E. coli.
It is probably more important not to fail to detect the presence
of small numbers of coliform organisms and/or E. coli than to obtain greater
comparability with large numbers of organisms.
Public Health Laboratory
Royal Cornwall Hospital (City), Infirmary Hill,
Truro , TR 1 2HZ,
Cornwall, U.K.
November, 1976
No. of Method Specimen Laboratories No. of Mean results Membrane 195 E.E.C. labs. 19 1536.9 filtration British labs. 4 104.5.0 Issuing lab. 5 2220.0 196 E.E.C. labs. 19 54.5 British labs. 5 56.6 ' Issuing lab. 5 50.8 Multiple 195 E.E.C. labs. 18 2065.8 tubes British labs. 19 4o4o.o Issuing lab. 5 3040.0 196 E. E. C. labs. 17 58.2 British labs. 19 79.2 Issuing lab. 5 66.0 Table 1 colifonns per 100 ml. No. Standard Range Mean deviation 705.lt >300,2500 1384.3 727.2 >180, 1700 972-3 272.9 1850,2500 2220.0 13.1 35,85 14.2 33.4 22,110 l:t:.4 11.8 34,64 4.4 2513.7 <2,11000. 1816.3 5005.5 >180,23000 3956.1 1535.6 1700,5500 3040.0 )6.8 0,110 8.7 41.) 25,160 10.5 5J.1 35,160 21.2 of E. coli per
Standard deviation
670-9 78l:t:.2 272-9 13.1 7-2 2.9
2569.4 5058.5 1535.6
7.6 6.4 10.7
100
ml. Range
>300,2400 >180,
1700
1850,2500
o,l:t:8 o,
17
2,8 o,
11000
35,2)000
1700,5500
0,26 2,)0 8,J5
SPECIMEN
19S
FIG.
i
COLIFOnMS
~-···
V)
..0 l'tJ
4
~ 0 g
2
1,000
2,000
3/1)0.
~o.
of
coliform
organisms
per
100
E.COLI
MEMBRANE
FILTRATION
METHOD
8
0
2,000
3/1)0+
No.
of
E.coli
per
100
ml
E.E.C.
LABORATORIES
E.E.C
WATER
TRIAL
2
MULTIPLE
TUBE
METHOD
0
1,000
2,000
3,000
5,000+
No.
of
coliform
organisms
per
100
ml
MULTIPLE
TUBE
METHOD
8 6 2
0
1,000
3PJO
4,000
5,000+
No.
of
E.co11
per
100
ml
I cu
[image:41.891.63.551.110.776.2]8
.
en ~6
~ 0
4
.
0 z2
SPECIMEN
196
MEMBRANE
FILTRATION
METHOD
0
50
100
No.
of
coliform
organisms
per
100
ml
MEMBRANE
FILTRATION
METHOD
10 8
.
en .J:l6
tU "- 0
4
.
0 :z:2
0
50
100
No.
of
E.coli
per
100
ml
FIG.
2
E.E.C.
LABORATORIES
E.E.C
WATER
TRIAL
2
COLI
FORMS
MULTIPLE
TUBE
.METHOD
8 6 2
0
50
100
No.
of
coliform
organisms
per
100
ml
E.COLI
MULTIPLE
TUBE
METHOD
8 6
4
20
50
100
No.
of
E.coli
per
100
ml
.
Ul .0 ctl .-4 C;-4 0.
0 z.
0 z10 8 6 4 2 1
FIG.
3
BRITISH
LABORATORIES
SPECIMEN
195
COLIFORMS
0
1000
2000
3000
No.
of
coliform
organisms
per
SPECIMEN
196
COLI
FORMS
No.
of
colifor~m
organisms
MULTIPLE
TUDES
~
EEC
WATER
TRIAL
2
MEMBRANE
FILTRATION
D
f%1
~
~
L
5000
6000-\-0
1000
2000
3000
'*ooo
5000
6000+
I
100
ml.
No.
of
E.
coli
per
100
mJ.
~
--'-I
I
8 2
0
50
100
No.,
of
E.
coli
per
100
[image:43.900.64.547.51.838.2]APPENDIX E.
~inal Report - Distribution No. 3
-42-E. -42-E. C. WATER QUALITY CONTROL TRIAL
REPORT ON DISTRIBUTION NO.3 (DECEMBER 1976)
1 • A total of 39 laboratories participated: 17 Brit
ish
and 22 EEC laboratories •Of
these, 7 used membrane filtration only, 14 used multiple tubes only and18 used both methods • The report from one EEC laboratory (514) was sent
too late to be included in the analysis, but their results were entirely, satisfactory and within the expected limits.
2.
3.
4.
TIME SPECIMENS
IN TRANSIT Days to receipt
No.
of laboratories(E .E .C. laboratories 1 2
only) 2 1
3
4
4
6
5 3
7- 13 5
l\lot stated
1
DElAY IN
STARTING TESTS Days late starting No • of laboratories
(E. E .C. laboratories
Early
I
only) 0 19
2\ 2
Delays in transit or in starting the examinations did not appear to affect the resu its •
MEDIA
Media used No. of laboratoriesE. E. C.
British~ltiple tubes MaeConkey Broth 2 1
Lactose Broth 6
0
Purple Jv\acConkey Broth
3
1
Glutamate Media 5 14
Membrane filtration Endo (agar) 2
0
TTC T ergitol agar 13
0
Endo (broth} 1 1*
Membrane enriched
T eepol broth 3 5
-43-
/2
5.
SIMULATED WATER SA.N\PLES
These were again prepcredby
the addition of known organisms to lactose-free Improved Formate Glutamate medium. All three bottles (A, S and C) contained small numbers of both Escherichia coli andKlebsiella aerogenes. Bottles 8 and C were distributed from the same bulk preparation and were therefore in effect identical.
The expected resu Its are again based on the maximum and minimum- results
obtai ned from the ·examination
of
5 samples of each bottle by the issuing laboratory. These were as follows:TOTAL
NUN\BER
PER 100 mlORGANISM
BOTTLE231
(A) BOTTLE232 (B)
BQTI~E233 {C)
MPN
Nflv1PN
J.lfMPN
N&fCOLIFORMS
3-13
8-14 17-35 11-22 13-2515-25
E.
COLI
(Faecal coli)
3-13
3-78-17
5-13
8-25
3-14
MPN
= h\Jitiple tube method JvV!=
Membrane Filtration6.
RESULTS
Again, there were considerable variations in (a) the volumes of water actually tested {b) temperatures of incubation (c) numbers of membranes or tubes used (d) use of confirmatory tests (e) the statistical td.lles used for MPNresults, and (f) in the way the results were reported. All results as reported have been included in the
analysis,
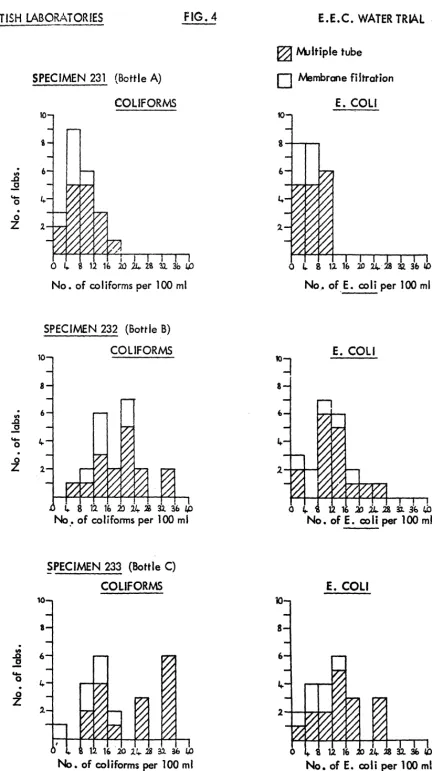
although from information given on some forms, there are clearly some discrepancies in interpretation.The results of the analyses
are shown
in Table 1and
Figuras1 ... 4.
FINDINGS:
1) Despite one high membrane filtration result (Lab.
522,
BottleA}
and onehigh
MPN
result (Lab.519,
BottleB},
statistically there was no significant difference in the average results forany
sample by either method betweenE .E .C.
laboratories,British laboratories and the Issuing laboratory.
2) Excluding the high membrane filtration result (Lab. 522, Bottle A) and the
high MPN resu It (Lab. 519, Bottle B), statistically there was no significant difference between the spread of results obtained by E .E .C. and British laboratories for any sample by either method . With E .E .C. laboratories, however, the spread of results
-44-3) With the same two exclusions, statistically there is no significant difference between the spread of results obtained by the British and E.E.C. laboratories and
those
of the Issuing laboratory, although the spread was generally greaterfor
E .E .C.
laboratories.· 4) With the same two exclusions, there was no significant statistical difference between the results of the British and E.E.C. laboratories, although in general
the
British results were slightly closer to those of the Issuing laboratory.5)
At
this stage, no attempt has been made to evaluate media performance,/3
but six E.E .C. and two British l<i:>oratories failed to detect the presence of colifonn organisms and/or E. coli (faecal coli). These organisms were not isolated by
the
six E.E.C. laboratories from a total of 10 samples, or by the two British laboratories from. three samples.NOTES
The three simulated scmples in this distribution were deliberatelyprepcred
to contain small numbers of organisms, so that the failure of a few laboratories to isolate coliforms and/orE.
coli from some of the sanples was not unexpeded. In fact, only one laboratory (523) failed to detect them in allt.._,
bottles by membrane filtr\JI'ion using endo broth medium. This laboratory 1however 1 obtained satisfactory results in duplicate membrane tests with enriched
teepol broth.
Since scmples B and C were the same, their results should in general •·• similar. Although precise comparison of
such
paired results is difficu!t because of theinherent sampling errors, most of them were satisfactory in that they were generally within the upper and lower 5% statistical confidence limits of the results of the
Issuing laboratory. TheE
.E .C.
laboratories obtained consistently good reproducibility of results from bottles 8 and C by the membrane filtration method.A
report on the infonnation obtained from the three distributions in this feasibilitystudy, together with the conclusions, is being prepared.
Pub I
i~ Health Laboratory 1Royai.Cornwall Hospital (City), Infirmary