This is a repository copy of On the cross-well dynamics of a bi-stable composite plate.. White Rose Research Online URL for this paper:
http://eprints.whiterose.ac.uk/81016/ Version: Submitted Version
Article:
Arrieta, A.F., Neild, S.A. and Wagg, D.J. (Submitted: 2011) On the cross-well dynamics of a bi-stable composite plate. Journal of Sound & Vibration, 330. 3424 - 3441. ISSN
0022-460X
https://doi.org/10.1016/j.jsv.2011.02.006
Reuse
Unless indicated otherwise, fulltext items are protected by copyright with all rights reserved. The copyright exception in section 29 of the Copyright, Designs and Patents Act 1988 allows the making of a single copy solely for the purpose of non-commercial research or private study within the limits of fair dealing. The publisher or other rights-holder may allow further reproduction and re-use of this version - refer to the White Rose Research Online record for this item. Where records identify the publisher as the copyright holder, users can verify any specific terms of use on the publisher’s website.
Takedown
If you consider content in White Rose Research Online to be in breach of UK law, please notify us by
On the cross-well dynamics of a bi-stable composite
plate
Andres F. Arrieta∗
System Reliability and Machine Acoustics, Dynamics and Vibrations Group Technische Universit¨at Darmstadt, LOEWE-Zentrum AdRIA, Darmstadt, 64289
Germany
Simon A. Neild, David J. Wagg
Department of Mechanical Engineering,University of Bristol, Bristol, U.K, BS8 1TR
Abstract
Multi-stable composites are a novel type of composites capable of adopting
multiple statically stable configurations. Due to the multi-stability property
this type of composite material has been considered for several applications,
particularly for morphing structures. The change of shape between stable
states is achieved by a nonlinear mechanism known as snap-through. Most
of the research done on these composites has focused on predicting the
con-figuration after manufacture, its static characteristics and static actuation
strategies to induce snap-through. However, these structures will operate
subject to dynamic loads. Yet, very little work has been carried out to
ex-amine the dynamic behaviour of bi-stable composites. This paper focuses on
the study of the cross-well dynamics of a bi-stable composite plate. A simple
model previously derived for the dynamics confined to a single stable state is
∗Corresponding author. Tel.:+4961517058324
extended to include cross-well dynamics. The rich dynamics are
experimen-tally investigated, focusing on cross-well oscillations and the key dynamic
features of snap-through. Numerical simulations are obtained and compared
to the experimental results showing good agreement. In particular,
experi-mentally observed characteristics suggesting chaotic oscillations for cross-well
dynamics are captured well by the proposed model. The results herein could
be used for implementing control strategies for both configuration morphing
and undesired snap-through suppression of bi-stable composites.
Keywords: bi-stable composites, morphing structures, snap-through,
chaotic oscillations
1. Introduction
Composite laminates are increasingly employed in a wide variety of
en-gineering applications. The ever growing need for better performance has
resulted in innovative solutions such as structures capable of adjusting
prop-erties to perform optimally under different operational conditions, known as
adaptive structures [1]. Within this context, the concepts of morphing
mate-rials and structures have emerged offering enhanced performance and
adapt-ability for several applications [2, 3]. A promising advance in this direction is
the development of curved composite laminates exhibiting multiple statically
stable shapes [4]. The multiple configurations arise from asymmetric residual
thermal stresses induced during the curing process due to an unsymmetric
stacking sequence [5]. The transition between the multiple statically stable
states is achieved by a snap-through mechanism which is strongly
being considered for morphing aerospace structures, since energy is only
re-quired to shift between stable shapes [7]. Recently, techniques to produce a
wide range of desired stable configurations by designing the induced thermal
stresses have been developed [8]. In addition, conceptual morphing
applica-tions taking advantage of these capabilities have been proposed [9, 10].
Most of the studies on multi-stable composites have focused on plates
exhibiting two stable configurations, known as bi-stable composite plates.
Several papers presenting models predicting the shape after the
manufac-turing process and static characteristics of these composites have been
pre-sented [11, 12]. More specifically, these have focused on the identification
of the stiffness characteristics [13, 14] and the static load triggering
snap-through for bi-stable composites [15, 16, 17]. However, these laminate
struc-tures will inevitably be exposed to high levels of dynamic excitation
partic-ularly for morphing applications operating on an aeroelastic environment.
Early failure could be induced to the structures incorporating multi-stable
composites by high levels of vibration. Moreover, undesired snap-through
(sudden jumps between stable states) could be triggered by dynamic
pertur-bations. Yet, very little work on the dynamics of multi-stable composites
has been carried out to date. The nonlinear response confined to a single
stable shape of a bi-stable plate has been experimentally studied [18]. Based
on these observations a simple model capturing the complex nonlinear
dy-namics associated with subharmonic resonances was developed showing very
good agreement with experimental results. However, cross-well dynamics
were beyond the scope of this work.
approx-imation of the strain field was presented and validated using finite element
analysis [19]. Oscillations occurring after a snap-through induced by a
quasi-static load were studied showing good qualitative agreement. Simple one
degree-of-freedom models describing the dynamics of square bi-stable plates
have been presented [20, 21]. Good qualitative agreement was achieved and
evidence of complex dynamics for oscillations involving snap-through was
shown. Although relevant, these were only preliminary studies leaving open
many aspects of the dynamics of these structures, for instance the required
levels on dynamic forcing to trigger snap-through were not investigated.
The purpose of this paper is to account for cross-well dynamics
extend-ing the study for the dynamics of a bi-stable plate presented in Ref. [18].
A [04 −904]T square bi-stable carbon-fibre epoxy plate similar to that used
in Ref. [18] is considered. Experimental tests are performed to study the
behaviour of the plate for dynamically induced snap-through. The condition
to trigger the snap-through phenomenon is modelled and experimentally
val-idated. The relationship between snap-through force and forcing frequency
is obtained in order to identify the minimum dynamic force to trigger the
jump phenomenon. Strong nonlinear oscillations showing characteristics of
chaotic behaviour are observed for constant changes between stable states,
this is for constant cross-well oscillations.
The experimental behaviour is modelled by extending the simple model
presented in Ref. [18], including piece-wise defined restoring forces in the
nonlinear modal equations. Numerical simulations using the proposed model
for time series of the transverse displacement are obtained and compared
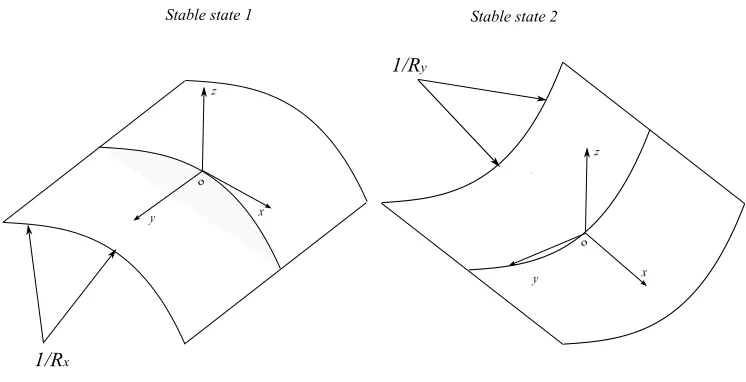
Figure 1: Statically stable states of a bi-stable composite
captures the experimental observations of chaotic behaviour for cross-well
dy-namics. Diagrams comparing experimentally observed dynamics with
numer-ical simulations are presented for the main parameter range of the bi-stable
plate considered herein. Boundaries separating regions in the parameter
space marking qualitative changes in the response of the plate are captured
accurately by the model. This information, concisely presented in these
di-agrams, can be potentially used to develop efficient strategies for morphing
actuation and stabilization avoiding undesired snap-through of structures
incorporating bi-stable composites.
2. Bi-stable composites and snap-through
Bi-stable composites are a type of composites capable of adopting two
statically stable shapes. A schematic diagram of the stable configurations
of a bi-stable composite plate is shown in Fig. 1. Ideally a bi-stable square
that each stable configuration would exhibit equal radii of curvature. The
curvature direction for each state is orthogonal to the other as shown in Fig. 1.
This property is defined as a perfect orthogonal symmetry between the stable
configurations of the plate. As a result of this property, the dynamic response
for oscillations confined to a stable state are also orthogonally symmetric, this
means that each state will exhibit identical dynamic behaviour only with a
rotation of the local frame of π
2 with respect to the other. However, any real specimen will show imperfections in the final shapes as the manufacturing
process has limited accuracy, breaking the perfect symmetry. In particular,
the static curvature of each state would have different values for any real
specimen. Nevertheless, the response of the stable configurations remains
qualitatively symmetric despite manufacturing imperfections.
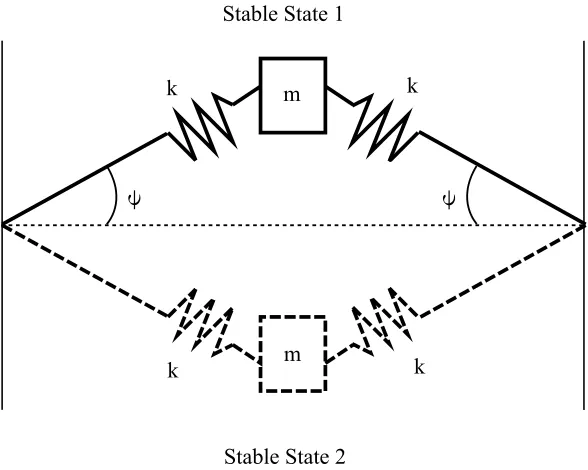
The change between stable states is achieved via a jump phenomenon
known as snap-through [4]. The snap-through mechanism is a sudden event
where the structure undergoes large amplitude displacements [22]. This
mechanism has been conceptually studied using the schematic model shown
in Fig. 2. The underlying principle of the model states that the dynamic
response of a system which may undergo a snap-through is only affected by
it when a critical displacement is reached triggering the jump phenomenon.
Based on this, it is assumed that the oscillations confined to one stable state
are unaffected by the presence of the second stable state. Only when a
criti-cal displacement is reached the snap-through mechanism plays a part in the
dynamics of the bi-stable structure.
This critical displacement is straight forward to define for a lumped mass
contin-Figure 2: Double-hinge mechanism to model snap-through.
uum such as the bi-stable composites considered here, as each point on the
plate undergoes a different displacement when a snap-through is triggered.
However, it is assumed that the deflection shape of the bi-stable plate may
be modelled with linear mode shapes, such that the relative deflection at
any instant of the forcing period between points remains proportional. As a
result, once a point reaches its critical displacement a snap-through is
trig-gered as all the points in the plate must have also reached their particular
threshold due to the proportionality of mode shapes. This provides a simple
condition to define the forcing level required to trigger the snap-through
phe-nomenon. However, the behaviour during the snap-through phenomenon is
far more complex and the actual shape of the unstable equilibrium depends
[image:8.595.158.452.123.358.2]a recent paper the saddle shape of the unstable static equilibrium has been
shown to be very close to a flat shape. More specifically, the farthest away
distance from a flat plane tangent to the bi-stable plate’s centre for the stable
shapes is one order of magnitude larger in comparison to that of the saddle
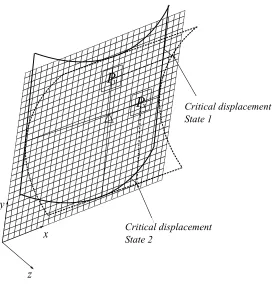
unstable shape [23]. In view of this to a first approximation, it is assumed
that the critical displacement for a point on the plate is given by the static
deflection required to reach this flat unstable plane as illustrated in Fig. 3. At
this point stable state 2 is defined as the configuration exhibiting a smaller
curvature, and stable state 1 having the larger one. The x-direction is chosen
to coincide with the curved direction of stable state 1, thus the curved
direc-tion of stable state 2 coincides with the y-direcdirec-tion, as can be seen in Fig. 3.
In the ideal case, i.e. for bi-stable plates with perfect orthogonal
sym-metry, the values for the critical displacement would be equal. However, as
mentioned above in reality is difficult to achieve. Furthermore, the more
general rectangular shape bi-stable plates are inherently asymmetric due to
different static curvatures and length dimensions showing only qualitative
symmetry in the response of each configuration. Thus, in general each stable
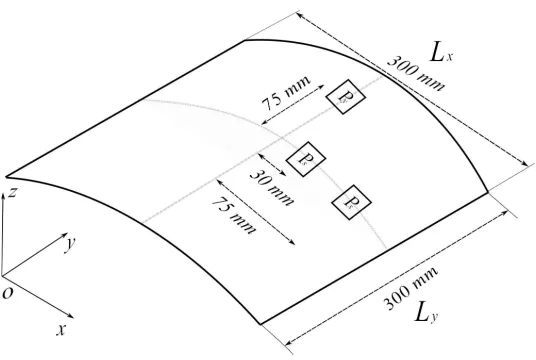
state will exhibit different critical displacement values. For the realistic case,
the critical displacement for each stable state is associated with the static
deflection of a point lying on a line perpendicular to the flat direction of each
configuration. These are defined here using the reference points Px and Py,
located at (225,150) and (150,225) respectively shown in Fig. 4, where the
associated critical displacements for each stable state are presented in Fig. 3.
Figure 3: Critical displacements for a bi-stable composite. The flat squared surface
Figure 4: Measured points on the bi-stable plate.
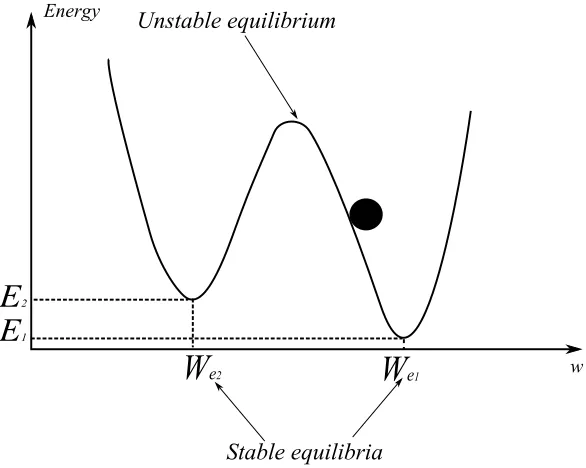
an asymmetric double well potential schematically shown in Fig. 5. It can
be seen that the energy required to pass the maximum (hilltop) depends on
which state the system is initially oscillating. Hence, the force required to
induce snap-through depends on the initial state of the plate, as the critical
displacement of one of the states will be smaller than for the other.
3. Cross-well dynamics model
The model for the cross-well dynamics of a bi-stable plate for the studied
frequency range is obtained extending that developed for oscillations confined
to a single stable configuration (single-well dynamics) presented in Ref. [18].
Here we recall the most relevant results leading to the development of the
single-well dynamics model for completeness. Three modes of vibration were
observed to characterise the response of the plate around the frequency range
w
W
e2Energy
Unstable equilibrium
Stable equilibria
E
2W
e1 [image:12.595.160.453.124.358.2]E
1Figure 5: Schematic diagram of a potential well for a bi-stable plate.
dynamics. These oscillations, associated with the dominant effect caused by
the static curvature of bi-stable plates, are modelled by including quadratic
terms in the time response nonlinear equations. Furthermore, the effects
leading to cubic terms in the equations of motion are overshadowed by the
dominance of the squared terms generated by the curvature effects. Thus,
the cubic terms are neglected as is conventional for curved structures such as
shells [24]. The nonlinear modal equations capturing the dynamic features
for single-well oscillations were written as [18]
¨
W1+ 2ζw1ωw1W˙1+ω
2
w1W1+α11W
2
1 +α13W1W3 =Q1sin(Ωt), (1)
¨
W2+ 2ζw2ωw2W˙2+ω
2
w2W2+α22W2
2
+α23W2W3 =Q2sin(Ωt), (2)
¨
W3+ 2ζw3ωw3W˙3+ω
2
where W1 is the time response coefficient of the transverse displacement for
mode w1, W2 is the time response coefficient of the transverse displacement
for mode w2, W3 is the time response coefficient of the transverse
displace-ment for mode w3, Ω is the forcing frequency, Qi is the modal participation
factor for mode (i), αij is the coefficient for the nonlinear quadratic term for
an interaction between modes (wi, wj). The total transverse displacement,
w(x, y, t), for an arbitrary point is given by adding the contribution of each
mode to the deflection as
w(x, y, t) = Θw1(x, y)PiW1(t) + Θw2(x, y)PiW2(t) + Θw3(x, y)PiW3(t), (4)
where Θw1(x, y)Pi, Θw2(x, y)Pi and Θw3(x, y)Pi are the values of the mode
shapes associated with modes w1, w2 and w3 evaluated at point Pi.
In order for the model to account for cross-well dynamics, the discussion
given in section 2 is employed. As previously stated, only after reaching
a critical deflection threshold the snap-through phenomenon would be
trig-gered. This threshold needs to be incorporated in the set of modal equations
to account for the bi-stability of the plate. Thus, using the critical
displace-ment condition to mark the onset of snap-through, we introduce piece-wise
defined restoring forces into Equations (1)-(3) to obtain,
¨
W10+ 2ζwsi
1 ωwsi1
˙
W1+F1(w) =Q1sin(Ωt), (5)
¨
W01+ 2ζwsi
2 ωwsi2
˙
W2+F2(w) =Q2sin(Ωt), (6)
¨
W11+ 2ζwsi
3 ωwsi3
˙
where the restoring force for each mode is given by
F1(w) =
ω2
ws2
1 (W
1 +ws
2
e ) +α11(W1+ws
2
e )
2
+α13(W1+ws 2
e )(W3+ws
2
e ), f or w(x, y, t)<0
0, f or w(x, y, t) = 0
ω2
ws1
1 (W
1 −ws
1
e ) +α11(W1−ws
1
e )
2
+α13(W1−ws 1
e )(W3 −ws
1
e ), f or w(x, y, t)>0
, (8)
F2(w) =
ω2
ws2
2 (W
2 +ws
2
e ) +α11(W2+ws
2
e )
2
+α13(W2+ws 2
e )(W3+ws
2
e ), f or w(x, y, t)<0
0, f or w(x, y, t) = 0
ω2
ws1
2 (W
2 −ws
1
e ) +α22(W2−ws
1
e )
2
+α23(W2−ws 1
e )(W3 −ws
1
e ), f or w(x, y, t)>0
, (9)
F3(w) =
ω2
ws2
3 (W
3+ws
2
e ), f or w(x, y, t)<0
0, f or w(x, y, t) = 0
ω2
ws1
3 (W
3−ws
1
e ), f or w(x, y, t)>0
, (10)
where ωwsj
i is the natural frequency of thei mode in the j state, for example
ωws1
3 is the natural frequency of mode w3 for stable state 1, and the time
response and nonlinear coupling coefficients, Wij andαij were defined above.
The equilibrium positions for state 1 and state 2, ws1
e and ws
2
−2 −1 0 1 2 −8
−6 −4 −2 0 2 4 6 8
Transverse displacement [mm]
Restoring Force [N]
w
s21
w
[image:15.595.160.431.135.354.2]s1 1
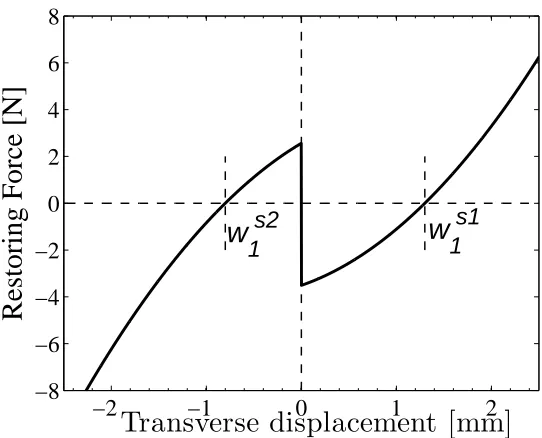
Figure 6: Quadratic restoring force including snap-through nonlinearity for mode w1.
are assumed to be equal to the static critical displacements for state 1 and
state 2 respectively. The above definition gives a piece-wise quadratic
restor-ing force for modes w1 and w2, and a piece-wise linear restoring force for
mode w3. For illustration, the restoring force for mode w1 is schematically
shown in Fig. 6. For each mode the defined restoring force gives a
dou-ble well potential, exhibiting two stadou-ble equilibria separated by an unstadou-ble
equilibrium matching that shown in Fig. 5. By including piece-wise defined
restoring forces with a critical displacement condition the model is extended
to capture oscillations between stable configuration (cross-well dynamics).
Hence, a model for single-well and cross-well oscillations is obtained. These
two types of dynamic behaviour encompass the whole range of responses
(a) (b)
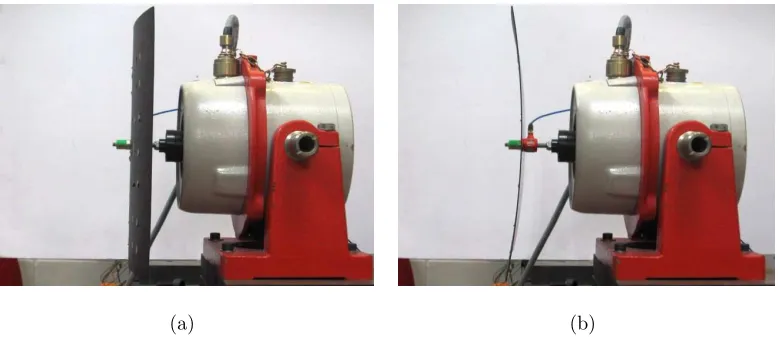
Figure 7: Bi-stable plate mounted on a shaker used as external excitation source. (a)
Stable state 1. (b) Stable state 2. (Reproduced with the kind permission of the Journal
of Intelligent Material Systems and Structures [25])
4. Experimental dynamic response
In this section, the procedure to experimentally study the dynamic
re-sponse in the parameter range of interest for the bi-stable plate is presented.
The main objective of the experimental tests is to investigate the key
dy-namic features of cross-well oscillations and the role of snap-through in the
response.
4.1. Experimental assembly
A bi-stable plate with unsymmetric stacking sequence [04 −904]T and
dimension 300 by 300 mm similar to that used in Ref. [18] is employed as test
specimen for this study. The two stable configurations of the specimen are
shown in Figs. 7(a) and 7(b). The experimental specimen is attached to an
electromechanical shaker used as external source of vibration. The external
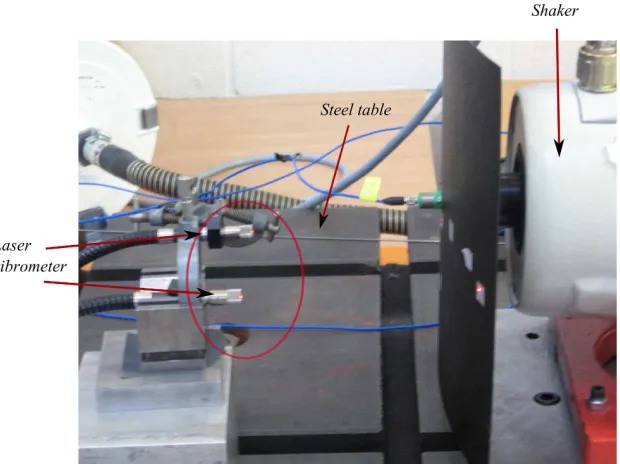
bi-Figure 8: Schematic diagram of the experimental rig.
stable plate to simulate free edge boundary conditions. A load cell is located
between the shaker and the plate to measure the external force acting on the
specimen. The experimental specimen is mounted on a steel table of large
mass in order to avoid interaction between the plate and its surroundings. A
differential laser vibrometer is used to measure relative displacement between
the centre of the specimen and a given point on the plate in order to obtain
time series for the displacement response. The signals from the vibrometer
and the load cell are filtered and amplified using a signal conditioner. These
signals are then read using an analog-to-digital acquisition box and the data
is stored using a digital interface. A controller monitoring the amplitude
of the force sensed by the load cell is implemented to minimise the impact
[image:17.595.151.460.119.360.2]experimental assembly is shown in Fig. 8 where labels can be found for all
the mentioned equipment. The experimental assembly used to perform the
experiments is shown in Fig. 9 and the material properties of the bi-stable
plate are listed in Table 1.
P roperty F ibrevol. P ly thickness Density ρ Exx Eyy Ga
xy νxya =νyxa
[%] [mm] [kg/m3
] [GP a] [GP a] [GP a]
[image:18.595.110.571.220.288.2]V alue 57.7 0.131 1570 164 12 4.6 0.3
Table 1: Material properties for a ply of HexPly 8557 IM7 used to manufacture the
bi-stable plate experimental specimen.
4.2. Dynamic response confined to a stable state
The most relevant dynamic features of the response for each stable state
are recalled in this section, for details on the experimental study refer to
Ref. [18].
The nonlinear behaviour of the bi-stable plate is studied using
Experi-mental Frequency Response Diagrams, which can be thought of as combining
the concepts of Frequency Response Functions (FRF) and Poincar´e maps
to provide information of modal properties and nonlinear oscillations as
de-scribed in Ref. [18]. These diagrams are obtained using a single harmonic (of
constant amplitude) force input for stepped frequency sweeps. Peak-to-peak
amplitudes of response are sampled over several consecutive forcing periods
of steady state motions and plotted using the forcing frequency as
parame-ter. For a linear response, a single amplitude value is sampled for consecutive
Figure 9: Experimental Assembly. Ling shaker V405, vibrometer OFV-552. (Reproduced
15 20 25 30 35 40 45 0
0.5 1 1.5 2 2.5 3 3.5 4
Frequency [Hz]
Displacement/Force [mm/N]
ω
3 [image:20.595.160.434.273.493.2]ω
1ω
2Figure 10: Experimental receptance (Displacement/Force) FRF for point Px on stable
15 20 25 30 35 40 45 0
1 2 3 4 5
Frequency [Hz]
D
is
p
la
ce
m
en
t
[m
m
]
ω
s1 2ω
s11
ω
[image:21.595.165.432.127.353.2]s1 3
Figure 11: Experimental frequency response diagram for pointPxin stable state 1. Fo=1.0
N, frequency range Ω=[15,46].
frequency indicate the presence of multiple harmonics in the response
sig-nalling nonlinear oscillations. Results obtained for points Px and Py shown
in Fig. 4 are used to characterise the response of the bi-stable plate. The
ex-perimental frequency response diagram of pointPx in stable state 1 obtained
for a low forcing amplitude of 1 N is shown in Fig. 11. Three modes dominate
the low amplitude response, mode ws1
1 at 17.6 Hz, mode ws 1
2 at 19.4 Hz and
mode ws1
3 at 45.4 Hz. Figure 12 shows the diagram for a forcing amplitude
of 5 N of point Px for stable state 1. Nonlinear oscillations, signalled by
multiple points in the experimental frequency response diagrams [26], can be
seen at twice the frequency of modes ws1
1 and ws
1
2 .
15 20 25 30 35 40 0
1 2 3 4 5 6 7 8
Frequency [Hz]
D
is
p
la
ce
m
en
t
[m
m
]
ω
s11
ω
s1
2
2
ω
s1
1
2
ω
[image:22.595.166.431.270.489.2]s1 2
Figure 12: Experimental frequency response diagram for pointPxin stable state 1. Fo=5.0
15 20 25 30 35 40 45 0
0.5 1 1.5 2
Frequency [Hz]
D
is
p
la
ce
m
en
t
[m
m
]
ω
s21
ω
[image:23.595.156.432.134.357.2]s2 3
Figure 13: Experimental frequency response diagram for pointPyin stable state 2. Fo=1.5
N, frequency range Ω=[15,47].
experimental frequency response diagram of point Py in stable state 2 for a
forcing amplitude of 1.5 N is shown in Fig. 13. Modes ws2
2 and ws
2
3 , at 17.8
Hz and 46.2 Hz appear in the response. Note that the response of pointPy in
stable state 2 is qualitatively similar to that of pointPxdue to the orthogonal
symmetry of the response. However as orthogonal symmetry is broken due
to manufacturing imperfections, mode ws2
1 does not appear in Fig. 13 as for
stable state 2 the point Py lies on a nodal line of this mode. The natural
frequency of mode ws2
1 is identified to be at 16.9 Hz.
A comparison for the regions showing nonlinear response for pointPx in
stable state 1 and point Py in stable state 2 is given in Fig. 14. When two
32 34 36 38 40 0 1 2 3 4 5 6 7 8 Frequency [Hz] D is p la ce m en t [m m ]
2ωs1
1 2ω
s1 2
(a)
32 33 34 35 36 37 38
1 2 3 4 5 6 7 8 Frequency [Hz] D is p la ce m en t [m m ]
2ωs2
2
2ωs2
1
[image:24.595.120.488.125.294.2](b)
Figure 14: Subharmonic oscillations of modesw1andw2for a forcing amplitudeFo= 5 N,
for (a) pointPxin state 1 and (b) point Py in state 2. Vertical lines show the regions of
subharmonic oscillations at twice the frequency of modesw1 andw2in both stable states.
dominant harmonics in the response is signalled. This type of response
coin-cides with 1/2 subharmonic oscillations of modes w1 and w2 for both stable
states as shown in Ref. [18], matching well known results in the nonlinear
dynamics literature [27, 28]. For both frequency ranges, when comparing the
two stable states it can be seen that these is a small shift in the frequencies
where subharmonic oscillations for modes w1 and w2 occur, however the
re-sponse is qualitatively similar. The previous results confirm the assumption
of a qualitative orthogonally symmetric response for the stable states of the
plate, however due to the manufacturing imperfections it is not perfect.
4.3. Critical displacement condition
The critical displacements for points Px and Py are statically measured
giving 5 mm and 1.5 mm respectively. Thus, the deflection thresholds to
state 1 to stable state 2. The radii of curvature are 0.6 m and 10 m for
stable state 1 and 2 respectively. These values represent static
characteris-tics of the plate, therefore we perform dynamic measurements of the critical
displacement to reveal any dynamic effects not captured by the critical
dis-placement condition. For practical reasons the deflection of point Ps located
at (180,150), which is closer to the centre of the plate on the same
perpen-dicular line as point Px, is measured. This is done as deflections underwent
by point Ps are smaller in comparison to those of point Px, ensuring that
the large displacements can be measured with the available laser vibrometer.
The defined deflection threshold would remain valid due to the
proportion-ality of the deflection shape assumed in section 2 for the plate, which implies
that when point Ps reaches its critical displacement point Px must also have
done so. The statically measured critical displacement for point Ps is 0.2
mm.
The displacement instants before a snap-through is triggered from stable
state 2 to stable state 1 for point Ps as a function of the forcing frequency is
presented in Fig. 15. As with the experimental frequency response diagrams
(Figs. 11-14), the displacement is measured over consecutive forcing periods
with the maximum displacement for each forcing period plotted. Multiple
displacement amplitudes are observed for some frequencies due to
subhar-monic behaviour. However the subharsubhar-monic response is small such that the
displacements are clustered around a mean value which indicates the critical
displacement threshold. It can be seen that away from the linear and
sub-harmonic resonances the dynamic critical displacement matches the static
displace-ment overshoots its static value around resonances as inertial forces dominate
the response for these frequencies. Thus, the elastic forces (stiffness) of the
plate dominate the snap-through phenomenon when the plate is driven at
frequencies away from resonance, whereas inertial effects become dominant
around both linear and nonlinear resonances. Therefore, the condition
mark-ing the onset of the snap-through phenomenon varies with the frequency of
the dynamic excitation. Hence, the threshold incorporating this dynamic
effect is redefined as a dynamic critical displacement in section 5.
15 20 25 30 35 40 0
0.5 1 1.5 2 2.5 3
Frequency [Hz]
D
is
p
la
ce
m
en
t
[m
m
]
[image:26.595.156.433.315.534.2]Static critical displacement
Figure 15: Experimental peak-to-peak displacement for pointPsinstants before a
dynam-ically induced snap-through from state 2 to state 1 is triggered. This marks the critical
displacements as a functions of the forcing frequency for snap-through from state 2 to
4.4. Cross-well dynamic response
Having identified a dynamic condition marking the onset of snap-through
in section 4.3, the force required to achieve this deflection is also measured.
As for the dynamic critical displacement, the force required to induce
snap-through from state 2 to state 1 is measured over consecutive forcing periods,
the results are shown in Fig. 16. The force vs frequency relationship is
in good agreement with previous works on snap-through of shells, see for
example [29]. Once more, the results are clustered around a value showing
that the forcing level before snap-through remains almost constant. This
force threshold marks the boundary separating oscillations confined to stable
state 2 with those confined to stable state 1.
Due to the asymmetry of the potential wells of the system, seen in Fig. 5,
once a snap-through from the lower energy to the higher energy well is
triggered, the system remains oscillating confined to this state. It can be
seen that the regions requiring less forcing input to trigger snap-through are
around the linear and subharmonic resonances of the bi-stable plate in state
2, at 16.9, 17.8, 34, 36 and 46.2 Hz. This result shows that the characteristics
of the dynamic response, both linear and nonlinear, for oscillations confined
to a potential well, influence the snap-through dynamics. This fact has not
been highlighted in previous dynamic studies considering snap-through in
the of bi-stable plates [9, 20, 21].
To illustrate the process of snap-through from state 2 to state 1 the
dis-placement and force response for a forcing frequency of 35 Hz are shown in
Fig. 17. Inspecting Figs. 17(a) and 17(c) at around 1.2 s a very noticeable
15 20 25 30 35 40 45 0
2 4 6 8 10 12
Frequency [Hz]
F
o
rc
e
[N]
ω
s22
2
ω
s2 2
[image:28.595.161.437.246.465.2]ω
s2 1Figure 16: Experimental forcing amplitude required to dynamically induce snap-through
from state 2 to state 1. The vertical lines indicate the relationship between the modes and
subharmonic oscillations with the regions requiring less actuation input to dynamically
instant where the snap-through is dynamically triggered. An interesting
ob-servation is the difference between the DC shift of the displacement response
before and after the snap-through. This is approximately 0.27 mm which is
very close to the static out-of-plane displacement that pointPs undergoes to
reach the other stable configuration. The time series then settles down to zero
as laser vibrometers cannot measure DC components in the displacements.
As the forcing amplitude is further increased a dynamic snap-through
from state 1 to state 2 is induced. Due to the asymmetry in the shapes of the
stable configurations, the difference between the energy required to overcome
the unstable equilibrium separating the stable equilibria is different. As a
result, when a snap-through is induced from an initial condition lying in the
potential well of stable state 1, the energy given to the plate is sufficient to
trigger a snap-through back from stable state 2 to state 1 as shown in Fig. 18.
The first snap-through is induced at around 2.44 s, where a marked change
in both the displacement and force time responses is seen. In this limiting
case, after this event the plate returns to oscillate around stable state 1 for
a brief time followed by a second snap-through at 2.6 s.
If the energy of the input is increased the system immediately jumps
back to stable state 1, triggering a continuous steady state snapping
be-tween stable configurations (continuous cross-well oscillations) as shown in
Fig. 19(a). This response shows a very erratic non-repeating behaviour in
the displacement time series. Due to the high levels of energy involved in
this type of oscillations the forcing input interacted with the response of the
plate as can be seen in Fig. 19(b). The non-repeating character of the
0 1 2 3 4 5 −3 −2 −1 0 1 2 3 Time [s] D is p la ce m en t [m m ] State 1 State 2 (a)
0 10 20 30 40 50 60
0 0.02 0.04 0.06 0.08 0.1 0.12 0.14 0.16 Frequency [Hz]
PSD Displacement [mm
2 Hz
−1
]
(b)
0 1 2 3 4 5
−20 −10 0 10 20 30 Frequency [Hz] F o rc e [N] (c)
0 10 20 30 40 50 60
0 1 2 3 4 5 6 Frequency [Hz]
PSD Force [N
2 Hz
−1
]
[image:30.595.113.491.192.542.2](d)
Figure 17: Experimental response for a dynamically induced snap-through from state 2 to
state 1. Forcing frequency Ω=35.0 Hz.(a) Displacement time response. (b) Displacement
2 2.2 2.4 2.6 2.8 3 −1.5 −1 −0.5 0 0.5 1 1.5 Time [s] D is p la ce m en t [m m ] Second snap First snap (a)
2 2.2 2.4 2.6 2.8 3
[image:31.595.185.406.161.579.2]−30 −20 −10 0 10 20 30 Time [s] F o rc e [N] First Snap Second Snap (b)
Figure 18: Experimental response for a dynamically induced snap-through from state 1
to constant snap-through. Forcing frequency Ω=27.0 Hz.(a) Displacement time response.
in Fig. 19(c) at incommensurate frequencies of the modes, as well as at the
modal frequencies and their integer multiples, are indications of a chaotic
re-sponse [30]. Inspecting the spectrum with a logarithmic scale for the Power
Spectrum Density (PDS) of the displacement in Fig. 21, broadband peaks
are observed for the response reaffirming the case for a chaotic behaviour
of the plate for this dynamic regime. Figure 20 shows the forcing
ampli-tude required to trigger this behaviour as a function of the forcing frequency.
Similarly to Fig. 16, this force threshold marks the boundary separating
os-cillations confined to stable state 1 with the region of constant snap-through
between stable states.
5. Simulation results and model validation
To validate the proposed model, numerical simulations are obtained and
compared to the experimental results for the cross-well dynamics of the plate.
Initially, we introduce the unmodelled dynamic effect on the threshold
mark-ing the onset of the snap-through phenomenon. This is achieved by definmark-ing
the dynamic critical displacements as
ws1
crit(Ω) =
2 (Ω−ωws1 1 )
2
+d1Ω
+ 2
(Ω−2ωws1 1 )
2
+d2Ω
+ws1
static, (11)
and for state 2 by
ws2
crit(Ω) =
2 (Ω−ωws2 2 )
2
+e1Ω
+ 2
(Ω−2ωws2 2 )
2
+e2Ω
+ws2
static, (12)
where Ω is the forcing frequency, d1, d2, e1 and e2 are constants related to
the amplitude of the critical displacement around the resonances, which are
1.6 1.8 2 2.2 2.4 2.6 −2 −1 0 1 2 Time [s] D is p la ce m en t [m m ] (a)
1.6 1.8 2 2.2 2.4 2.6
−40 −30 −20 −10 0 10 20 30 Time [s] F o rc e [N] (b)
10 20 30 40 50 60
0 0.01 0.02 0.03 0.04 0.05 0.06 Frequency [Hz]
PSD Displacement [mm
2 Hz
−1
]
(c)
0 10 20 30 40 50 60
0 5 10 15 20 25 Frequency [Hz]
PSD Force [N
2 Hz
−1
]
[image:33.595.116.488.197.545.2](d)
Figure 19: Experimental response for a constant snap-through between stable states.
Forcing frequency Ω=23.0 Hz.(a) Displacement time response. (b) Displacement power
20 25 30 35 40 15
20 25 30 35
Frequency [Hz]
F
o
rc
e
[N]
2
ω
[image:34.595.159.436.262.490.2]s1 w1
Figure 20: Experimental forcing amplitude required to dynamically induce snap-through
10 20 30 40 50 60 10−6
10−5 10−4 10−3 10−2 10−1
Frequency [Hz]
PSD Displacement [mm
2
Hz
−1
[image:35.595.152.444.250.478.2]]
Figure 21: Experimental displacement PSD with logarithmic scale for continuous
snap-through between stable stares for a forcing frequency of Ω=23.0 Hz. Broadband peaks are
to the equilibrium position for each state, that is for state 1
ws1
static =w
s1
e , (13)
and for state 2,
ws2
static =w
s2
e , (14)
To validate the above definition given in Eqs. (11)-14, Fig. 22 shows
the comparison between the simulated dynamic critical displacement to the
experimental mean critical displacement calculated by averaging the
consec-utively sampled values plotted in Fig. 15. Averaging the values for a given
forcing frequency does not smooth out the underlying dynamic behaviour
and allows for clearer comparison with the simulated results. Good
agree-ment can be seen for the dynamic critical displaceagree-ment ws2
crit marking the
onset of snap-through from state 2 to state 1 with the proposed function. A
similar condition can be formulated for the snap-through from state 1 to the
steady state constant snap-through between stable states. However, due to
the chaotic nature of the response of the bi-stable plates before these
oscil-lations, it is impossible to obtain experimentally the critical displacement as
a function of the frequency with the available measuring equipment.
Never-theless, it is hypothesized that the mechanism is essentially the same as for
the snap-through from state 2 to state 1.
A simulated time series for a snap-through from stable state 2 to stable
state 1 is shown in Fig. 23 for a forcing frequency of 39 Hz and a forcing
amplitude of 5.5 N. Once the snap-through is triggered the resulting
oscilla-tions are restricted to state 1, as not enough energy is given to the system to
15 20 25 30 35 40 45 0.5
1 1.5 2 2.5
Frequency [Hz]
D
is
p
la
ce
m
en
t
[m
m
[image:37.595.159.438.259.488.2]]
Figure 22: Comparison between experimental (dots) and simulated (solid line) dynamic
showing oscillations involving constant snap-through between stable states is
given in Fig. 24(a) for a forcing frequency of 23 Hz. The time response shows
a non-repeating behaviour where non-periodic oscillations between the
mini-mum and maximini-mum values appear to occur near a dominant frequency. The
power spectrum of the time series shows more than three peaks at
incom-mensurate frequencies, around 7, 13, 41 and 43 Hz in Fig. 24(b), matching
the results previously shown in Fig. 19(a). Furthermore, the simulated PSD
of the displacement plotted with logarithmic scale shows broadband peaks
in Fig. 25. This compares qualitatively with experimental results shown in
Fig. 21, matching the observed indications pointing to a chaotic behaviour
given in section 4.4.
To show the global validity of the model, the different regions of linear and
nonlinear responses using the forcing amplitude and frequency as parameters
are compared summarising the different dynamic behaviours exhibited by the
bi-stable plate. The comparison of the experimental and simulated dynamic
response for oscillations initially starting in state 2 is presented in Fig. 26.
Four distinctive regions are observed: linear oscillations confined to stable
state 2, subharmonic oscillations of modes ws2
1 and ws
2
2 , linear oscillations
confined to stable state 1, and constant snap-through oscillations between
stable state 2 and stable state 1. The experimental boundary marking the
change from stable state 2 to stable state 1 (solid line with ♦ markers) is
compared to the simulated boundary (solid line) showing a good match. It
can be seen that the simulated results predict quite accurately the
differ-ent boundaries marking the onset of the subharmonic oscillations and the
0 2 4 6 8 10 −5
0 5 10 15
Time [s]
D
is
p
la
ce
m
en
t
[m
m
[image:39.595.160.435.252.480.2]]
Figure 23: Simulated response for a dynamically induced snap-through from state 2 to
state 1. Forcing frequency Ω=39.0 Hz. Forcing amplitude Fo=15.6 N. Compare with
2 2.2 2.4 2.6 2.8 3 −15 −10 −5 0 5 10 15 Time [s] D is p la ce m en t [m m ] (a)
0 10 20 30 40 50 60
0 0.002 0.004 0.006 0.008 0.01 0.012 0.014 0.016 Time [s]
PSD Displacement [mm
2 Hz
−1
]
[image:40.595.113.496.123.293.2](b)
Figure 24: Simulated response for a dynamically induced snap-through from state 1 to
constant snap-through. Forcing frequency Ω=23.0 Hz. Forcing amplitude Fo=47.5 N. (a)
Displacement time response. (b) Displacement power spectrum. Compare with
experi-mental data in Figs. 19(a) and 19(b).
antiresonance lying in this frequency range is over predicted by the model.
Thus, the model shows a stiffer behaviour of the plate around this frequency
range resulting on a much higher level of forcing required to deflect the plate
past its critical displacement. In addition, a good match is achieved between
the simulated boundaries marking the onset of the subharmonic oscillations
for mode w1 (dashed line) and mode w2 of stable state 2 (doted line) with
the experimental results (shown with ∗ and ◦ markers respectively). As the
force parameter is increased the experimental boundary separating linear
os-cillations in stable state 1 from constant snap-through osos-cillations (solid line
with × markers) is reached, this is compared to the simulated results in the
following.
Figure 28 shows the comparison of the experimental and simulated
0 10 20 30 40 50 60 10−6
10−4 10−2
Time [s]
PSD Displacement [Log(mm
2
Hz
−1
[image:41.595.165.450.238.471.2])]
Figure 25: Simulated power spectrum for the displacement response of a dynamically
induced snap-through from state 1 to constant snap-through showing broadband peaks.
Forcing frequency Ω=23.0 Hz. Forcing amplitudeFo=47.5 N. Compare with experimental
20 25 30 35 40 45 50 0
5 10 15 20 25 30 35
Frequency [Hz]
F
o
rc
e
[N]
Constant snap−through
Linear oscillations state 2
Linear oscillation state 1
Subharmonic oscillations mode1
[image:42.595.173.427.194.405.2]Subharmonic oscillations mode 2
Figure 26: Different dynamic behaviours for oscillations with initial condition in stable
state 2. Four distinctive regions are observed: linear oscillations confined to stable state 2,
subharmonic oscillations of modesws2
1 andws22, linear oscillations confined to stable state
1, and constant snap-through oscillation between stable state 2 and stable state 1. In
addi-tion three experimental and simulated force boundaries separating the regions are shown:
force for snap-through from stable state 2 to state 1 (solid line with ♦markers and solid
line respectively), subhamornic oscillations of mode ws2
1 (∗ markers and dashed line
re-spectively), subhamornic oscillations of modews2
2 (◦markers and dotted line respectively).
The force boundary between oscillations in stable state 1 and constant snap-through is
25 30 35 40 45 50 0
2 4 6 8 10 12 14 16 18 20
Frequency [Hz]
F
o
rc
e
[N]
Exp mode 1 Exp mode 2 Sim mode 1 Sim mode 2 Sim snap force state 1 Exp snap force state 1 Exp snap force constant snap−through
Linear oscillation state 1
Snap-through to state 1
Subharmonic oscillations mode1
Linear oscillations state 2
[image:43.595.168.434.270.488.2]Subharmonic oscillations mode 2
Figure 27: Detail of regions around the subharmonic oscillations showing the dynamic
regions are observed, linear oscillations confined to stable state 1, two regions
of subharmonic resonance of modes ws1
1 and ws
1
2 , and constant snap-through
oscillation between stable state 1 and stable state 2. In this case, for the
experimental (solid line with × markers) and simulated boundaries (solid
line) marking the onset of constant snap-through between stable states only
a qualitative match was achieved. This might be a result of the strong
in-teraction between the plate and the shaker for these levels of excitation.
However, it still provides an indication of the boundary marking the onset of
this dynamic behaviour. As for oscillations starting in state 2, a good match
between the experimental (shown as ∗ and ◦ markers respectively) and
sim-ulated boundary (shown as dashed and dotted lines respectively) marking
the onset of subharmonic oscillations for modes ws1
1 and ws
1
2 of stable state
1 is achieved. Figures 26-28 provide a detailed summary of the rich dynamic
behaviour exhibited by the studied bi-stable structure. As mentioned in
sec-tion 2, due to asymmetries in the bi-stable plates distinct levels of forcing
arise for triggering snap-through from each stable state. This is particularly
advantageous for morphing purposes as perfect orthogonal symmetry
intro-duces difficulties for configuration control, as for any given static or dynamic
actuation load both stable equilibria (each one associated to each state) have
almost the same likeliness to attract the motion of the plate triggering
contin-uous cross-well oscillations. However, for other applications such as energy
harvesting perfect symmetry can be exploited to achieve broadband large
20 25 30 35 40 45 50 0
10 20 30 40 50 60 70 80
Frequency [Hz]
F
o
rc
e
[N]
Subharmonic oscillations mode1
Subharmonic oscillations mode 2 Linear
oscillation state 1
[image:45.595.177.432.210.425.2]Constant snap−through
Figure 28: Complete dynamic behaviour for oscillations starting in stable state 1. Three
distinctive behaviours are observed, linear oscillations confined to stable state 1, two
re-gions of subharmonic resonance of modes ws1
1 and w2s1, and constant snap-through
os-cillation between stable state 1 and stable state 2. In addition three experimental and
simulated force boundaries separating the regions are shown: force for snap-through from
stable state 1 to constant snap-through (solid line with ×markers and solid line
respec-tively), subhamornic oscillations of mode ws1
1 (∗ markers and dashed line respectively),
subhamornic oscillations of modews1
25 30 35 40 45 0
5 10 15 20 25 30 35 40 45
Frequency [Hz]
F
o
rc
e
[N]
Sim mode 1 Sim mode 2 Exp mode 1 Exp mode 2 Sim snap force Exp snap force
Constant snap-through
Subharmonic oscillations mode 2
[image:46.595.159.435.260.490.2]Subharmonic oscillations mode 1
Figure 29: Detail of regions around the subharmonic oscillations showing the dynamic
6. Conclusions
The dynamics for a bi-stable composite plate are experimentally
investi-gated and modelled focusing on oscillations between stable states or
cross-well dynamics. It is shown that the experimental condition to trigger a
snap-through is governed by a displacement threshold that is frequency
de-pendent, defined as the dynamic critical displacement. Experimental results
showed the force required to dynamically trigger snap-through is strongly
related to the linear and nonlinear resonances of the plate. This observation
shows that features of the dynamic response for oscillations confined to a
potential well influence the dynamic response leading to snap-through. This
fact has not been highlighted in previous studies on the dynamics of bi-stable
plates. Additionally, for oscillations involving snap-through between stable
states a complex nonlinear behaviour is observed. In particular, for steady
state oscillations between stable states evidence indicating the characteristics
of a chaotic response is observed.
A simple model extending the results from Ref. [18] including the critical
displacement conditions to account for cross-well dynamics of the bi-stable
plate is developed. A good qualitative match for the cross-well dynamics
of the bi-stable plate is obtained with the model. The snap-through
phe-nomenon is captured, in particular the snap-through force from stable state
2 to stable state 1 is closely matched. Moreover, the model captured the
experimentally observed complex continuous snap-through oscillations from
one state to the other, matching the characteristics of a chaotic response.
trol and actuation strategies both to stabilize a desired state and to achieve
morphing configuration for applications implementing bi-stable composites.
Furthermore, asymmetries in the response of the bi-stable structures could
be designed in other to facilitate morphing and/or impede dynamic
per-turbations. Concerning the critical displacement condition, more research
is needed to shed light onto the actual shape of the unstable equilibrium
through which bi-stable composites dynamically. This is necessary for closer
approximations of the critical displacement condition.
References
[1] R. L. Clark, W. R. Saunders, G. P. Gibbs, Adaptive structures:Dynamics
& Control, John Wiley & Sons, 1998.
[2] R. Maute, G. W. Reich, Integrated multidisciplinary topology
optimiza-tion approach to adaptive wing design, Journal of Aircraft 43 (2006)
253–263.
[3] C. Thill, J. Etches, I. Bond, K. D. Potter, P. M. Weaver, Morphing
skins, Aeronautical Journal 117 (2008) 117–139.
[4] M. L. Dano, M. W. Hyer, Thermally-induced deformation behavior of
unsymmetric laminates, International Journal of Solids and Structures
35 (1998) 2101–2120.
[5] M. Schlecht, K. Schulte, Advanced calculation of the room-temperature
shapes of unsymmetric laminates, Composite Materials 33 (1999) 1472–
[6] S. V. Sokorin, A. V. Terentiev, On modal interaction, stability and
nonlinear dynamics of a model two d.o.f. mechanical system performing
snap-through motion, Nonlinear Dynamics 16 (1998) 239–257.
[7] M. R. Schultz, M. W. Hyer, Snap-through of unsymmetric cross-ply
laminates using piezoceramic actuators, Journal of Intelligent Material
Systems and Structures 14 (2003) 795–814.
[8] K. D. Potter, P. M. Weaver, A concept for the generation of out-of-plane
distortion from tailored frp laminates, Composites Part A: Applied
Science and Manufacturing 35 (2004) 1353–1361.
[9] C. G. Diaconu, P. M. Weaver, F. Mattioni, Concepts for morphing
airfoil sections using bi-stable laminated composite structures,
Thin-Walled Structures 46 (2008) 689–701.
[10] F. Mattioni, P. M. Weaver, K. D. Potter, M. I. Friswell, The application
of residual stress tailoring of snap-through composites for variable sweep
wings, in: 47th AIAA/ASME/ASCE/AHS/ASC Structures, Structural
Dynamics, and Materials Conference.
[11] M. L. Dano, M. W. Hyer, Snap-through of unsymmetric fiber-reinforced
composite laminates, International Journal of Solids and Structures 39
(2002) 175–198.
[12] W. Hufenbach, M. Gude, L. Kroll, Design of multistable composites for
application in adaptive structures, Composites Science and Technology
[13] P. Giddings, C. Bowen, R. Butlera, H. Kim, Characterisation of
actu-ation properties of piezoelectric bi-stable carbon-fibre laminates,
Com-posites Part A: Applied Science and Manufacturing 39 (2008) 697–703.
[14] F. Mattioni, P. M. Weaver, K. D. Potter, M. I. Friswell, Analysis of
ther-mally induced multistable composites, International Journal of Solids
and Structures 45 (2008) 657–675.
[15] M. L. Dano, M. W. Hyer, Sma-induced snap-through of unsymmetric
fiber-reinforced composite laminates, International Journal of Solids and
Structures 40 (2003) 5949–5972.
[16] K. D. Potter, P. M. Weaver, A. A. Seman, S. Shah, Phenomena in
the bifurcation of unsymmetric composite plates, Composites Part A:
Applied Science and Manufacturing 38 (2007) 100–106.
[17] M. R. Schultz, M. W. Hyer, R. B. Williams, W. K. Wilkie, D. J. Inman,
Snap-through of unsymmetric laminates using piezocomposite
actua-tors, Composites Science and Technology 66 (2006) 2442–2448.
[18] A. F. Arrieta, S. Neild, D. Wagg, Nonlinear dynamic response and
modelling of a bi-stable composite plate for applications to adaptive
structures, Nonlinear Dynamics 58 (2009) 259–272.
[19] C. G. Diaconu, P. M. Weaver, A. F. Arrieta, Dynamic analysis of
bi-stable composite plates, Journal of Sound and Vibration 22 (2009)
987–1004.
[20] A. F. Arrieta, F. Mattioni, S. A. Neild, P. M. Weaver, D. J. Wagg, K. D.
applications to adaptive structures, in: 2nd European Conference for
Aero-Space Sciences.
[21] A. Carrella, F. Mattioni, A. A. Diaz, M. I. Friswell, D. J. Wagg, P. M.
Weaver, Static and dynamic analysis of a bistable plate for
applica-tion in morphing structures, in: 7th European conference on structural
dynamics, July 7-9, Southampton, UK.
[22] J. M. T. Thompson, Instabilities and Catastrophes in Science and
En-gineering, John Wiley & Sons, 1982.
[23] A. Pirrera, D. Avitabile, P. M. Weaver, Bistable plates for morphing
structures: A refined analytical approach with high-order polynomials,
International Journal of Solids and Structures 47 (2010) 3412–3425.
[24] O. Thomas, C. Touz´e, E. . Luminais, Non-linear vibrations of
free-edge thin spherical shells: Experiments on a 1:1:2 internal resonance,
Nonlinear Dynamics 49 (2007) 259–284.
[25] A. F. Arrieta, D. J. Wagg, S. A. Neild, Dynamic snap-through for
morphing of bi-stable composite plates, Journal of Intelligent
Mate-rial Systems and Structures published online 21 December 2010. DOI:
10.1177/1045389X10390248 (2010).
[26] A. F. Arrieta, Nonlinear Dynamics and Control of Bi-stable Composites
for Morphing Applications, Ph.D. thesis, University of Bristol, 2009.
[27] A. H. Nayfeh, D. T. Mook, Nonlinear Oscillations, John Wiley & Sons,
[28] B. Balachandran, A. H. Nayfeh, Observations of modal interactions in
resonantly forced beam-mass structures, Nonlinear Dynamics 2 (1991)
77–117.
[29] K. D. Murphy, L. N. Virgin, S. A. Rizzi, Experimental snap-through
boundaries for acoustically excited, thermally buckled plates,
Experi-mental Mechanics 36 (1996) 312–317.
[30] J. M. T. Thompson, H. B. Stewart, Nonlinear Dynamics and Chaos,
John Wiley & Sons, 2002.
[31] A. F. Arrieta, P. Hagedorn, A. Erturk, D. J. Inman, A piezoelectric
bi-stable plate for nonlinear broadband energy harvesting, Applied Physics