Eurostat's collectionsare adapted to the needs of all users. You will find them in each of the nine themes proposed by Eurostat. Our mission is to provide the
European Union
with a high-quality statistical information service1 General statistics
2 Economy and finance
3 Population and social conditions
4 Industry, trade and services
5 Agriculture and fisheries
6 External trade
7 Transport
8 Environment and energy
9 Science and technology
Press releases: key figures on the EU, the Member States and their partners. They are provided free of charge. They are also available on the Internet as soon as they are published.
Statistics in focus: up-to-date summaries of the main results of statistical sur-veys, studies and analyses.
Pocketbooks:the main indicators on a theme or sub-theme in an easy-to-carry booklet.
Panorama of the European Union: highlights the features and trends of a multisectoral theme or a sectoral sub-theme.
Methods and nomenclatures: intended for specialists who want to con-sult the methodologies and nomenclatures used for a theme, a sub-theme or a sector.
Detailed tables: statistical data for specialists compiled on a theme, sub-theme or sector.
Catalogues: free of charge rapid access to concise information on Eurostat´s products and services.
5
2003 EDITION
Data 1990-2002
Eurostat Data Shops
provide a wide range oftailor-made services:
★ immediate information searches, ★ rapid and personalised response, ★ choice of data carrier.
Information can be requested by phone, mail, fax or e-mail.
I n t e r n e t
Essentials on Community statistical news:
★ euro indicators: more than 100 indicators on the euro zone;
harmonised, comparable, and free of charge,
★ press releases: direct access to all Eurostat press releases.
For further information, visit us on the Internet: www.europa.eu.int/comm/eurostat/
Immediate access to
harmonised statistical data
A great dealof addi tionalinf o rm ati o n on the European U nion i s avai labl e on the Internet.
It can be accessed through the Europa server (http://europa.eu.int).
C atal oguing data can be f ound at the end of this publi c ati on.
Luxem bourg:O ffi c e for O fficialP ubl ications of the E urope an C om m uni ties,2003
IS BN 92)894)4735)4
Europe Direct is a service to help you find answers to your questions about the European Union
New freephone number:
EUROSTAT
L-2920 Luxembourg — Tel. (352) 43 01-1 — Telex COMEUR LU 3423
Eurostat is the Statistical Office of the European Communities. Its task is to provide the European Union with statistics, at a European level, that allow comparisons to be made between countries and regions. Eurostat consolidates and harmonises the data collected by the Member States.
To ensure that the vast quantity of accessible data is made widely available and to help each user make proper use of the information, Eurostat has set up a publications and services programme.
This programme makes a clear distinction between general and specialist users and particular collections have been developed for these different groups. The collections Press releases, Statistics in focus, Panorama of the European Union, Pocketbooksand Cataloguesare aimed at general users. They give immediate key information through analyses, tables, graphs and maps.
The collections Methods and nomenclaturesand Detailed tablessuit the needs of the specialist who is prepared to spend more time analysing and using very detailed information and tables.
All Eurostat products are disseminated through the Data Shop network or the sales agents of the Office for Official Publications of the European Communities. Data Shops are available in 13 of the 15 Member States as well as in Switzerland, Norway and the United States of America. They provide a wide range of services from simple database extracts to tailor-made investigations. The information is provided on paper and/or in electronic form via e-mail, on diskette or on CD-ROM.
As part of the new programme, Eurostat has developed its web site. It includes a broad range of online information on Eurostat products and services, newsletters, catalogues, online publications and indicators on the euro zone.
Introduction
The aim of this pocketbook is to present updated information on the forest sector in the EU, EFTA and candidate countries. It should not be seen as an exhaustive collection of all available data but may be considered a compendium of the most relevant Eurostat data sets concerning the Forest Sector. To provide the reader with a broader view of this sector, this publication contains useful information produced and usually published by other international organisations involved in the collection and analysis of data on forests and related subjects.
Data on forest resources have thus been taken from a previous publication of the UNECE, while JRC has provided forest maps and additional information on forest resources, as well as the whole chapter on forest fires. In addition, the chapter on forest condition was drawn up by ICP forests.
This pocketbook is divided into two main parts. The first gives a general description of forest resources, forest ownership, forest condition, employment in the forest sector, the contribution of this sector to national GDP formation and the share of energy produced using woody material.
The second part is devoted to the production and trade of wood and wood products and is based on data from the Joint Forest Sector Questionnaire, which is the result of cooperation among Eurostat, UNECE, FAO and ITTO. This section of the pocketbook also contains supply balance sheets concerning the production and trade of wood, wood-based panels, paper and paperboard.
Table of Contents
I. General Description of Forest Sector
1. Forest Resources and Ownership 7
Principal area categories, 2000 11
Forest and other wooded land 14
Volume of the growing stock 16
Increment, fellings and removals 18
Ownership of forest available for wood supply 20
2. Economy 23
Percentage of gross value added of the Forest
Sector, 1995 27
Percentage of gross value added at basic prices for agriculture as a whole and for NACE divisions
regarding the Forest Sector 28
3. Employment 31
Employment in the Forest Sector, 2002 32 Employment in manufacturing of wood and pulp
compared with all sectors and manufacturing
as a whole, 2002 33
Employment in forestry compared with all sectors
and agriculture, 2002 34
Employment in all sectors, industry, agriculture and in related branches of the Forest Sector 35
4. Energy 39
Share of primary energy produced from wood and
wood waste 40
Share of final consumption of energy produced from
wood and wood waste 41
Share of final consumption of energy from wood and wood waste at household level 42
II. Production and trade on wood and wood products
1. Removals 57
Removals of roundwood by coniferous and
non-coniferous species 59
Removals by roundwood category 60
Removals by forest ownership category 61
Removals of Industrial roundwood 63
2. Supply Balance Sheets 65
Supply balance sheet for roundwood 66
Supply balance sheet for sawnwood 68
Supply balance sheet for wood based panels 71
Supply balance sheet for pulp 72
Symbols and abbreviations
symbols
: no data available
. not applicable
0 figure less than half of the unit used
- nil (zero)
% percentage
units of measurements
d.b.h. (diameter at breast height, 1.3 m) ha hectare
m metre
m3 cubic metre
m3 o.b. cubic metre, overbark
mt metric tonne
country abbreviations (EU)
EU15 fifteen Member States of the EU B Belgium
DK Denmark D Germany EL Greece E Spain F France IRL Ireland I Italy
L Luxembourg NL Netherlands A Austria P Portugal FIN Finland S Sweden
UK United Kingdom
other countries
LT Lithuania HU Hungary PL Poland SI Slovenia SK Slovakia BG Bulgaria RO Romania TR Turkey CA Canada
RU Russian Federation
US United States
other abbreviations
EFI European Forest Institute
EFFIS European Forest Fire Information
System
EFTA European Free Trade Association
FAO Food and Agricultural Organisation of
the United Nations
FOWL Forest and other wooded land
FRA Forest Resources Assessment(s)
ICP Forests International Cooperative Programme of Assessment and Monitoring of Air Pollution Effects on Forests
ITTO International Tropical Timber
Organisation
JRC Joint Research Centre
NACE
Activités économiques dans la Communauté Européenne" - Statistical classification of economic activities in the European Community
NOAA National Oceanic and Atmospheric
Administration
OSB Oriented Standard Board
TBFRA Temperate and Boreal Forest
Resources Assessment(s) UNE CE (ECE) United Nations Economic
1. Forest Resources and Ownership
This chapter provides a brief overview of forest resources and their development in the 1990s. The information in this chapter is based on the final results of the Temperate and Boreal Forest Resources Assessment (TBFRA) 2000, which is the latest in a series of surveys of the temperate and boreal countries carried out every ten years by ECE and FAO. TBFRA 2000 is a part of the global Forest Resources Assessment (FRA) process led by the FAO Forestry Department.
The TBFRA process covers the whole ECE region, thus including the EU Member States, the other EEA countries, Switzerland and the candidate countries. The terms used for the TBFRA have all been agreed internationally and the principal forest resource definitions are as follows:
Forest is defined as land with tree crown cover (or equivalent stocking level) of more than 10% and area of more than 0.5 ha. The trees should be able to reach a minimum height of 5 m at maturity in situ. It may consist either of closed forest formations where trees of various storeys and undergrowth cover a high proportion of the ground; or of open forest formations with a continuous vegetation cover in which tree crown cover exceeds 10%. Young natural stands and all plantations established for forestry purposes which have yet to reach a crown density of 10% or a tree height of 5 m are included under forest, as they are areas normally forming part of the forest area which are temporarily unstocked as a result of human intervention or natural causes but which are expected to revert to forest.
Forest available for wood supply is forest where any legal, economic, or specific environmental restrictions do not have a significant impact on the supply of wood. This includes areas where, although there are no such restrictions, harvesting is not taking place, e.g. areas included in long-term utilisation plans or intentions.
Forest not available for wood supply is forest where legal, economic or specific environmental restrictions prevent any significant supply of wood.
Growing stock is the living tree component of the standing volume.
Standing volume is the volume of standing trees, living or dead, above-stump, measured overbark to top. This includes all trees with diameter over 0 cm (d.b.h., diameter at breast height).
Net annual increment is defined as average annual volume over the given reference period of gross increment, less that of natural losses on all trees to a minimum diameter of 0 cm (d.b.h.).
The relation of annual fellings to annual removals is the following:
Annual fellings are the average annual standing volume of all trees, living or dead, measured overbark to a minimum diameter of 0 cm (d.b.h.), that are felled during the given reference period, including the volume of trees or parts of trees that are not removed from the forest, other wooded land or other felling site. It includes silvicultural and pre-commercial thinnings and cleanings left in the forest; and trees killed or damaged by natural causes, e.g. fire, windblow, insects and diseases (natural losses) that are recovered (harvested).
Private ownership: Forest and other wooded land owned by individuals, families, cooperatives and corporations which may be engaged in agriculture or other occupations as well as forestry; private forest enterprises and industries; private corporations and other institutions (religious and educational institutions, pension and investment funds, nature conservation societies, etc).
Public ownership: Forest and other wooded land belonging to the State or other public bodies. This comprises forest and other wooded land owned by national, state and regional governments, or by government-owned corporations.
Forest holding means one or more parcels of forest and other wooded land which constitute a single unit from point of view of management or utilisation. Under any category of ownership, other than state-owned, one holding may be the property of one or more owners.
Principal area categories, 2000
0% 10% 20% 30% 40% 50% 60% 70% 80% 90% 100%
EU-15
B
DK
D
EL
E
F
IRL
I
L
NL
A
P
FIN
S
UK
IS
LI
NO
CH
CZ
EE
CY
LV
LT
H
MT
PL
SI
SK
BG
RO
TR
Principal area categories, 2000
Total area Inland waters
Total land area
(1000 ha) (1000 ha) (1000 ha) (1000 ha) (%)
EU-15 323,963 12,111 311,852 136,204 43.68
B 3,053 22 3,030 672 22.17
DK 4,309 70 4,239 538 12.70
D 35,702 1,089 34,613 10,740 31.03
EL 13,196 120 13,076 6,513 49.81
E 50,596 541 50,055 25,984 51.91
F 54,919 771 54,148 16,989 31.38
IRL 7,029 139 6,890 591 8.58
I 30,132 720 29,412 10,842 36.86
L 259 1 258 89 34.35
NL 3,735 347 3,388 339 10.01
A 8,387 135 8,252 3,924 47.55
P 9,204 99 9,105 3,467 38.08
FIN 33,814 3,360 30,454 22,768 74.76
S 45,218 4,375 40,843 30,259 74.09
UK 24,410 322 24,088 2,489 10.33
IS 10,295 1,271 9,024 130 1.44
LI 16 0 16 7 46.25
NO 32,376 1,751 30,625 12,000 39.18
CH 4,129 213 3,916 1,234 31.51
CZ 7,887 159 7,728 2,630 34.03
EE 4,523 336 4,187 2,162 51.64
CY 925 9 916 280 30.57
LV 6,459 237 6,222 2,995 48.14
LT 6,530 263 6,267 2,050 32.71
HU 9,303 210 9,093 1,811 19.92
MT 32 0 32 0 1.10
PL 31,268 833 30,435 8,942 29.38
SI 2,027 11 2,016 1,166 57.84
SK 4,903 93 4,810 2,031 42.22
BG 11,098 202 10,895 3,903 35.83
RO 23,839 890 22,949 6,680 29.11
TR 77,945 1,216 76,729 20,713 27.00
CA 997,061 75,518 921,543 417,584 45.31
RU 1,709,761 72,028 1,637,733 886,538 54.13
US 980,963 65,022 915,941 298,135 32.55
Forest and other wooded land (FOWL)
Principal area categories, 2000 (cont.)
FOWL/ capita (1000 ha) (%) (1000 ha) (%) ha/capita
EU-15 126,045 40.4 49,603 15.9 0.36
B 1,383 45.6 976 32.2 0.07
DK 2,689 63.4 1,013 23.9 0.10
D 17,160 49.6 6,713 19.4 0.13
EL 3,499 26.8 3,064 23.4 0.61
E 22,984 45.9 1,087 2.2 0.66
F 28,331 52.3 8,828 16.3 0.29
IRL 4,342 63.0 1,957 28.4 0.16
I 14,833 50.4 3,737 12.7 0.19
L 127 49.1 43 16.5 0.21
NL 2,011 59.3 1,038 30.7 0.02
A 3,415 41.4 913 11.1 0.48
P 3,822 42.0 1,816 19.9 0.35
FIN 2,172 7.1 5,514 18.1 4.42
S 3,109 7.6 7,475 18.3 3.41
UK 16,169 67.1 5,430 22.5 0.04
IS 143 1.6 8,751 97.0 0.47
LI : : 9 56.3 0.23
NO 1,023 3.3 17,602 57.5 2.72
CH 1,083 27.7 1,599 40.8 0.17
CZ 4,276 55.3 822 10.6 0.26
EE 1,454 34.7 571 13.6 1.51
CY 148 16.2 488 53.3 0.36
LV 2,540 40.8 687 11.0 1.24
LT 3,513 56.1 704 11.2 0.55
HU 6,122 67.3 1,160 12.8 0.18
MT 13 41.1 18 57.8 0.00
PL 18,707 61.5 2,786 9.2 0.23
SI 788 39.1 62 3.1 0.59
SK 2,446 50.9 333 6.9 0.38
BG 6,159 56.5 833 7.6 0.47
RO 14,798 64.5 1,471 6.4 0.30
TR 40,149 52.3 15,867 20.7 0.33
CA 450,725 48.9 53,234 5.8 13.66
RU 219,609 13.4 531,586 32.5 6.01
US 420,250 45.9 197,556 21.6 1.09
Source : TBFRA
Forest and other wooded land
Forest land Other
wooded land Total
(±1000ha)
EU-15 113,567 22,637 136,204
-B 1997 646 26 672 -1
DK 1990 445 93 538 1
D 1987 10,740 0 10,740 22
EL 1992 3,359 3,154 6,513 30
E 1990 13,509 12,475 25,984 86
F 1997 15,156 1,833 16,989 62
IRL 1996 591 0 591 17
I 1995 9,857 985 10,842 30
L 1994–97 86 3 89 0
NL 1992–96 339 0 339 1
A 1992–96 3,840 84 3,924 8
P 1995 3,383 84 3,467 57
FIN 1991–96 21,883 885 22,768 8
S 1992–96 27,264 2,995 30,259 1
UK 1995 2,469 20 2,489 20
IS 1998 30 100 130 1
LI 1995 7 1 7 0
NO 1994–96 8,710 3,290 12,000 31
CH 1993–95 1,173 61 1,234 4
CZ 1995 2,630 0 2,630 1
EE 1996 2,016 146 2,162 13
CY 1996 117 163 280 0
LV 1997 2,884 111 2,995 13
LT 1996 1,978 72 2,050 5
HU 1996 1,811 0 1,811 7
MT 1996 0 0 0 0
PL 1992–96 8,942 0 8,942 11
SI 1996 1,099 67 1,166 2
SK 1996 2,016 15 2,031 7
BG 1995 3,590 314 3,903 20
RO 1995–97 6,301 379 6,680 15
TR 1996 9,954 10,759 20,713 46
CA 1994 244,571 173,013 417,584 0
RU 1993 816,538 70,000 886,538 -1,090
US 1992 217,333 80,802 298,135 588
Source: TBFRA
Average annual change of forest land
(1000 ha) Reference
period
Forest and other wooded land (cont.)
Total Percent of total forest
(1000 ha) (%) (±1000ha)
EU-15 95,525 84.11
-B 639 98.97 -1
DK 440 98.86 1
D 10,142 94.43 21
EL 3,094 92.11 28
E 10,479 77.57 41
F 14,470 95.47 37
IRL 580 98.14 17
I 6,013 61.00 19
L 86 100.00 0
NL 314 92.63 2
A 3,352 87.29 4
P 1,897 56.07 5
FIN 20,675 94.48 -47
S 21,236 77.89 -10
UK 2,108 85.38 17
IS 14 46.67 1
LI 4 57.97 0
NO 6,609 75.88 8
CH 1,060 90.37 6
CZ 2,559 97.30 1
EE 1,932 95.83 11
CY 43 36.92 0
LV 2,413 83.67 17
LT 1,686 85.24 3
HU 1,702 93.98 3
MT 0 0.00 0
PL 8,300 92.82 -11
SI 1,035 94.18 2
SK 1,706 84.62 1
BG 3,124 87.02 -10
RO 5,617 89.14 -19
TR 8,635 86.75 -4
CA 125,863 51.46 0
RU 525,191 64.32 -9,558
US 198,123 91.16 505
Source: TBFRA
Forest available for wood supply Average annual change of forest available for wood
Volume of the growing stock
Reference Period 1
Reference Period 2
Average annual change (±1000m³ o.b./year)
EU-15 : 14,817,261
-B 1982 1997 122,047 141,033 1,266
DK 1980 1990 43,200 55,200 1,200
D 1961 1987 : 2,880,000 35,000
EL : 1992 : 151,788 :
E 1970 1990 456,721 594,111 6,870
F 1987 1997 2,538,961 2,891,777 35,282
IRL 1987 1996 25,000 42,000 1,700
I 1985 1995 712,447 1,428,742 71,630
L 1985 1997 20,377 20,217 160
NL 1988–92 199–95 52,191 54,209 672
A 1986–90 1992–96 1,080,121 1,097,307 2,864
P 1985 1995 201,021 275,760 7,474
FIN 1980–89 1991–96 1,753,000 1,940,000 19,700 S 1985–89 1992–96 2,715,115 2,928,117 30,429
UK 1980 1995 241,000 317,000 5,067
IS 1,990 1998–98 760 800 5
LI 1,975 1995 1,570 1,750 9
NO 1980–86 1994–96 621,332 771,448 11,547
CH 1983–85 1993–95 361,286 395,450 3,383
CZ 1986 1995 639,873 683,806 4,393
EE 1988 1996 259,680 314,537 6,857
CY 1981 1991 : : 40
LV 1988 1997 432,000 502,000 7,000
LT 1987 1996 326,820 362,637 3,582
HU 1990 1996 288,004 314,667 4,443
MT : 1996 : 80 :
PL 1987–91 1992–96 1,797,258 1,908,019 22,152
SI 1986 1996 208,500 310,577 10,208
SK 1988 1996 413,945 510,948 12,125
BG 1985 1995 404,800 467,345 6,255
RO : : :
TR 1963–72 1973–96 1,044,602 1,349,323 12,697 CA 1980 1994 28,294,000 29,364,059 76,400 RU 1988 1993 86,053,552 85,486,752 -113,360 US 1987 1992 28,754,000 29,656,000 180,400
Source: TBFRA Reference
Period 1
Reference Period 2
Volume of the growing stock (cont.)
Reference Period 1
Reference Period 2
Average annual change
Per hectare, Period 2
(±1000m³
o.b./year) (m³/ha)
EU-15 : 13,419,213 - 140
B 121,245 139,835 1,239 219
DK 43,200 55,200 1,200 123
D : 2,820,000 35,000 278
EL : 139,800 : 45
E 411,049 486,815 3,788 47
F 2,489,756 2,835,655 34,590 196
IRL 24,000 41,000 1,700 74
I 557,000 876,744 31,974 146
L 20,377 20,217 160 238
NL 50,070 52,088 672 166
A 1,020,121 1,037,307 2,864 310
P 144,153 188,020 4,386 99
FIN 1,713,000 1,867,000 16,200 90
S 2,389,748 2,566,532 25,255 121
UK 217,000 293,000 5,067 139
IS 338 370 4 26
LI 1,260 1,400 7 350
NO 534,717 671,412 10,515 102
CH 320,605 354,050 3,311 333
CZ 622,717 668,242 4,552 261
EE 249,230 307,120 7,236 159
CY 3,123 3,055 -7 71
LV 354,240 409,260 5,502 170
LT 271,260 314,355 4,309 187
HU 274,189 295,301 3,519 174
MT : 0 : :
PL 1,690,298 1,771,042 16,149 213
SI 202,200 292,491 9,029 283
SK 368,204 445,547 9,668 261
BG 349,747 401,141 5,139 128
RO : : : :
TR 1,032,352 1,187,309 6,457 138
CA 16,722,000 17,354,560 45,200 138
RU 61,768,856 60,922,156 -169,340 116
US 26,225,000 27,035,000 162,000 137
Source: TBFRA
On forest available for wood supply
Increment, fellings and removals
Conifer. Non-conifer. Total Per hectare (1000 m³
o.b./ha)
EU-15 308,420 150,419 459,506
-B 1982–97 3,359 1,778 5,137 8.0
DK 1990 2,200 1,000 3,200 7.3
D 1995–2002 63,521 25,477 88,998 8.8
EL 1992 1,760 1,760 3,520 1.1
E 1990 16,686 11,903 28,589 2.7
F 1997 39,538 52,761 92,299 6.4
IRL 1996 3,400 50 3,450 6.0
I 1995 6,112 12,601 18,713 3.1
L 1985–97 : : 667 7.8
NL 1991–95 1,128 1,077 2,205 7.0
A 1992–96 21,926 5,411 27,337 8.2
P 1995 7,890 5,010 12,900 6.8
FIN 1991–96 56,646 15,824 72,470 3.5
S 1992–96 71,514 13,917 85,431 4.0
UK 1995 12,740 1,850 14,590 6.9
IS 1998 32 5 37 2.6
LI 1995 12 6 18 4.5
NO 1994–96 17,512 4,529 22,041 3.3
CH 1985–95 5,341 2,814 8,155 7.7
CZ 1995 17,083 3,272 20,355 8.0
EE 1996 4,065 3,072 7,137 3.7
CY 1980–90 44 0 44 1.0
LV 1996 6,420 4,630 11,050 4.6
LT 1996 5,266 3,238 8,504 5.0
HU 1996 1,568 8,357 9,925 5.8
MT 1996 0 0 0 :
PL 1992–96 33,066 6,370 39,436 4.8
SI 1996 2,901 3,231 6,132 5.9
SK 1996 5,842 6,495 12,337 7.2
BG 1995 5,028 5,209 10,236 3.3
RO 1984 : : : :
TR 1996 19,658 12,861 32,519 3.8
CA 1994 158,280 69,200 227,480 1.8
RU 1993 464,000 278,000 742,000 1.4
US 1987–92 386,000 308,000 694,000 3.5
Source: TBFRA Reference
Increment, fellings and removals (cont.)
Conifer.
Non-conifer. Total Conifer. Non-conifer. Total
EU-15 216,032 83,498 299,530 184,923 69,734 254,657 B 1986–95 3,150 1,250 4,400 3,150 1,250 4,400 DK 1996 1,468 726 2,194 1,468 726 2,194 D 1996 37,179 11,405 48,584 29,743 9,124 38,867
EL 1992 : : : 625 1,783 2,408
E 1994 6,577 4,451 11,028 : : :
F 1996 31,180 28,994 60,174 22,910 24,701 47,611 IRL 1996 2,295 35 2,330 2,295 35 2,330
I 1995 1,824 6,922 8,746 1,682 6,699 8,381
L 1992–94 : : : 180 180 360
NL 1991–95 950 488 1,438 836 383 1,219
A 1992–96 16,132 3,389 19,521 14,308 2,613 16,921 P 1995 6,200 5,000 11,200 6,100 4,900 11,000 FIN 1991–96 43,500 10,800 54,300 40,800 8,700 49,500
S 1992–96 57,277 8,838 66,115 53,526 7,740 61,266 UK 1995 8,300 1,200 9,500 7,300 900 8,200
IS 1996 0 0 0 0 0 0
LI 1995 12 4 16 10 4 14
NO 1994–96 10,291 1,341 11,632 9,673 1,207 10,880 CH 1985–95 5,121 1,955 7,076 4,405 1,681 6,086 CZ 1995 14,810 1,390 16,200 11,926 1,096 13,022
EE 1996 : : : : : :
CY 1986–95 50 0 50 48 0 48
LV 1996 3,610 2,960 6,570 3,250 2,230 5,480
LT 1992–96 3,410 1,830 5,240 2,900 1,550 4,450 HU 1996 777 5,103 5,880 597 4,577 5,174
MT 1996 0 : : 0 : :
PL 1992–96 23,235 7,297 30,532 18,895 6,418 25,313
SI 1996 1,500 800 2,300 1,500 800 2,300 SK 1996 4,200 2,900 7,100 3,300 2,100 5,400 BG 1995 1,772 3,080 4,852 1,263 2,024 3,887
RO 1993–97 : : : : : :
TR 1996 9,843 7,537 17,380 9,457 6,753 16,210
CA 1995 : : : 179,900 34,228 214,128
RU 1995 89,300 36,200 125,500 : : :
US 1992 353,000 170,000 523,000 318,000 134,000 452,000
Source: TBFRA
Forest available for wood supply
Annual fellings Annual removals
Reference period
Ownership of forest available for wood supply
Total State Other
EU-15 25,351 14,930 10,422
B 1997 276 69 207
DK 1990 140 118 22
D 1987 5,406 3,390 2,016
EL 1992 2,404 2,032 372
E 1985-95 1,931 39 1,892
F 1995-97 3,787 1,467 2,320
IRL 1996 380 380 0
I 1995 2,044 372 1,672
L 1994-97 40 10 31
NL 1992-96 160 115 45
A 1992-96 550 460 90
P 1995 200 25 175
FIN 1991-96 5,164 5,164 0
S 1992-96 1,904 404 1,500
UK 1995 965 885 80
IS 1985 4 4 0
LI 1995 4 0 4
NO 1989 853 664 189
CH 1993-95 700 10 690
CZ 1996 2,141 1,826 315
EE 1996 1,757 1,752 5
CY 1996 43 43 0
LV 1997 1,333 1,237 96
LT 1997 1,391 1,386 5
HU 1996 1,079 1,070 9
MT 1996 0 0 0
PL 1992-96 6,806 6,730 76
SI 1996 310 285 25
SK 1996 969 725 244
BG 1995 3,124 3,124 0
RO 1990 5,283 5,283 0
TR 1996 8,620 8,620 0
CA 1994 104,370 104,215 155
RU 1993 525,191 525,191 0
US 1992 53,215 39,115 14,100
Source: TBFRA
(1000 ha) In public ownership Reference
In private ownership
Total Individuals Industries Other
EU-15 70,175 55,447 10,355 4,373
B 364 352 1 10
DK 301 200 0 100
D 4,736 4,736 0 0
EL 690 529 0 161
E 8,548 8,000 48 500
F 10,683 8,983 0 1,700
IRL 200 200 0 0
I 3,969 3,917 52 0
L 46 : 0 46
NL 154 65 0 89
A 2,802 2,315 0 487
P 1,697 1,497 200 0
FIN 15,511 12,936 1,613 962
S 19,332 10,916 8,416 :
UK 1,143 800 25 318
IS 10 10 0 0
LI 1 1 0 0
NO 5,756 5,123 261 372
CH 360 321 0 39
CZ 418 418 0 0
EE 175 170 0 5
CY 0 0 0 0
LV 1,080 1,080 0 0
LT 295 295 0 0
HU 623 69 0 554
MT 0 0 0 0
PL 1,493 1,460 0 33
SI 725 725 0 0
SK 737 308 0 429
BG 0 0 0 0
RO 334 334 0 0
TR 15 14 0 1
CA 20,853 17,126 3,727 0
RU 0 0 0 0
US 141,761 105,745 28,513 7,503
Source: TBFRA
(1000 ha)
Forest and other wooded land
0% 20% 40% 60% 80% 100%
EU-15
B
DK
D
EL
E
F
IRL
I
L
NL
A
P
FIN
S
UK
IS
LI
NO
CH
CZ
EE
CY
LV
LT
HU
MT
PL
SI
SK
BG
RO
TR
2. Economy
NACE Rev.1 ("Nomenclature statistique des Activités économiques dans la Communauté Européenne" - Statistical classification of economic activities in the European Community) was adopted in order to establish a common statistical classification of economic activities within the European Community in order to ensure comparability between national and Community classifications and hence national and Community statistics.
NACE Rev. 1 contains 17 Sections - letters A to Q
31 Subsections - 2-character alphabetical codes 60 Divisions - 2-digit codes
222 Groups - 3-digit codes 503 Classes - 4-digit codes
Agriculture, hunting and forestry
(Section A) covers the exploitation of vegetable and animal natural resources. The section comprises the activities of growing crops, raising animals, harvesting timber, and harvesting other plants and animals from farms or their natural habitats.
Agriculture, hunting and related service activities
(Division 01) first of all distinguishes two basic activities
• Production of crop products and • Production of animal products.
classification of integrated activities, a unit processing its own agricultural production on the farm is classified as 01, even though the output is normally the product of divisions 15 and 16. Examples are
• Growing of grapes and production of wine from these • Growing of olives and production of olive oil from these.
The division excludes field construction.
Forestry, logging and related service activities
(Division 02) covers the production of standing timber as well as the extraction and gathering of wild growing forest materials. Besides the production of timber, forestry results in products which undergo little processing, such as wood for fuel or industrial use (e.g. pit-props, pulpwood, etc).
Further processing of wood beginning with sawmilling and planing of wood and generally done away from the logging area is classified as Manufacture of wood and wood products (division 20), while production of charcoal is classified under division 24.
Forestry and logging
(Class 02.01) includes:
• Growing of standing timber: planting, replanting, transplanting, thinning and conserving of forests and timber tracts
• Growing of coppice and pulpwood • Operation of forest tree nurseries • Growing of Christmas trees
• Logging: felling of timber and production of wood in the rough such as pit-props, split poles, pickets or fuel wood
Forestry and logging related service activities
Class 02.02 includes:
• Forestry service activities: forestry inventories, timber evaluation, fire protection
• Logging service activities: transport of logs within the forest
Manufacturing
(Section D) The manufacturing activity is the mechanical, physical or chemical transformation of materials, substances or components into new products. The materials, substances or components transformed are raw materials that are products of agriculture, forestry, fishing, mining or quarrying, as well as products of other manufacturing activities.
Assembly of the component parts of manufactured products is considered manufacturing, except in cases where the activity is appropriately classified in any class of division 45 (Construction).
Manufacture of wood and of products of wood and cork, except furniture; manufacture of articles of straw and plaiting materials
It does not include either the manufacture of furniture or the installation of not self-manufactured wooden fittings and the like.
Manufacture of pulp, paper and paper products
Forestry, logging and related
services
Manufacture of wood and
products
Manfacture of pulp, paper and
products
Total
B 0.07 0.30 1.60 1.97
EL 0.14 0.40 0.80 1.34
F 0.29 0.31 1.63 2.23
I 0.05 0.60 1.40 2.05
L 0.10 0.10 0.90 1.10
P 0.79 0.93 2.24 3.96
FIN 2.56 1.30 6.70 10.56
S 1.30 0.90 4.10 6.30
Source: Eurostat / New Cronos
Agriculture, hunting and forestry Forestry, logging and related services
1990 1995 2000 2001 1990 1995 2000 2001
B 1.60 1.30 1.40 0.07 0.05
DK 4.10 3.40 2.50 2.70
D 1.27 1.15
EL 9.90 9.50 7.00 0.22 0.14 0.08
E 3.30 3.20
F 3.55 0.27 0.29
IRL
I 3.30 3.10 2.70 2.60 0.05 0.05 0.04
L 1.10 0.70 0.10
NL 4.20 3.40 2.60 2.60 0.02 0.01 0.01
A 3.60 2.50 2.20 2.30
P 7.90 4.94 1.24 0.79 0.74 0.70
FIN 6.30 4.30 3.60 3.30 2.81 2.56 2.29 2.07
S 2.60 1.90 1.30 0.82
UK 1.80 1.80 1.00 0.90
IS 2.47 2.14
NO 2.70 1.80
CZ 8.08 4.64 4.27 4.31
EE 8.14 5.85 5.42
CY 5.09 p 3,57 p 3,83
LV 21.08 9.48 4.47 4.51 LT 26.36 11.70 7.89 7.11
HU 6.73 4.26 4.28
MT
PL 6.87 3.55 3.72
SI 5.50 4.52 3.40 3.25
SK 5.95 4.71 4.49
BG 13.79
RO 23.16 21.42 12.36 14.22 TR 16.52 14.62 13.20 10.94
Source: Eurostat / New Cronos
Manufacture of wood and products Manfacture of pulp, paper and products
1990 1995 2000 2001 1990 1995 2000 2001
B 0.30 0.30 0.30 1.60 1.50 1.50
DK 0.40 0.50 0.50 0.40 2.00 1.80 1.70 1.80
D 0.52 0.43 1.69 1.75
EL 0.60 0.40 0.30 0.90 0.80 0.80
E 0.50 0.40 1.60 1.60
F 0.36 0.31 1.74 1.63
IRL
I 0.60 0.60 0.60 1.50 1.40 1.40 1.40
L 0.10 0.20 0.90 0.90
NL 0.20 0.20 0.20 0.20 2.30 2.20 2.00 2.00 A 1.00 1.00 1.00 1.00 1.80 1.80 2.00 2.00
P 1.19 0.93 2.71 2.24
FIN 1.40 1.30 1.20 0.90 4.70 6.70 6.00 5.40
S 0.90 0.90 4.10 3.50
UK 0.40 0.30 0.30 0.30 2.60 2.70 2.50 2.40
IS 0.40 0.32 1.73 1.71
NO 0.60 0.50 2.10 2.30
CZ 0.63 0.79 0.95 2.54 1.46 1.67
EE
CY 0.69 0.87
LV
LT 0.87 1.43 1.82 1.03 1.43 1.61
HU 0.58 0.48 0.41 1.30 1.27 1.37
MT PL SI
SK 0.88 2.24
BG
RO 1.76 1.90 2.13 0.87 0.68 0.91
TR
Source: Eurostat / New Cronos
3. Employment
In general a labour force survey is an enquiry directed towards households, designed to obtain information on the labour market and related topics. As it would clearly involve considerable expense to include all households or individuals (as in population censuses), labour force surveys are usually confined to a sample of households, the actual size of which depends primarily on the level of detail required in the survey estimates.
Labour Force Survey conducted accordance with Council Regulation (EC) No 577/1998.
Sampling error
As with any sample survey, the results of the labour force survey are subject to sampling error. It is almost certain that somewhat different figures would have been obtained if a complete census had been carried out using the same questionnaires, interviewers, supervisors, data-processing techniques, etc, as were used in this survey. This difference is known as the ‘sampling error’ of the estimate.
(Thousands of people)
Forest Sector
Total % All Sect.
EU 15 162,974 256 1,004 677 1,937 1.19
B 4,052 . 25 20 46 1.13
DK 2,741 . 10 9 21 0.77
D 36,275 42 217 150 409 1.13
EL 3,949 9 27 8 44 1.11
E 16,241 34 125 43 202 1.24
F 23,885 40 116 92 249 1.04
IRL 1,750 . 8 4 14 0.81
I 21,757 44 182 105 331 1.52
L 188 . . . . .
NL 8,176 . 20 27 48 0.59
A 3,734 6 28 17 51 1.37
P 5,133 15 77 13 106 2.06
FIN 2,406 21 32 44 97 4.04
S 4,348 19 40 41 99 2.28
UK 28,338 18 96 105 219 0.77
IS 156 . . . . .
NO 2,293 5 18 10 33 1.45
CH 3,959 7 39 11 56 1.42
CZ 4,763 43 75 26 145 3.05
EE 581 8 20 . 30 5.08
CY 315 1 2 . 3 1.08
LV 987 34 39 . 75 7.55
LT 1,421 7 28 . 37 2.61
HU 3,846 18 38 14 70 1.81
PL 13,820 : : : : :
SI 922 4 14 7 25 2.71
SK 2,111 24 35 12 71 3.35
BG 2,800 21 22 12 54 1.94
RO ; 43 129 23 195 2.00
Source: Eurosat / New Cronos
Employment in the Forest Sector, 2002
Manifacture of wood and pulp
1000 % %
people All Sectors Manufacturing
EU 15 1,681 1.03 5.39
B 45 1.11 6.06
DK 19 0.69 4.29
D 367 1.01 4.29
EL 35 0.89 6.48
E 168 1.04 5.61
F 209 0.87 4.90
IRL 12 0.67 4.14
I 287 1.32 5.82
L . . .
NL 47 0.57 4.52
A 45 1.21 6.18
P 91 1.77 8.59
FIN 76 3.15 16.01
S 80 1.85 11.11
UK 201 0.71 4.54
IS . . .
NO 28 1.21 9.52
CH 50 1.25 7.85
CZ 102 2.13 7.63
EE 22 3.75 17.05
CY 3 0.84 6.88
LV 41 4.13 24.69
LT 30 2.12 11.91
HU 52 1.35 5.44
PL : : :
SI 21 2.30 7.40
SK 47 2.23 8.27
BG 33 1.20 5.02
RO ; 1.55 7.22
Source: Eurostat / New Cronos
Forestry
1000 % %
people All Sect. Agriculture
EU 15 255.9 0.16 3.91
B . . .
DK . . .
D 42.1 0.12 4.66
EL 8.9 0.23 1.43
E 33.7 0.21 3.50
F 40.1 0.17 4.06
IRL . . .
I 43.9 0.20 4.10
L . . .
NL . . .
A 6.2 0.17 2.91
P 14.9 0.29 2.33
FIN 21.4 0.89 16.12
S 18.9 0.43 17.25
UK 18.3 0.06 4.69
IS . . .
NO 5.5 0.24 6.07
CH 6.6 0.17 3.94
CZ 43.4 0.91 18.72
EE 7.8 1.33 20.57
CY 0.8 0.24 4.62
LV 33.8 3.43 22.42
LT 6.9 0.49 2.61
HU 17.6 0.46 7.57
PL : : :
SI 3.7 0.40 4.22
SK 23.7 1.12 17.04
BG 20.9 0.75 7.00
RO ; 0.44 1.17
Source: Eurostat / New Cronos
(Thousands of people) Industry
1995 2000 2002 1995 2000 2002
EU 15 148,694 159,232 162,974 44,829 45,931 45,700
B 3,793 4,120 4,052 1,072 1,064 1,045
DK 2,601 2,716 2,741 703 686 642
D 35,782 36,324 36,275 12,883 12,180 11,741
EL 3,821 3,946 3,949 886 888 887
E 12,495 15,306 16,241 3,774 4,748 5,088
F 21,907 23,123 23,885 5,898 6,073 6,065
IRL 1,262 1,671 1,750 349 476 484
I 19,943 20,930 21,757 6,405 6,653 6,874
L 162 181 188 41 38 38
NL 6,782 7,860 8,176 1,535 1,589 1,554
A 3,675 3,684 3,734 1,180 1,106 1,078
P 4,417 5,016 5,133 1,421 1,721 1,727
FIN 2,016 2,367 2,406 556 660 652
S 4,051 4,125 4,348 1,031 1,005 997
UK 25,989 27,862 28,338 7,094 7,045 6,827
IS 140 157 156 35 35 35
NO 2,043 2,271 2,293 470 494 497
CH : 3,879 3,959 : 933 920
CZ : 4,675 4,763 : 1,866 1,909
EE : 568 581 : 196 179
CY : 294 315 : 70 73
LV : 942 987 : 252 252
LT : 1,525 1,421 : 418 389
HU : 3,807 3,846 : 1,286 1,315
PL : 14,518 13,820 : 4,509 3,944
SI : 894 922 : 334 355
SK : 2,083 2,111 : 776 805
BG : 2,872 2,800 : 938 914
RO ; 10,898 9,768 ; 2,811 2,890
Source: Eurostat / New Cronos All sectors
(Thousands of people)
Forestry and related services
1995 2000 2002 1995 2000 2002
EU 15 7,829 6,796 6,319 278 240 248
B 102 79 73 3 . .
DK 114 99 88 . . .
D 1,134 958 902 65 48 42
EL 780 671 624 8 7 9
E 1,123 1,013 964 27 36 34
F 1,071 958 987 37 37 40
IRL 151 131 121 3 . .
I 1,489 1,095 1,072 51 36 44
L 6 4 4 . . .
NL 252 242 . . . .
A 270 223 212 11 6 6
P 507 633 640 9 11 15
FIN 156 147 133 18 27 21
S 142 120 110 31 20 19
UK 531 425 391 17 12 18
IS 13 14 12 . . .
NO 111 97 90 6 6 5
CH : 181 167 : 5 7
CZ : 244 232 : 48 43
EE : 39 38 : 7 8
CY : 16 17 : 1 1
LV : 141 151 : 19 34
LT : 281 265 : 15 7
HU : 246 233 : 16 18
PL : 2,711 2,713 : : :
SI : 85 89 : 4 4
SK : 144 139 : 25 24
BG : 377 299 : 33 21
RO ; 4,926 3,683 ; 58 43
Source: Eurostat / New Cronos
Employment in all sectors, industry, agriculture, and in the related branches of the Forest Sector (cont.)
(Thousands of people) Pulp and paper
1995 2000 2002 1995 2000 2002
EU 15 1070.6 1032.23 1004.14 720 704 676.59
B 20 21 25 14 17 20
DK 19 19 10 11 8 9
D 371 244 217 188 157 150
EL 30 28 27 11 9 8
E 83 110 125 40 50 43
F 114 116 116 91 99 92
IRL 8 9 8 4 4 4
I 144 186 182 79 103 105
L . . . .
NL 20 25 20 27 28 27
A 41 35 28 20 19 17
P 59 75 77 17 16 13
FIN 34 35 32 37 40 44
S 43 40 40 52 38 41
UK 87 89 96 129 117 105
IS . . . .
NO 19 16 18 9 10 10
CH : 44 39 : 13 11
CZ : 63 75 : 26 26
EE : 22 20 : . .
CY : 3 2 : . .
LV : 18 39 : . .
LT : 32 28 : . .
HU : 39 38 : 12 .
PL : : : : : :
SI : 18 14 : 6 7
SK : 39 35 : 14 12
BG : 26 22 : 15 12
RO : 109 129 : 27 23
Source: Eurostat / New Cronos
Employment in all sectors, industry, agriculture, and in the related branches of the Forest Sector (cont.)
4. Energy
All products
The code “All products” covers all energy products. These consist of hard coal and derivatives, lignite and derivatives, peat and derivatives, crude oil and petroleum products, natural gas, manufactured gases, derived heat, renewable energies, electrical energy and nuclear energy.
Renewable energies
“Renewable energies” covers hydro power, wind energy, solar energy, biomass and wastes and geothermal energy.
Wood and wood waste
“Wood and wood waste” covers purpose-grown energy crops (poplar, willow, etc), a multitude of woody materials generated by industrial processes or provided directly by forestry and agriculture (firewood, wood chips, bark, sawdust, shavings, chips, black liquor, etc), as well as wastes (such as straw, rice husks, nut shells, poultry litter, crushed grape dregs, etc).
Primary production
Any kind of extraction of energy products from natural sources to a usable form is called primary production. “Primary production” takes place when the natural sources are exploited, for example in coal mines, crude oil fields, hydro power plants or fabrication of biofuels. Transformation of energy from one form to another, such as electricity or heat generation in thermal power plants, or coke production in coke ovens, is not primary production.
Final energy consumption
1990 1995 2001
wood wood wood wood wood wood
% of total % of renew. % of total % of renew. % of total % of renew.
EU15 5.17 55.21 5.24 52.66 5.99 49.45
B 2.81 51.78 2.12 38.77 2.17 40.16
DK 12.70 75.26 6.55 59.58 3.49 43.63
D 1.58 51.60 2.11 47.08 3.38 45.06
EL 9.76 80.84 9.25 69.59 9.43 71.12
E 11.76 63.24 10.58 58.92 11.17 44.18
F 8.92 61.54 7.75 53.12 7.28 51.48
IRL 3.02 62.89 3.72 70.68 8.79 58.34
I 11.45 38.18 10.50 35.83 18.34 41.03
L 33.00 33.00 33.03 33.03 31.84 31.84
NL 0.44 34.31 0.37 27.22 0.53 19.94
A 27.85 44.16 29.69 42.98 29.50 41.53
P 67.27 70.15 70.25 70.25 55.86 55.86
FIN 36.72 81.74 37.99 81.47 42.75 83.68
S 17.34 43.89 21.53 51.60 22.38 50.63
UK 0.15 28.74 0.35 45.43 0.34 32.69
IS : : : : : :
NO 0.77 8.06 0.56 8.72 0.58 11.13
CZ : : 1.23 65.19 1.22 53.28
EE 8.23 100.00 14.46 99.55 16.03 99.54
CY : : : : : :
LV : : : : 84.84 85.66
LT : : : : 15.29 95.74
HU : : : : 3.09 79.41
MT : : : : : :
PL 1.47 90.70 3.83 94.11 4.83 94.18
SI : : 8.71 48.54 : 54.80
SK : : : : 4.24 37.02
BG : : 2.15 59.29 5.32 78.55
RO 2.77 43.98 4.44 48.68 7.67 62.41
TR : : : : 23.32 61.72
2001 data for EU, Germany and Italy are provisional.
Source: Eurostat / New Cronos
1990 1995 2001
wood wood wood wood wood wood
% of total % of renew. % of total % of renew. % of total % of renew.
EU15 3.92 97.29 3.79 96.39 3.99 93.52
B 0.97 98.44 0.88 97.09 0.95 91.38
DK 3.88 94.80 3.71 92.76 3.90 91.79
D 1.28 94.93 1.16 94.29 1.89 81.91
EL 6.14 93.76 5.67 91.28 4.91 89.99
E 6.88 99.15 5.05 98.49 4.02 96.18
F 6.99 97.68 6.61 95.72 6.02 91.58
IRL 1.48 97.85 2.04 98.15 1.42 97.08
I 2.84 92.59 2.76 91.86 4.18 94.66
L 0.46 100.00 0.49 100.00 0.43 99.69
NL 0.61 88.39 0.52 82.21 0.35 79.31
A 11.10 98.59 10.49 97.79 9.92 96.28
P 15.52 99.25 12.89 98.98 9.82 98.90
FIN 16.28 100.00 17.74 100.00 19.41 99.48
S 15.18 99.93 15.05 99.91 15.05 99.88
UK 0.22 74.75 0.54 87.89 0.31 82.01
IS : : : : : :
NO 5.58 99.89 5.77 98.43 6.90 99.19
CZ : : 1.10 100.00 0.73 79.24
EE 6.59 100.00 16.33 100.00 : 100.00
CY : : : : : :
LV : : : 28.29 100.00
LT : : : 15.47 100.00
HU : : : 1.96 98.22
MT : : : : : :
PL 1.40 56.63 5.86 99.73 6.59 99.41
SI : : 6.58 100.00 8.59 99.69
SK : : : : 2.10 93.83
BG : : 1.56 100.00 6.33 100.00
RO : ; 5.06 100.00 9.44 100.00
TR : : 0.00 : 14.87 77.93
2001 data for EU, Germany, Spain and Italy are provisional.
Source: Eurostat / New Cronos
1990 1995 2001
wood wood wood wood wood wood
% of total % of renew. % of total % of renew. % of total % of renew.
EU15 9.21 98.62 8.68 98.22 9.24 97.86
B 2.22 99.55 1.82 99.45 1.73 99.18
DK 8.30 99.34 8.39 98.71 9.32 98.03
D 3.79 99.62 3.47 98.79 5.88 98.48
EL 22.99 92.56 21.10 89.52 14.98 87.40
E 22.38 98.99 19.95 99.50 16.02 98.23
F 22.35 98.49 21.55 98.15 18.93 97.88
IRL 2.02 99.89 1.82 99.75 1.69 99.72
I 6.71 97.77 6.76 97.80 10.97 98.74
L 2.97 100.00 2.76 100.00 2.42 99.69
NL 2.26 99.25 1.90 98.23 1.13 92.56
A 22.20 99.41 23.82 98.46 22.20 96.92
P 50.22 99.37 44.76 99.11 40.29 99.02
FIN 17.16 100.00 16.98 99.98 20.02 99.98
S 13.74 99.66 11.59 99.50 7.30 99.03
UK 0.45 96.69 0.51 96.92 0.46 93.50
IS : : : : : :
NO 13.64 100.00 14.95 100.00 13.55 100.00
CZ : : : : : :
EE 27.02 100.00 32.07 100.00 34.72 100.00
CY : : : : : :
LV : : : : 50.54 100.00
LT : : : : 35.68 100.00
HU : : : : 4.52 100.00
MT : : : : : :
PL 4.52 100.00 10.77 100.00 12.98 100.00
SI : : 12.60 100.00 32.18 100.00
SK : : : : : :
BG : : 6.36 100.00 24.14 100.00
RO 17.66 100.00 16.32 100.00 24.44 100.00
TR : : : : 44.69 77.93
Source: Eurostat / New Cronos
Share of final consumption of energy from wood and wood waste at household level
5. Forest Condition1
Crown condition in the forests of Europe
Forest condition in Europe has been monitored over 17 years jointly by the International Cooperative Programme on Assessment and Monitoring of Air Pollution Effects on Forests (ICP Forests) of the United Nations Economic Commission for Europe (UNECE) and by the European Union (EU). Large-scale variations of forest condition over space and time in relation to natural and anthropogenic factors are assessed on about 6 000 plots systematically spread across Europe. Within the so-called crown condition survey, the lack of foliage is described as defoliation for each sample tree. Trees with no leaf and needle loss have 0% defoliation, whereas dead trees are 100% defoliated. More than 130 000 trees on approximately 6 000 permanent sample plots in 30 European countries were assessed using harmonized methods in 2002. Some 21.3% of these trees were classified as moderately or severely defoliated or dead. The temporal development of defoliation was analysed for the smaller sample of continuously monitored trees. Silver fir trees had the highest mean defoliation in all years. In general, mean defoliation values fluctuated considerably (see Figure 1).
Figure 1:
Trends for mean defoliation for European main tree species, calculated for continuously monitored trees.
Sample sizes vary between 1 237 trees for European and sessile oak and 2 988 for spruce (silver fir: 289 trees).
[image:48.343.48.283.384.594.2]Effects of air pollution
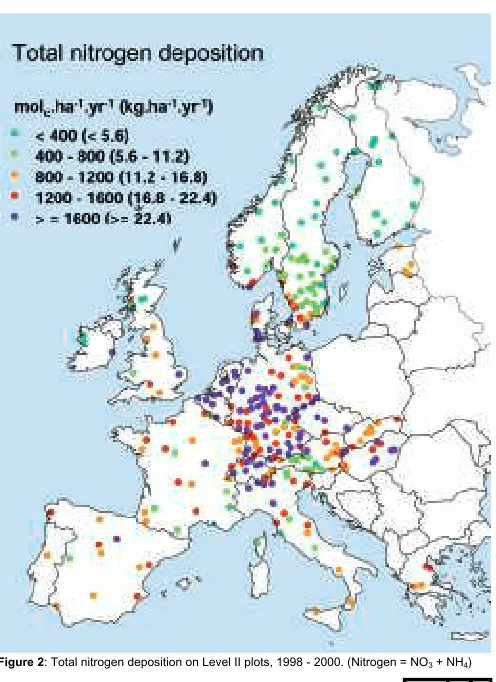
Within the ICP Forests and EU forest monitoring programme, air pollution has been shown to be one factor explaining the spatial and temporal variability of crown condition. Causal relationships are studied in detail on about 860 intensive monitoring plots covering the most important forest ecosystems in Europe. Deposition is measured below the forest canopy (throughfall) as well as in nearby open fields (bulk deposition). Due to interactions in the canopy, total deposition is modelled on throughfall
On average, nitrogen deposition was highest in measurements and bulk deposition.
[image:49.343.50.298.231.572.2]Critical loads for nitrogen and acidity
Total deposition describes the current situation but does not give precise information on the potential damage to be expected from atmospheric inputs. Similar deposition loads can have differing effects depending on the stand and site conditions in the forests. Critical loads have therefore been calculated. They define thresholds for the effects of air pollution. If pollution is below the critical values, it is assumed that no environmental damage will occur and a long-term stability of the ecosystem is achieved. The critical load of sulphur and nitrogen acidity was defined in 1994 in the UNECE Protocol on Further Reduction of Sulphur Emissions.
Within the monitoring programme of EU and ICP Forests, critical loads were calculated for approximately 230 Intensive Monitoring plots where all relevant data on deposition, meteorology, forest growth and soil and soil solution chemistry were available. Results for nitrogen are reported as the sum of nitrate (NO3) and ammonium (NH4). Acidity is defined as the sum of sulphate (SO4) and nitrogen.
Ground vegetation
[image:53.343.50.303.271.353.2]The Intensive Monitoring Plots offer a unique opportunity to relate the species composition of the ground vegetation to environmental factors, including atmospheric deposition. This was done to identify where possible those environmental factors that most strongly determine the plant diversity of the ground vegetation, specifically in view of the hypothesis that the deposition of nitrogenous compounds is an important threat. The impact of nitrogen deposition was low but statistically significant. Due to the fact that until now only one vegetation assessment has been evaluated, the results only refer to the spatial variation of the ground vegetation. The results of repeated surveys will become available soon and a stronger influence of deposition on ground vegetation changes is expected.
Table 1: Percentage of explained variance of the species abundances that could be ascribed to the four main groups of variables based on 194 Intensive Monitoring Plots
Variable group Explained variance
Actual soil situation 7.6%
Temperature, precipitation 5.6%
Tree species 4.1%
Deposition 3.3%
6. Mapping European forests1
using Earth Observation data and statistics
Earth Observation data has become a valuable source of spatial information complementing traditional statistical data in giving an overall picture of the actual geographical location of land surface features like forest area. During the Fifth Framework Programme, the Joint Research Centre, the European Forest Institute and VTT Automation developed a method for combining satellite data with statistics from EUROSTAT and national statistical data for producing forest distribution maps covering the pan-European area: for each square kilometre, corresponding to the geometric resolution of the NOAA satellite, an estimate is made of the proportion covered by forest or main forest type. This estimate is adjusted to comply with national or regional statistical estimates.
7. Forest Fires
The public awareness on the issue of natural hazards is increasing every day. The EU and international organizations are realizing that there are means to reduce or minimize the damage caused by natural disasters. The first step in this direction is the characterization of areas subject to suffer damages. This involves the use of analytical tools to infer the risk of natural or human induced hazards.
Burnt area in the EU-Med region
0 200 400 600 800
1000 1200
1980
1981
1982
1983
1984
1985
1986
1987
1988
1989
1990
1991
1992
1993
Burnt area (1000 ha)
Number of fires in the EU-Med region
0 10 20 30 40 50 60 70 80 90
1980
1981
1982
1983
1984
1985
1986
1987
1988
1989
1990
1991
1992
1993
Number of Fires (thousands)
Burnt area in thr EU-Med countries
0 100 200 300 400 500 600
P E F I EL EU-Med
Burnt area (1000 ha)
Year 2001 Yearly average 1980-2001
Number of Fires in the EU-Med countries
0 10 20 30 40 50 60 70
P E F I EL EU-Med
Number of Fires (thousands)
Percentage of the total burnt area in each of the EU-Med countries
E 23% F
6% I 26%
EL 6%
P 39%
Number of fires and burnt area of the EU-Med countries in the last decades
Number of fires
(thousands) P E F I EL EU-Med
2001 27.1 19.6 4.1 7.1 2.5 60.5
Average
1980-1989 6.8 9.5 4.9 11.6 1.3 34.0
Average
1990-1999 22.3 18.2 5.5 11.4 1.8 59.0
Average
1980-2001 16.0 14.6 5.2 11.2 1.6 48.5
TOTAL 351.5 320.6 113.7 247.0 35.2 1068.0
Burnt area
(1000 ha) P E F I EL EU-Med
2001 111.2 66.1 17.0 76.4 18.2 288.9
Average
(1980-1989) 74.5 244.8 39.2 148.5 52.4 559.3 Average
(1990-1999) 102.2 161.3 23.0 108.9 44.1 442.5 Average
1980-2001 92.6 196.2 30.1 125.7 51.3 497.2 Percentage of
total (2001) 39.0 23.0 6.0 26.0 6.0 100.0
Numbers of Fire in EU Northern countries
0 200 400 600 800 1000 1200 1400 1600 1800 2000
1996 1997 1998 1999 2000 2001 Avg 6 years
Number of Fires
Germany Finland
Burnt area in EU Northern countries
0 200 400 600 800 1000 1200 1400 1600
1996 1997 1998 1999 2000 2001 Avg 6 years
Burnt area (ha)
Number of fires and burnt area of the EU Northern countries
Number of Fires Burnt area (ha)
D FIN D FIN
1991 1,846 : 920 :
1992 3,012 : 4,908 :
1993 1,694 : 1,493 :
1994 1,696 : 1,114 :
1995 1,237 : 592 :
1996 1,748 1,475 1,381 433
1997 1,467 1,585 599 1,146
1998 1,032 370 397 131
1999 1,178 1,528 415 609
2000 1,210 805 581 352
2001 587 751 122 161
Avg 6 years 1,204 1,086 583 472
1. Removals
The primary source for removals of roundwood is the Joint Eurostat/UNECE/FAO/ITTO Forest Sector Questionnaire. The definitions and breakdown of roundwood used in the questionnaire are:
Removals (the term is used as a synonymous term for “roundwood production”) comprise all quantities of wood removed from the forest and other wooded land or other felling site during a certain period of time. It is reported in cubic metres underbark (i.e. excluding bark).
Roundwood is divided into two principal categories: industrial roundwood and wood fuel. The commodities included in industrial roundwood are logs, pulpwood and other industrial wood. The final use determines the category to which roundwood is attributed. Logs are used for the production of sawnwood (including sleepers) and veneer sheets.
Pulpwood is wood in the rough other than logs, for the manufacture of pulp, particleboard and fibreboard.
Other Industrial roundwood includes roundwood that will be used for poles, piling, posts, fencing, pitprops tanning, distillation and match blocks, etc. Wood fuel is wood in the rough (from trunks and branches of trees), to be used as fuel for purposes such as cooking, heating and power production.
All roundwood commodities can further be divided into coniferous (generally referred to as softwood) or non-coniferous (generally referred to as broadleaves or hardwood) species. Here, separate figures are reported for coniferous and non-coniferous total roundwood.
engaged in agriculture or other occupations as well as forestry; private forest enterprises and industries; private corporations and other institutions (religious and educational institutions, pension and investment funds, nature conservation societies, etc).
–State ownership: forests owned by national, state and regional governments, or government-owned corporations; Crown forests.
1995 2000 2002 1995 2000 2002 1995 2000 2002
EU-15 192,322 217,194 201,569 65,683 68,823 62,817 258,005 286,017 264,386
B : 2,830 3,000 : 1,680 1,500 : 4,510 4,500
DK 1,518 2,428 1,064 764 524 382 2,282 2,952 1,446
D 30,442 43,284 33,177 8,901 10,426 9,203 39,343 53,710 42,380
EL 521 600 484 1,440 1,645 1,107 1,961 2,245 1,591
E 8,654 8,114 8,901 7,421 6,207 6,938 16,075 14,321 15,839
F 19,958 28,739 22,190 16,103 17,089 13,710 36,061 45,828 35,900
IRL 2,163 2,631 2,443 41 42 46 2,204 2,673 2,489
I 1,736 1,719 1,439 8,000 7,610 6,350 9,736 9,329 7,789
L : 121 41 : 138 99 : 260 140
NL 693 645 522 411 394 317 1,104 1,039 839
A 12,196 11,229 12,670 2,209 2,047 2,175 14,405 13,276 14,845
P 5,117 5,182 3,285 4,233 5,649 5,457 9,350 10,831 8,742
FIN 41,734 45,769 44,471 8,485 8,493 8,540 50,219 54,262 53,011
S 58,100 57,010 61,050 5,500 6,290 6,450 63,600 63,300 67,500
UK 6,780 6,892 6,832 775 589 543 7,555 7,481 7,375
IS 0 - - 0 - - 0 -
-NO 8,476 7,602 7,847 569 554 802 9,045 8,156 8,649
CH 3,516 7,611 3,200 1,233 1,627 1,250 4,749 9,238 4,450
CZ 11,308 12,851 13,010 1,057 1,590 1,531 12,365 14,441 14,541
EE 1,853 5,870 6,920 1,856 3,040 3,580 3,709 8,910 10,500
CY 46 19 14 2 1 2 48 21 15
LV 2,800 9,618 8,552 4,090 4,686 4,915 6,890 14,304 13,467
LT 4,600 2,880 3,460 1,360 2,620 2,840 5,960 5,500 6,300
HU 420 696 620 3,911 5,206 5,216 4,331 5,902 5,836
MT 0 0 0 0 0 0 0 0 0
PL 15,365 19,541 19,855 5,286 6,484 7,315 20,651 26,025 27,170
SI 1,043 1,209 1,272 823 1,044 1,011 1,866 2,253 2,283
SK 3,237 3,211 2,882 2,086 2,952 2,883 5,323 6,163 5,765
BG 996 1,608 1,408 1,842 3,176 2,584 2,838 4,784 3,992
RO 4,355 4,919 6,592 7,823 8,230 8,562 12,178 13,148 15,154
TR 9,002 7,394 8,238 10,277 9,393 10,227 19,279 16,787 18,465
CA 158,365 163,042 163,042 29,981 37,284 37,284 188,346 200,326 200,326
RU 85,100 97,000 119,000 31,410 61,100 57,900 116,510 158,100 176,900
US 286,621 292,669 289,686 212,689 207,505 188,135 499,310 500,174 477,821
Source: Eurosat / New Cronos
1000m³
Removals of roundwood by coniferous and non-coniferous species
Removals by roundwood category
1995 2000 2002 1995 2000 2002 1995 2000 2002
EU-15 27,498 28,862 30,306 230,507 257,154 234,080 258,005 286,017 264,386
B : 550 550 : 3,960 3,950 : 4,510 4,500 DK 485 461 657 1,797 2,491 789 2,282 2,952 1,446 D 2,429 2,622 4,625 36,914 51,088 37,755 39,343 53,710 42,380 EL 1,330 1,601 1,093 631 644 498 1,961 2,245 1,591 E 3,078 1,600 1,989 12,997 12,721 13,850 16,075 14,321 15,839 F 2,500 2,388 2,400 33,561 43,440 33,500 36,061 45,828 35,900 IRL 64 73 34 2,140 2,600 2,455 2,204 2,673 2,489 I 5,263 5,680 4,567 4,473 3,649 3,222 9,736 9,329 7,789
L : 18 4 : 242 135 : 260 140
NL 163 160 136 941 879 703 1,104 1,039 839 A 3,059 2,860 3,036 11,346 10,416 11,809 14,405 13,276 14,845 P 500 600 600 8,850 10,231 8,142 9,350 10,831 8,742 FIN 4,095 4,115 4,482 46,124 50,147 48,529 50,219 54,262 53,011 S 3,800 5,900 5,900 59,800 57,400 61,600 63,600 63,300 67,500 UK 232 234 233 7,323 7,247 7,142 7,555 7,481 7,375
IS 0 - - 0 - - 0 -
-NO 470 678 1,189 8,575 7,478 7,460 9,045 8,156 8,649 CH 833 1,626 950 3,916 7,612 3,500 4,749 9,238 4,450 CZ 649 940 1,007 11,716 13,501 13,534 12,365 14,441 14,541 EE 573 1,640 1,930 3,136 7,270 8,570 3,709 8,910 10,500
CY 11 5 5 37 15 10 48 21 15
LV 1,200 1,680 1,198 5,690 12,624 12,269 6,890 14,304 13,467 LT 1,090 1,450 1,440 4,870 4,050 4,860 5,960 5,500 6,300 HU 1,948 2,597 2,398 2,383 3,305 3,438 4,331 5,902 5,836
MT 0 0 0 0 0 0 0 0 0
PL 1,411 1,536 2,130 19,240 24,489 25,040 20,651 26,025 27,170 SI 227 532 280 1,639 1,721 2,003 1,866 2,253 2,283 SK 436 277 259 4,887 5,886 5,507 5,323 6,163 5,765 BG 868 2,107 1,635 1,970 2,677 2,357 2,838 4,784 3,992 RO 2,163 3,032 3,062 10,015 10,116 12,092 12,178 13,148 15,154 TR 8,534 6,358 7,160 10,745 10,429 11,305 19,279 16,787 18,465 CA 5,319 2,953 2,953 183,027 197,373 197,373 188,346 200,326 200,326 RU 33,460 52,300 48,800 83,050 105,800 128,100 116,510 158,100 176,900
US 90,362 72,520 73,086 408,948 427,654 404,735 499,310 500,174 477,821 Source: Eurosat / New Cronos
Fuelwood Industrial roundwood Roundwood total
Removals by forest ownership category
2001 2002 2001 2002 2001 2002 2001 2002
EU-15 : : : : : : : :
B : : : : : : : :
DK 418 345 63 58 1,132 1,043 1,613 1,446 D 17,737 17,262 9,671 8,612 12,075 16,506 39,483 42,380
EL 1,579 1,302 - - 337 289 1,916 1,591
E : : : : : : : :
F 7,182 5,092 8,031 7,056 24,618 23,752 39,831 35,900 IRL - - 2,301 2,318 154 171 2,455 2,489
I 143 157 1,567 1,590 6,390 6,042 8,099 7,789
L : : : : : : : :
NL 347 337 87 87 431 415 865 839
A 1,848 1,931 - - 11,619 12,914 13,467 14,845
P : : : : : : : :
FIN 4,068 4,171 - : 48,142 48,840 52,210 53,011
S 300 : 3,100 : 59,800 : 63,200 67,500
UK 4,735 4,771 : : 2,824 2,604 7,559 7,375
IS : : : : : : : :
NO 249 210 - - 8,748 8,438 8,996 8,649
CH 382 : 3,452 : 1,828 : 5,662 :
Source: Eurosat / New Cronos
1000 m³
Removals of Industrial roundwood by roundwood assortment
1995 2000 2002 1995 2000 2002
EU-15 133,819 157,561 135,742 90,674 91,145 91,682
B : 2,660 2,575 : 1,200 1,175
DK 875 1,332 455 571 587 153
D 24,292 36,537 24,446 11,738 10,118 10,398
EL 389 441 409 142 113
-E 6,030 6,678 7,603 6,341 5,393 5,373
F 21,687 30,619 21,730 11,414 12,341 11,300
IRL 1,370 1,588 1,733 770 1,013 722
I 2,543 2,062 1,840 710 708 590
L : 113 68 : 72 67
NL 514 572 398 352 197 189
A 8,081 8,033 9,183 2,665 2,383 2,626
P 4,189 3,588 2,294 4,480 6,463 5,668
FIN 22,831 25,994 23,835 22,968 24,153 24,694 S 34,700 33,140 34,900 24,600 23,760 26,200
UK 3,768 4,204 4,273 3,073 2,645 2,527
IS 0 - - 0 : :
NO 4,603 4,088 4,141 3,762 3,366 3,293
CH 3,304 6,801 3,000 542 811 500
CZ 5,812 8,020 8,073 5,204 5,081 5,081
EE 1,413 2,850 3,360 1,527 3,800 4,030
CY 25 12 10 12 3 0
LV 2,900 8,642 9,861 2,400 3,517 1,861
LT 2,320 2,900 3,220 2,390 1,100 1,620
HU 1,303 1,380 1,860 660 612 623
MT 0 0 0 0 0 0
PL 9,337 11,609 10,716 7,630 10,988 12,600
SI 918 1,120 1,164 397 396 414
SK 2,109 2,566 2,365 2,691 3,118 2,955
BG 877 1,626 1,292 934 957 971
RO 4,274 6,146 7,062 1,934 1,652 2,463
TR 5,467 5,178 5,606 1,558 3,369 3,776
CA 150,026 165,301 165,301 30,926 28,102 28,102
RU 52,550 49,700 67,800 23,300 46,400 47,500
US 242,874 248,241 229,356 150,000 164,513 161,645 Source: Eurosat / New Cronos
1000 m³
Removals of Industrial roundwood (cont.) by roundwood assortment
1995 2000 2002 1995 2000 2002
EU-15 6,014 8,448 6,655 230,507 257,154 234,080
B : 100 200 : 3,960 3,950
DK 351 573 181 1,797 2,491 789
D 884 4,433 2,911 36,914 51,088 37,755
EL 100 90 89 631 644 498
E 626 650 874 12,997 12,721 13,850
F 460 480 470 33,561 43,440 33,500
IRL 0 - - 2,140 2,600 2,455
I 1,220 879 792 4,473 3,649 3,222
L : 56 0 : 242 135
NL 75 109 116 941 879 703
A 600 - - 11,346 10,416 11,809
P 181 180 180 8,850 10,231 8,142
FIN 325 - - 46,124 50,147 48,529
S 500 500 500 59,800 57,400 61,600
UK 482 398 342 7,323 7,247 7,142
IS 0 : : 0 -
-NO 210 24 26 8,575 7,478 7,460
CH 70 - - 3,916 7,612 3,500
CZ 700 400 380 11,716 13,501 13,534
EE 196 620 1,180 3,136 7,270 8,570
CY 0 0 0 37 15 10
LV 390 465 547 5,690 12,624 12,269
LT 160 50 20 4,870 4,050 4,860
HU 420 1,314 956 2,383 3,305 3,438
MT 0 0 0 0 0 0
PL 2,273 1,892 1,724 19,240 24,489 25,040
SI 324 205 425 1,639 1,721 2,003
SK 87 202 187 4,887 5,886 5,507
BG 159 94 94 1,970 2,677 2,357
RO 3,807 2,318 2,567 10,015 10,116 12,092 TR 3,720 1,882 1,923 10,745 10,429 11,305 CA 2,075 3,970 3,970 183,027 197,373 197,373
RU 7,200 9,700 12,800 83,050 105,800 128,100
US 16,074 14,900 13,734 408,948 427,654 404,735 Source: Eurosat / New Cronos
Other industrial roundwood Industrial roundwood total
2. Supply balance sheets
The primary source of the data is the Joint Eurostat/UNECE/FAO/ITTO Forest Sector Questionnaire. The tables comprise the production and trade of roundwood and the following forest industry products:
Sawnwood: wood that has been produced either by sawing lengthways or by a profile-chipping process. It includes planks, beams, joists, boards, rafters scantlings, laths, boxboards, sleepers and "lumber", etc
Wood-based panels comprising the following pane products: veneer sheets, plywood, particle board (including oriented standard board OSB) and fibreboard;
Wood pulp: fibrous material prepared from pulpwood, wood chips, particles or residues by mechanical and/or chemical process for further manufacture into paper, paperboard, fibreboard or other cellulose products;
Paper and paper board comprising the sum of graphic papers; sanitary and household papers; packaging materials and other paper and paperboard but
excluding manufactured paper products such as boxes, cartons, books and magazines, etc.