Int. J. Electrochem. Sci., 9 (2014) 4331 - 4344
International Journal of
ELECTROCHEMICAL
SCIENCE
www.electrochemsci.org
Effect of Segmented Current Collection Contacts Attached to
Gas Diffusion Layer in Micro PEM Fuel Cells with Ceramic
Flow Field Plates
P. Ramesh* , S.P Duttagupta
Dept of Electrical Engineering, Indian Institute of Technology Bombay, Maharashtra ,India 400076
*
E-mail: [email protected]
Received: 27 March 2014 / Accepted: 29 April 2014 / Published: 19 May 2014
Proton exchange membrane fuel cells (PEMFCs) are very promising for power stationary applications. One of the key components of fuel cells is the flow field plate through which hydrogen fuel will reach the anode and oxygen reach the cathode. Another function of the flow field plate is the electron collection. Traditionally flow field plates are made of graphite which makes them good for current collection. But graphite is costly and the alternative steel is heavy. Thus with development of MEMS technology it becomes important to have flow field plates made of silicon or ceramics. As silicon and ceramics are not good electrical conductors, electrical contacts have to be attached to the Gas Diffusion Layer (GDL) for taking the power to outside world. This is achieved by attaching contact pads to the GDL area which are not covered by flow plates. A reduction in the power output from the cell is observed with current collection from the GDL. Here we build a three dimensional model for a fuel cell in which current collection is carried out by segmented contacts attached to the GDL and the reasons for drop in performance is studied. Also the current collection contact is segmented in order to increase the power output from the cell
Keywords: PEM Fuel cell; 3-D modeling; segmented contacts; Gas Diffusion layer; Membrane Electrode Assembly.
1. INTRODUCTION
authors [4-6] have reported building micro fuel cells, where the flow field plates are also made of silicon.
United States patent No. US 6,821,666 by Jeffrey D. Morse in 2004 reports a structure fabricated in LTCC wherein a thin film fuel cell can be embedded. It uses micro porous ceramic as a gas diffusion layer to supply fuel to thin film fuel cell. In the work reported here, a PEM fuel cell is used, which uses carbon paper as a gas diffusion layer, hence the package requires no additional GDL. Instead the fuel and air is supplied by serpentine manifolds formed in LTCC layers which are proved to remove the water effectively thereby avoiding the flooding in fuel cell. Lee et al [27] reported a flip flop micro fuel cell with a power density of 40 mW/cm2 process was very difficult. Yua et al [28] fabricated a miniature fuel cell which consisted of a membrane–electrode-assembly (MEA) between two silicon substrates. The feed holes and channels in the silicon wafers, acting as a fuel distributor, were in which fuel is routed in cross patterns. The fabrication prepared by anisotropic silicon etching from the back and front of the wafer using silicon dioxide as an etching mask. In an attempt to reduce the cell resistance and consequently improving cell performance of the miniature silicon wafer fuel cell, a Cu/Au composite layer was sputtered on the top of silicon wafers as a current collector. The peak power density of the cell was 107.3 mW/cm2 respectively. Shah et al [29] successfully fabricated hydrogen–air micro proton exchange membrane fuel cells (PEMFC) on silicon and poly dimethyl siloxane (PDMS) base substrates. They registered open circuit voltage in excess of 0.790 V while the peak power of 0.282 mW at 0.375 V was obtained from this fuel cell. Park et al. [30] pyrolyzed carbon fluidic plates with feature sizes less than 1 mm to create a miniature fuel cell. Epoxy is used to seal the fuel cell and water is directly applied to exposed Nafion to hydrate the membrane. The use of miniature carbon fluidic plates will allow for fabrication of 3D (non-planar) proton exchange membrane fuel cells utilizing carbon bipolar plates. The maximum power output is 0.773 mW when tested with methanol as a fuel at 260 mA/cm2. Here we are trying to make a pem fuel cell with ceramic flow field plates and carry out current collection from the GDL as ceramic is a bad conductor of electricity.
high aspect ratio yield higher current densities. This result differs from other simulation results, in which channel depth had no significant effects [22,23]. This disagreement may result from the differences in channel scales. Deeper channel depths provide sufficient space for reactant transportation and water removal. However, it also enlarges the channel cross-sectional area and slow down flow velocity, which subsequently affects mass transfer rate and water balance in the membrane electrode assembly Although numerous papers [12,15-17] explore flow channel geometric variables using two dimensional simulation , only a few papers [8,13,14,19] have dealt with three dimensional simulation, especially in miniature scale. It is more challenging to implement a three dimensional fuel cell model and examine the effects of segmented contacts on efficient miniature fuel cells. From these reviews, it can be concluded that the effective rib area has got a significant role in pem fuel cell performance. So while dealing with current collection from the GDL, special care must be given so as not to reduce the effective rib area.
In this paper, we try to implement a 3 D model of a PEM fuel cell with segmented current collection from the GDLThe study was done further without changing the effective rib area. The no. of segmented contacts analysed varies from 3, 5 and 7. With varying the contacts the power output were observed and the reason for performance variation is analysed
2. GOVERNING EQUATIONS FOR THE FUEL CELL MODEL
The gas flow within the channel is assumed to take place by convection and diffusion .The gas flow in the gas channel is modeled with the momentum and continuity equations ( Navier-Stokes equations):
( )
.( ) .( eff ) u
u
uu p u S t
(1)
( )
.( u) 0 t
(2)
where is theporosity ,μ the dynamic viscosity, (Pa.s), ρ the density (Kg/m3),Su is the source
term (for any external force),p is pressure (Pa),u – gas velocity vector (m/s).
Navier Stokes equations are applied in the gas channel with source term equal to zero while it is added as Darcy law in the GDL and catalyst layer to describe the flow in the porous media (Darcy law) along with the viscous effects that are important at the boundary between flow channel and GDL.
The mass flux in the gas phase is based on the Maxwell-Stefan diffusion and convection equations. It is described by this expression for species j:
1
1
.( ) .( )
n eff
i ij j i
j
X u D X S
(3) Where Dijeff is the effective diffusion constant.Since gas diffusion layers (GDL) and catalyst layers are porous media, the velocity distribution is therefore formulated by Darcy’s law and mass conservation equation.
u P
(4)
where κ is the permeability, m2; and μ the dynamic viscosity, Pa.s;
The continuity of current in a conducting material is described by
.i 0
(5)
In a PEM fuel cell, the conducting materials are porous electrodes and membrane. The current is therefore split into two parts: the ionic current and the electronic current. Protons travel through the ionic conductor (the membrane) to form an ionic current denoted by ie, while electrons can only be
transferred through the solid matrix of electrodes which results in an electronic current denoted by is.
The continuity equation of current then becomes: .i .is . 0ie
(6)
In the catalyst layer, where a chemical reaction occurs on a three-phase boundary, electrons are either transferred from the solid matrix to electrolyte or vice versa. This two-way transfer of electrons between solid matrix and electrolyte makes the transfer current density, denoted by j, a source term in one phase, and a sink term in the other phase. The potential equations for both solid and electrolyte phases are obtained by applying Ohm’s law to Eq. (12).
Electron transport .(seff s) Ss 0
(7) Proton transport
.(meff m) Se 0
(8) Where is the phase potential, eff
m
is the effective electric conductivity or also can be termed as the ionic conductivity in the membrane given by S/m; seff is the effective electrode conductivity,
S the current source term, A/m3; the subscript s denotes the property of a solid phase and e denotes that of an electrolyte phase. The source terms in the electron and proton transport equations, i.e., Eq. (13-14), result from the electrochemical reaction occurring in the catalyst layers of anode and cathode sides. The effective conductivity eff
m
is given by
1 1
1268
1.5 303
.(0.5139 0.326)
eff T
m me
; 1 (9)
1 1
1268
1.5 303
(0.1879)
eff T
m me
for 1
is the water content in the membrane phase which is related to the activity of water vapor in the adjacent pores, given by H O2
sat P a
P
,P is the gas pressure, Psat is the saturation gas pressure,
2
H O
is the gas phase water mass fraction)
Using an experimentally derived relationship by Springer for Nafion 117 membrane λ=0.043 + 17.81a - 39.85a2
+ 36a3 for 0≤a≤1 (10) λ=14 + 1.4(a-1) for a>1
The source terms are
Anode catalyst layer and Cathode catalyst layer
s a s c
S j S j (11)
e a s c
S j S j (12)
Where ja and jc are the transfer current density corresponding to the electrochemical reaction at
the anode and cathode catalyst layers. The transfer current densities are given by Butler-Volmer equations
, / , /
2 0,
2
c a aF RT a a aF RT
ref H
a a ref
H
C
j Aj e e
C
(13)
, / , /
2 0,
2
c c aF RT a c aF RT
ref O
c c ref
O
C
j Aj e e
C
(14)
Α – electrode active surface area in m2
η – activation overpotential F – Faraday’s constant R – universal gas constant
T- absolute temperature in Kelvin j0 – exchange current density A/m2
3. EXPERIMENTAL
The Nafion 212 membrane was boiled in 3% H2O2 solution for 1 hour. Then membrane was
placed in deionized water and boiled for 1 hour. Again membrane was boiled in 0.5 M H2SO4 solution
The MEA is tested in Arbin Instruments fuel cell test station with 100 % humidified oxygen and hydrogen gas. Flow rates were maintained at 0.2 SLPM. The gas was passed for 15 min to completely humidify the membrane after which a constant current was drawn in the intervals of five minutes and voltage is noted. Impedance spectroscopy was performed in galvanostatic mode for current densities upto 1.2 A/cm2 where anode is used as a reference and counter electrode whereas cathode served as a working electrode.
4. THE MODEL
A 3 dimensional model of a PEM fuel cell is implemented using COMSOL Multiphysics. The present model is established based on the following assumptions:
Flow is laminar everywhere due to small gas pressure gradient.
Reactant gases behave as the ideal gas mixture.
The electrodes and membrane are made of homogeneous materials.
The temperature distribution across the cell is uniform.
Water exists only in the gas phase in the fuel cell.
The polymer electrolyte membrane is impermeable to reactant gases.
Protons can only transport through the electrolyte, and electrons through the solid phase.
Three species including oxygen, water and nitrogen are considered on the cathode side while only hydrogen and water are considered on the anode side.
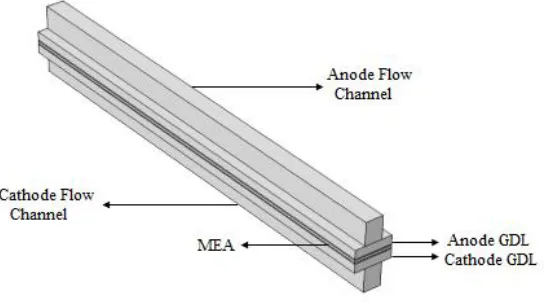
[image:6.596.152.424.528.679.2] The fuel cell is operating at the steady state.
Figure 1 shows the structure of the model developed in Comsol Multiphysics. The top part is the anode side while bottom part corresponds to the cathode.
The following are the operating conditions of the model.
Cell Length 0.02m
Channel height 0.001m
Channel width 0.7mm
Rib width 0.9mm
GDL width 0.3mm
Contact dimension for 1 contact 200um
Porous electrode thickness 0.5mm
Membrane thickness 0.05mm
GDL Porosity 0.4
GDL electric conductivity 1000S/m
Contact electric conductivity 100000S/m
Inlet H2 mass fraction (anode) 0.743
Inlet H2O mass fraction (cathode) 0.023
Inlet oxygen mass fraction (cathode) 0.228
Anode inlet flow velocity 0.2m/s
Cathode inlet flow velocity 0.5m/s
Anode viscosity 1.19 E-5 Pa.s
Cathode viscosity 2.46 E -5 Pa.s
Permeability (porous electrode) 2.36 E -12 m2
Membrane conductivity 10 S/m
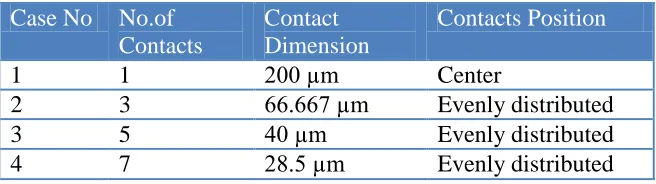
[image:7.596.135.463.584.676.2]Four different ways of connecting contacts to GDL is analyzed in the current study. In the study the effective rib width is kept constant by reducing the contact dimensions with increasing number of contacts. 3-D models for all the four schemes were also developed. TABLE 1 shows the various schemes of current collection.
Table 1. Schemes of current collection
Case No No.of Contacts
Contact Dimension
Contacts Position
1 1 200 µm Center
2 3 66.667 µm Evenly distributed
3 5 40 µm Evenly distributed
4 7 28.5 µm Evenly distributed
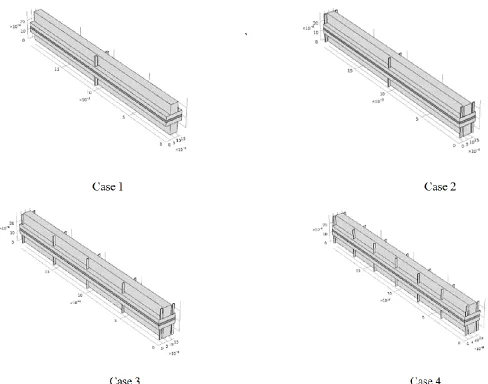
[image:8.596.54.542.171.555.2]
3, the number of contacts is increased to five and distributed uniformly throughout the GDL. In case 3, the contact dimensions are fixed as 40 µm. In case 4, seven contacts are distributed uniformly across the GDL and the contact dimension is fixed as 28.5 µm. By reducing the contact dimension, the effective rib area is not affected.
Figure 2. PEMFC models with segmented contacts
5. RESULTS
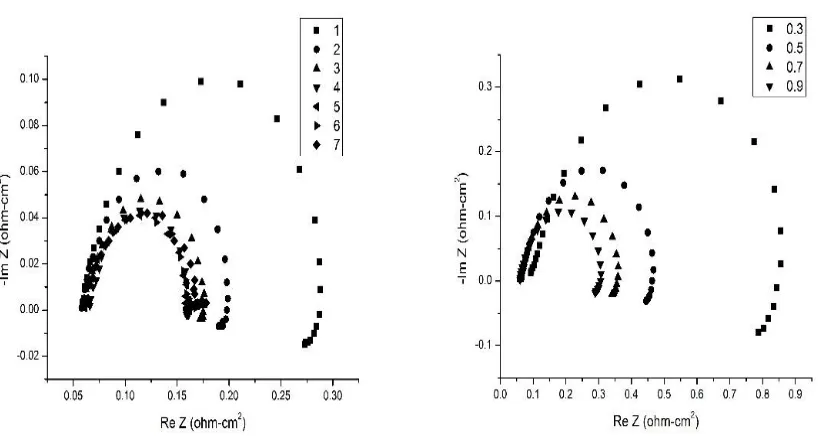
Figure 3. Polarization plot for experimental and modelling results
1. For all current densities HFR is nearly the same which means no change in membrane conductivity. But there is slight increase in HFR above current density of 1 A/cm2, which may be due to gradient of water across the membrane due to higher production rate of water at the cathode.
2. Mid frequency arc diminishes as current density increases. This is due to decrease in charge transfer resistance which is related to the faster kinetics of oxygen reduction at high current densities. This behavior is observed upto current density of 1.2 A/cm2, the mid frequency arc starts increasing after this. This may be attributed to oxygen mass transport limitations due to water accumulation on the cathode side.
[image:9.596.165.419.88.283.2] [image:9.596.86.495.498.718.2]
The fabricated cell produced a peak power density of 100 mW/cm2.This is less when compared to the conventional cell with graphite flow field plates and current collection from flow pates. But the performance was better when compared with micro fuel cells reported in the literature[4-6, 29, 30].The reasons for drop in performance while collecting current from GD is not studied in literature. The following sections deal with current collection from GDL and increasing performance by segmenting the current collection contacts
5.1. Effect of segmented Contacts:
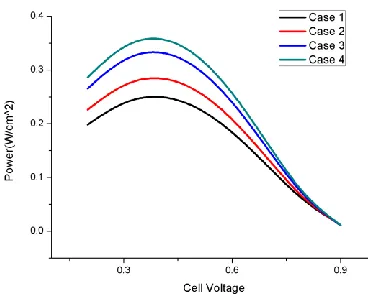
The polarization plots for the cases given in Table 1 is given in Figure 5. From figure 5, its observed that the cell in case 4 gave maximum performance.The performance is getting increased with increased number of contacts and reducing contact dimensions.
[image:10.596.196.380.297.444.2]Figure 5. Polarization curves for cases given in Table 1
[image:10.596.161.436.484.730.2]
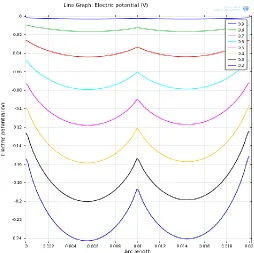
Figure 7. Electric Potential variation with 3 contacts
Figure 8. Electric Potential variation with 5 contacts
[image:11.596.177.420.379.622.2][image:12.596.165.433.131.398.2]
Also the peak values at the points below contacts are also more as the no.of contacts increases. This accounts for the increase in power with segmentation.
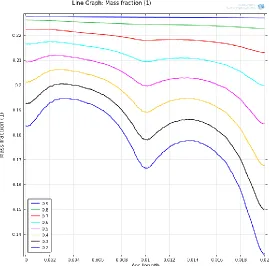
Figure 9. Mass fraction variation with 3 contacts
[image:12.596.164.433.459.725.2]
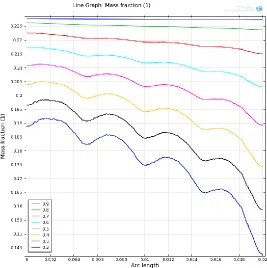
Figure 11. Mass fraction variation with 7 contacts
Figures 9, 10, 11 above shows the oxygen mass fraction variation in GDL below the contacts. Apart from the decrease in the mass fraction towards the outlet, peaks are observed below the gaps in the contacts which indicates the lower current density regions. Also as the no. of contact increases the oxygen mass fraction also increases below the contacts which indicates further higher activity and performance and inturn indicates better power below that regions.
6. CONCLUSION
A 3-dimensional model for PEM fuel cell is validated under the experimentally feasible assumptions. The effect of segmented contacts on the fuel cell performance is studied by considering different cases employing different contact dimensions. Overall performance of the fuel cell is found to be getting increased with segmentation. Segmentation of contacts should be done without affecting the effective rib area. To conclude, the more the segmentation with reduced contact sizing, the more will be the fuel cell performance.
References
1. B Viswanathan , M Aulice Scibioh,Fuel Cells - Principles and applications, Taylor and Francis, New York (2007)
3. T.S.Zhao, K.D Kreur .Trung Van Nguyen,Advances in Fuel cells,Elsevier, Great Britain (2007) 4. C.Xie, J.Bostaph,J.Pavio, Journal of power sources ,136 (2004) 55
5. Zhen Guoa, Amir Faghri. Journal of power sources, 160 (2006) 1183 6. Stefan Wagner, Roger Hahn ,MINATEC (2003)
7. Adrew Rowe, Xianguo Li, Journal of power sources,102 (2001) 86
8. S Dutta, S Shimpalee ,J W Van Zee, Journal of Applied Elecrochemistry , 30 (2000) 135 9. Sukkee Um, C Y Wang , K S Chen , Journal of the Electrochemical Society 147 (2000) 4485 10. Vladimir Gurau, Hongtan Liu, Sadik Kakac, AIChE Journal, 44 2004 (2410)
11. A.S.Arico, P.Cretì, V.Baglio, E. Modica, Antonucci, Journal of Power Sources, 91(2000) 202. 12. K.S.Cho , H.M.Kim, S.M.Moon, International Journal of Hydrogen Energy, 36 (2001) 1613 13. Y.M.Ferng, A.Su, International Journal of Hydrogen Energy, 32 (2007) 4466
14. A.Higie , H.Liu, International Journal of Hydrogen Energy, 35 (2012) 2144 15. S.S.Hsieh, K.M.Chu,, Journal of Power Sources, 173 (2007) 222
16. G.Inoue, Y.Matsukuma, M.Minemoto, Journal of Power Sources, 157 (2006) 136
17. D.H.Jeon, S.Greenway, S.Shimpalee, J.W.Van Zee, International Journal of Hydrogen Energy, 33 (2008) 1052
18. A.Kumar, R.G.Reddy, Journal of Power Sources, 113 (2003) 11
19. J.Lobato, P.Canizares, M.A.Rodrigo, F.J.Pinar, E.Mena, Ubeda, International Journal of Hydrogen Energy, 35 (2010) 5510
20. S.Shimpalee, J.W.Van Zee, International Journal of Hydrogen Energy, 32 (2007) 842 21. X.D.Wang, W.M.Yan, Y.Y.Duan, F.B.Weng, G.B.Jung, C.Y.Lee, Energy Conversion and
Management, 51 (2010) 959
22. Y.G.Yoon, W.Y.Lee, G.G.Park, T.H.Yang, C.S.Kim, Electrochemica Acta, 50 (2004) 709
23. J.Scholta, G.Escher,W. Zhang, L.Küppers ,L.Jorissen, W.Lehnert, Journal of Power Sources, 155 (2006) 66
24. S.Shimpalee, S.Greenway, J.W.Van Zee, Journal of Power Sources,160 (2006) 398
25. A.P.Manso, F.F.Marzo, M.G.Mujika, J.Barranco, A.Lorenzo, International Journal of Hydrogen Energy, 36 (2011) 6795
26. K.Palaniappan, R.Govindarasu, R.Parthiban , International Journal of Renewable Energy Research,2 (2012 ) 652
27. S. J. Lee, A. Chang-Chien, S. W. Cha, R. O’Hayre, Y. I. Park, Y. Saito, F. B. Prinz, Journal of Power Sources 112 (2002) 410.
28. Jingrong Yua, Ping Cheng, Zhiqi Ma , Baolian Yi, Journal of Power Sources,10 (2003) 618 29. Keyur Shah, W. C. Shin, R. S. Besser, Sensors and Actuators B: Chemical 127 (2004), 157 30. Benjamin Y. Park, Marc J. Madou, Journal of Power Sources (2006) 369
31. P. Ramesh, S.S Dimble, S.P Duttagupta, Comsol Conference,Bangalore (2011)