City, University of London Institutional Repository
Citation: Dima, D., Jogia, J. & Frangou, S. (2014). Dynamic causal modeling of
load-dependent modulation of effective connectivity within the verbal working memory network. Human Brain Mapping, 35(7), pp. 3025-3035. doi: 10.1002/hbm.22382This is the accepted version of the paper.
This version of the publication may differ from the final published
version.
Permanent repository link: http://openaccess.city.ac.uk/15085/
Link to published version: http://dx.doi.org/10.1002/hbm.22382
Copyright and reuse: City Research Online aims to make research
outputs of City, University of London available to a wider audience.
Copyright and Moral Rights remain with the author(s) and/or copyright
holders. URLs from City Research Online may be freely distributed and
linked to.
1
Dynamic Causal Modeling of load-dependent modulation of effective connectivity within the verbal working memory network
Short title: Brain connectivity in increasing memory load
Danai Dima1, Jigar Jogia1, Sophia Frangou2
1 Institute of Psychiatry, King’s College London, London, UK
2 Icahn School of Medicine at Mount Sinai, New York, USA
2
Abstract
Neuroimaging studies have consistently shown that working memory (WM) tasks engage a
distributed neural network that primarily includes the dorsolateral prefrontal (DLPFC), the
parietal (PAR) and the anterior cingulate cortices (ACC). The current challenge is to provide a
mechanistic account of the changes observed in regional activity. To achieve this we
characterised neuroplastic responses in effective connectivity between these regions at
increasing WM loads using Dynamic Causal Modeling of functional magnetic resonance
imaging data obtained from healthy individuals during a verbal n–back task. Our data
demonstrate that increasing memory load was associated with (a) right-hemisphere
dominance, (b) increasing forward (i.e. posterior to anterior) effective connectivity within
the WM network, and (c) reduction in individual variability in WM network architecture
resulting in the right-hemisphere forward model reaching an exceedance probability of 99%
in the most demanding condition. Our results provide direct empirical support that task
difficulty, in our case WM load, is a significant moderator of short-term plasticity,
complementing existing theories of task-related reduction in variability in neural networks.
3
Working memory (WM) refers to the ability to maintain, update and manipulate
goal-relevant information (Baddeley, 1992). WM tasks consistently recruit cortical regions
within the dorsolateral prefrontal cortex (DLPFC, Brodmann Area 9/46), the parietal cortex
(PAR, BA7/40) and the dorsal anterior cingulate cortex (ACC, BA32) (Fletcher and Henson,
2001; Wager and Smith, 2003; Nee et al., 2013). Within this network, there is evidence for
relative functional specialisation according to process; the DLPFC has been intimately linked
to encoding, setting attentional priorities and manipulating information (D' Esposito et al.,
2000; Narayanan et al., 2005), the PAR has been associated with maintaining attentional
focus and storing information (Jonides et al., 1998; Guerin and Miller, 2011) and the ACC has
been implicated in error detection and performance adjustment (Carter et al., 1999).
Regional activation within this network responds to WM load (i.e. the total demand on
maintenance, updating and manipulation processes) (Braver et al., 1997; Callicott et al.,
1999; Owen et al., 1999; Volle et al., 2008) and may be sensitive to content being
left-lateralised for verbal and right-left-lateralised for spatial and object information (Fletcher and
Henson, 2001; Wager and Smith, 2003; Nee et al., 2013).
However, measures of regional engagement are not sufficient to characterise the
dynamic architecture of the WM network. To date, attempts to model inter-regional
relationships within the WM network have been based on minimizing the discrepancy
between observed and implied correlations between regional activations (Honey et al.,
2002; Narayanan et al., 2005; Axmacher et al., 2008; Esslinger et al., 2012). Although useful,
this approach provides limited information about specific mechanisms through which
neuronal circuits respond to WM demands (Ramnani et al., 2004; Kim et al., 2007). Of
4
evidence that abnormalities in short-term plasticity underlie WM impairment across a
range of conditions from normal aging (Sala-Llonch et al., 2012) to the major mental
disorders (Cramer et al., 2011). Short-term plasticity is conceptualized in many ways, but as
used here it refers to altered functional coupling within cortical circuits as a function of
experience and in response to external and internal cues (Salinas & Sejnowski, 2001;
Stephan et al., 2009). Dynamic Causal Modeling (DCM; Friston et al., 2003) currently
represents one of the most plausible methods for estimating the effective strength of
connections among neuronal ensembles and their context-dependent (e.g. experimental)
modulation (Stephan et al., 2010).
The aim of the current study was to probe the neural network that underlies
cognitive control in verbal WM and to determine the role of WM load on short-term
plasticity within this network. To achieve this we combined Statistical Parametric Mapping
(SPM; www.fil.ion.ucl.ac.uk/spm) with Dynamic Causal Modeling of functional magnetic
resonance imaging (fMRI) data derived from forty healthy adults performing the verbal
n-back task. This task involves maintenance and updating of information at increasing levels of
memory load and has been previously shown to engage robustly the DLPFC, PAR and ACC
(Wager and Smith, 2003; Owen et al., 2005). DCM analysis of individual responses to this
task allowed us to estimate the strength, laterality and directionality of the effective
functional coupling between these key nodes of the WM network and, crucially how these
5
Material and Methods
Participants
Forty healthy right-handed adults were recruited via advertisement in the local press
and were included if they (i) had no personal lifetime history of mental disorders or
substance use as assessed following personal interview using the Structured Interview for
DSM-IV-TR Axis I Disorders, non-patient edition (First et al., 2002), (ii) had no history of head
injury or medical disorders and (iii) did not take any prescribed medication. An estimate of
current intellectual function (IQ) was obtained using the Wechsler Adult Intelligence Scale –
Revised (WAIS-R; Wechsler, 1981). The sample details are shown in Table 1. The study was
approved by the Ethics Committee of the Institute of Psychiatry and the South London and
Maudsley National Health Service Trust. Written informed consent was obtained from all
participants.
Experimental design
The n-back task was employed in a block design incorporating alternating
experimental and baseline conditions. A series of letters in yellow font were displayed on a
blue screen for two seconds each. The 0-back condition was used as baseline to control for
task engagement and vigilance. In the 0-back condition participants were instructed to
respond by button press whenever the target letter “X” was displayed on screen. In the
experimental conditions (1, 2, 3-back), the target letter was defined as any letter that was
identical to the one presented 1, 2, or 3 trials back. There were 18 epochs in all, each lasting
30 seconds, comprising 14 letters with a ratio of target to non-target letters ranging from
2:12 to 4:10 per epoch. The entire experiment lasted 9 minutes and included a total of 49
6
pseudo-randomised. Performance was evaluated in terms of reaction time to target letters
and accuracy (% correct responses).
Image acquisition
Gradient echo planar magnetic resonance (MR) images were acquired using a
1.5-Tesla GE Neuro-optimised Signa MR system (General Electric, Milwaukee, WI, USA) fitted
with 40 mT/m highspeed gradients, at the Maudsley Hospital, London. Foam padding and a
forehead strap were used to limit head motion. A quadrature birdcage head coil was used
for radio frequency (RF) transmission and reception. A total of 180 T2*-weighted MR brain
volumes depicting blood-oxygen-level-dependent (BOLD) contrast were acquired at each of
36 near-axial, non-contiguous planes parallel to the inter-commissural (AC-PC) plane;
repetition time (TR) = 3000ms, echo time (TE) = 40ms, slice thickness = 3mm, voxel
dimensions = 3.75 x 3.75 x 3.30mm, matrix size = 64 * 64, flip angle=90°. Prior to each
acquisition sequence, four dummy data acquisition scans were performed to allow the
scanner to reach a steady state in T1 contrast.
During the same session, a high-resolution T1-weighted structural image was
acquired in the axial plane (inversion recovery prepared, spoiled gradient-echo sequence;
TR = 18ms, TE = 5.1 ms, TI = 450 ms, slice thickness = 1.5 mm, voxel dimensions = 0.9375 ×
0.9375 x 1.5 mm, matrix size 256 * 192, field of view = 240 x 180 mm, flip angle = 20°,
number of excitations = 1) for subsequent co-registration.
Image processing
All analyses were implemented using Statistical Parametric Mapping software,
version 8 (SPM8) (www.fil.ion.ucl.ac.uk/spm/software/spm8/). The BOLD images were
7
transformation with three rotation and three translation parameters. Subsequently, the 180
fMRI images were spatially normalized to the standard template of the Montreal
Neurological Institute (MNI) and re-sampled to a voxel size of 2x2x2 mm. Finally, the images
were smoothed using an 8 mm full width half maximum Gaussian kernel.
The smoothed single-participant images were analyzed via multiple regressions using
the linear convolution model, with vectors of onset representing the experimental
conditions (1, 2 and 3 - back) and the 0-back condition as a baseline. Six movement
parameters were also entered as nuisance covariates. Serial correlations were removed
using an AR(1) model. A high pass filter (128s) was applied to remove low-frequency noise.
Contrast images of each memory load condition versus baseline were produced for each
participant.
Conventional fMRI Analysis
Group-level analyses were based on random-effects analyses of the
single-participant contrast images using the summary statistic approach. Regions showing
significant task effect across all participants were identified using one-sample t-tests against
zero. The statistical threshold was set to p<0.05 with Family-Wise Error (FWE) correction on
a voxelwise basis and minimum cluster size 20 voxels. For all analyses, results are reported
in MNI space.
Dynamic Causal Modeling
Selection of volumes of interest (VOIs)
Volumes of interest (VOIs) were defined bilaterally in the PAR, ACC and DLPFC based
on evidence from prior studies demonstrating robust and consistent involvement of these
8
current analyses that found significant effects of WM load in these regions. The coordinates
for the VOIs were based on the group maxima from the contrast of 1, 2, 3 -back minus
0-back condition following conjunction analysis. The coordinates of the group maxima were:
DLPFC (left: x = -48, y = 36, z = 30; right; x = 48, y = 38, z = 30), PAR (left: x = -38, y = -56, z =
42; right: x = 36, y = -52, z = 44) and ACC (left: x = -10, y = 26, z = 28; right: x = 12, y =24, z
=28) and the). For each participant VOIs of 5mm radius were defined centred on
participant-specific maxima in these regions that were (i) within 4 mm from the group maxima, (ii)
within the same anatomical area, as defined by the PickAtlas toolbox (Maldjian et al., 2003)
and (iii) adjusted using the effect of interest F-contrast. Regional time series were
summarised with the first eigenvariate of all activated (at p < 0.01) voxels within the
participant-specific VOIs.
Specification of model architecture
For each experimental condition (1, 2, 3 –back) we used the VOIs defined above
(L-PAR and R-(L-PAR, L-ACC and R-ACC, and L-DLPFC and R-DLPFC) to specify a six-area DCM in all
participants. Within each hemisphere we defined bidirectional connections between these
regions. Bidirectional connections were also specified between homologous regions in each
hemisphere. For each experimental condition, 18 endogenous connections were specified in
total with the main effect of memory as the driving input entering the L-PAR and R-PAR
(Figure 1A). This architecture served as our base model which was then elaborated
systematically to produce 18 alternative variants for each experimental condition to test
how working memory load could modulate the 18 connections (Figure 1B). In total 54
9
Model Comparison
Model comparison was implemented using random-effects (RFX) Bayesian Model
Selection (BMS) in DCM10 to compute exceedance and posterior probabilities at the group
level (Stephan et al., 2009). The exceedance probability of a model denotes the probability
that this model is more likely than any other in a given dataset. In addition to testing
individual models we also made inferences about Families of models (Penny et al., 2010;
Stephan et al., 2010).
Families were specified based on laterality and direction of working memory
information. To test for hemispheric laterality, models were divided into a Left-sided
(Models 1, 3, 4, 5, 6, 7, 9, 10, 11) and a Right-sided Family (Models 2, 8, 12, 13, 14, 15, 16,
17, 18). To test for directionality of working memory information three Families where
created for each experimental condition, Forward (Models 3, 5, 10, 14, 16, 17), Backwards
(Models 4, 6, 9, 13, 15, 18) and Lateral (Models 1, 2, 7, 8, 11, 12). All models were included
in the BMS procedure, both when comparing individual models and model Families. Finally,
to summarise the strength of effective connectivity and quantify its modulation, we used
random effects Bayesian Model Averaging (BMA) to obtain average connectivity estimates
(weighted by their posterior model probability) across all models for each participant (Penny
et al., 2010). The implementation of RFX BMA in SPM8 employs an Occam’s window for
computational efficiency, excluding from the average those models whose probability ratio
(compared to the best model) is below 0.05.
10
We subjected participant-specific BMA parameter estimates to one-sample tests to
assess their consistency across participants. Behavioural data and DCM parameter estimates
were analyzed in SPSS 20 (SPSS Inc, Chicago, IL, USA) and statistical inference was set at a
threshold of p<0.002 following Bonferroni-correction for multiple comparisons.
Results
Behavioural data
Details of participants’ performance in the n-back task are shown in Table 1.
Conventional fMRI analysis
Task-related activation was evident within the predicted WM network including the
DLPFC, PAR and ACC. Details of the regional maxima are provided in Figure 2 and Table 2.
DCM analysis
Family-wise Comparisons
We applied random effects BMS at the Family level to clarify the contribution of
each hemisphere (Left: Models 1, 3, 4, 5, 6, 7, 9, 10, 11; Right: Models 2, 8, 12, 13, 14, 15,
16, 17, 18) and to elucidate the direction of information (Forward, Backward or Lateral) at
different memory loads. The Left-sided Family showed the highest exceedance probability
(65%; Figure 3A) in the 1-back modulation. This pattern reversed in the 2- and 3-back
modulations where the Right-sided Family showed exceedance probabilities of 60% and
98% respectively (Figures 3B and 3C).
With regards to directionality, in the 1-back modulation the Forward Family showed
11
probability of 32% (Figure 3A). In the 2- and 3-back modulations, the Forward Family
outperformed all others with an exceedance probability of 99% (Figure 3B and 3C).
Comparing individuals models
Comparing the individuals models in each memory load, did not reveal an optimal model for
the 1-back modulation (Figure 4A). On the contrary, for the 2-back memory load, Model 16
was the best fitting model with exceedance probability of 60%, where the modulation was
placed from the R-PAR to the R-DLPFC (Figure 4B). Model 5 was the second best model with
exceedance probability of 40%. In Model 5, 2-back modulated the forward connection from
L-PAR to L-DLPFC (Figure 4B).
For the 3-back task, Model 16 outperformed all other models with an exceedance
probability of 96%, where the 3-back memory load is modulating significantly the forward
connection from the R-PAR to the R-DLPFC (Figure 4C).
Bayesian Model Averaging
The results from the BMA across all subjects and across all fifty four models (18
models for each experimental condition) are shown in Table 3. All connections between the
six areas of the WM network were significant. BMA parameter estimates of the endogenous
connections were found to be significantly consistent across participants. The task condition
significantly modulated the forward connection from the R-PAR to the R-DLPFC (Table 3).
Behavioural Correlations
Based on the robust modulation of the connection from the R-PAR to the R-DLPFC by
increasing memory load we performed correlations between the DCM parameters for this
12
of this connection negatively correlated with response time (r= -0.331, p= 0.04) but not
accuracy in the 3-back condition.
Discussion
To our knowledge this is the first study to assess effective connectivity during WM
processing using DCM. DCM is currently one of the most plausible methods for inferring
neuroplastic changes in the strength of connections between neuronal populations and
their context specific (Stephan et al., 2010). There are three key findings from our study.
First, we demonstrated that increasing memory load was associated with increasing
dominance of right-hemisphere models suggesting greater right hemisphere contribution to
the most demanding WM conditions. Second, increasing memory load was associated with
increased forward (i.e. posterior to anterior) effective connectivity within the WM network.
Third, increasing memory load dramatically reduced individual variability in WM network
architecture with the right-hemisphere forward model reaching an exceedance probability
of 99% in the 3-back condition.
Early fMRI studies have lent support to the notion that processing within the WM
network is left-lateralised for verbal and right-lateralised for spatial material (Fletcher and
Henson, 2001). Recent quantitative meta-analyses have shown that engagement during
verbal WM tasks can be seen bilaterally within the DLPFC, PAR and ACC (Wager and Smith,
2003; Nee et al., 2013) although left-sided involvement was more common (Nee et al.,
2013). However previous studies (Altamura et al., 2007; Kirschen et al., 2005) as well as the
current study suggest that the key driver of lateralisation within the verbal WM network is
memory load. In the 1-back condition the Left-sided model Family showed an aggregate
13
showed an aggregate exceedance probability of 60%. These exceedance probabilities are
moderate and may be best interpreted as evidence that right or left hemispheric
involvement is nearly equally plausible at low to moderate WM demands. By contrast, in the
3-back condition, that places the highest demands on maintenance and updating processes,
the Right-sided model Family was dominant with an exceedance probability of 98%.
Previous literature has established that during a variety of WM tasks ipsilateral
frontoparietal cortical regions are functionally coupled (Esslinger et al., 2012; Cole and
Schneider, 2007; Schlosser et al., 2006). The current study provides new evidence regarding
the directionality of effective coupling within the verbal WM network. We found that
working memory information follows a posterior to anterior direction at moderate and high
WM load as the Forward model Family showed an exceedance probability of 99% in the 2-
and 3-back conditions. In particular the connection from the right PAR to the ipsilateral
DLPFC was most consistently modulated by WM across all participants; the strength of the
modulation increased with WM demands and was associated with reduced response time.
Our findings receive significant support from transcranial magnetic stimulation (TMS)
studies (Mottaghy et al., 2003; Esslinger et al., 2012; Meiron et al., 2012); TMS induced
increase in frontoparietal coupling improved response time without a significant effect on
accuracy. Correspondingly we observed a significant correlation between response time
(but not accuracy) and the strength of the WM modulation of the frontoparietal effective
connectivity. Mottaghy and colleagues (2003) were also able to determine using TMS at
variable time points and at different cortical sites that during the verbal n-back task
information propagated from posterior to anterior regions (parietal to prefrontal) and from
the right to the left prefrontal cortex. This observation is consistent with our findings
14
importance of the connection between right PAR and right DLPFC. Moreover, our data
further support the proposal of Mottaghy and colleagues (2003) that verbal WM
performance may rely on successful coding of the visual input of letters first as objects in
the right hemisphere and then as verbal concepts in the left hemisphere.
A feature of our experimental design merits comment. We employed the n-back
task as a fMRI block paradigm, which precludes the possibility of including only trials on
which participants answered correctly in our analysis. Considering the difference in
accuracy and reaction time between memory loads, as would be expected, future studies
investigating the effect of working memory may wish to employ tasks that permits that
kind of analysis. Furthermore, the DCM models in the current study were constructed to
probe cognitive control in the WM brain network. Future studies may also wish to include
brain areas typically engaged in verbal WM, such as left perisylvian regions (Rottschy et
al., 2012), to investigate the verbal WM network directly.
Finally we found that increasing WM load dramatically reduced variability in the
dynamic architecture of the WM network. The interest in short-term plasticity has
generated much research on the effect of task on neural variability at all levels. Task-related
reduction in variability has been observed throughout the cortex at the intracellular and
inter-cellular level affecting membrane potential as well as individual and correlated
neuronal firing (Churchland et al., 2010). Theoretical models have suggested similar
properties for large scale neural networks (Sussillo & Abbott, 2009; Rajan et al. 2012). Our
results provide direct empirical support for these models with regards to WM and further
15
Acknowledgements: This work was supported by a NARSAD Independent Investigator
Award 2008 (S.F.).
16
Altamura M, Elvevag B, Blasi G, Bertolino A, Callicott JH, Weinberger DR, Mattay VS,
Goldberg TE (2007): Dissociating the effects of Sternberg working memory demands
in prefrontal cortex. Psychiatry Research: Neuroimaging 154:103-114.
Axmacher N, Schmitz DP, Wagner T, Elger CE, Fell J (2008): Interactions between medial
temporal lobe, prefrontal cortex and inferior temporal regions during visual working
memory: A combined intracranial EEG and functional magnetic resonance imaging
study. J Neurosci 28:7304-7312.
Baddeley A (1992): Working Memory: The Interface between Memory and Cognition. J Cogn
Neurosci 4:281–288.
Braver TS, Cohen JD, Nystrom LE, Jonides J, Smith EE, Noll DC (1997): A parametric study of
prefrontal cortex involvement in human working memory. Neuroimage 5:49-62.
Callicott JH, Mattay VS, Bertolino A, Finn K, Coppola R, Frank JA, Goldberg TE, Weinberger
DR (1999): Physiological characteristics of capacity constraints in working memory as
revealed by functional MRI. Cereb Cortex 9:20-26.
Carter CS, Botvinick MM, Cohen JD (1999): The contribution of the anterior cingulate cortex
to executive processes in cognition. Rev Neurosci 10:49-57.
Churchland MM, Yu BM, Cunningham JP, Sugrue LP, Cohen MR, Corrado GS, Newsome WT,
Clark AM, Hosseini P, Scott BB, Bradley DC, Smith MA, Kohn A, Movshon JA,
Armstrong KM, Moore T, Chang SW, Snyder LH, Lisberger SG, Priebe NJ, Finn IM,
Ferster D, Ryu SI, Santhanam G, Sahani M, Shenoy KV (2010): Stimulus onset
quenches neural variability: a widespread cortical phenomenon. Nat Neurosci
13:369-78.
Cole MW, Schneider W (2007): The cognitive control network: Integrated cortical regions
17
Cramer SC, Sur M, Dobkin BH, O'Brien C, Sanger TD, Trojanowski JQ, Rumsey JM, Hicks R,
Cameron J, Chen D, Chen WG, Cohen LG, deCharms C, Duffy CJ, Eden GF, Fetz EE,
Filart R, Freund M, Grant SJ, Haber S, Kalivas PW, Kolb B, Kramer AF, Lynch M,
Mayberg HS, McQuillen PS, Nitkin R, Pascual-Leone A, Reuter-Lorenz P, Schiff N,
Sharma A, Shekim L, Stryker M, Sullivan EV, Vinogradov S (2011): Harnessing
neuroplasticity for clinical applications. Brain 134:1591–1609.
D'Esposito M, Postle BR, Rypma B (2000): Prefrontal cortical contributions to working
memory: Evidence from event-related fMRI studies. Exp Brain Res 133:3–11.
Esslinger C, Schüler N, Sauer C, Gass D, Mier D, Braun U, Ochs E, Schulze TG, Rietchel M,
Kirsch P, Meyer-Lindenberg A (2012): Induction and quantification of prefrontal
cortical network plasticity using 5Hz rTMS and fMRI. Hum Brain Mapp (in press) doi:
10.1002/hbm.22165
First MB, Spitzer RL, Gibbon M, Williams JBW. 2002. Structured Clinical Interview for DSM-IV
Axis I Disorders, Research Version, Non-patient Edition (SCID-I/NP). New York, NY:
Biometrics Research, New York State Psychiatric Institute.
Fletcher PC, Henson RN (2001): Frontal lobes and human memory: Insights from functional
neuroimaging. Brain 124:849–881.
Friston KJ, Harrison L, Penny WD (2003): Dynamic Causal Modeling. Neuroimage
19:1273-1302.
Glahn DC, Ragland JD, Abramoff A, Barrett J, Laird AR, Bearden CE, Velligan DI (2005):
Beyond hypofrontality: a quantitative meta-analysis of functional neuroimaging
studies of working memory in schizophrenia. Hum Brain Mapp 25:60-69.
Guerin SA, Miller MB (2011): Parietal cortex tracks the amount of information retrieved
18
Honey GD, Fu CH, Kim J, Brammer MJ, Croudace TJ, Suckling J, Pich EM, Williams SC,
Bullmore ET (2002): Effects of verbal working memory load on corticocortical
connectivity modeled by path analysis of functional magnetic resonance imaging
data. Neuroimage 17:573-582.
Jonides J, Schumacher EH, Smith EE, Koeppe RA, Awh E, Reuter-Lorenz PA, Marshuetz C,
Willis CR (1998): The role of parietal cortex in verbal working memory. J Neurosci
18:5026 –5034.
Kim JS, Jung WH, Kang DH, Park JY, Jang JH, Choi JS, Choi JH, Kim J, Kwon JS (2012): Changes
in Effective Connectivity According to Working Memory Load: An fMRI Study of Face
and Location Working Memory Tasks. Psychiatry Investig 9:283-292.
Kim J, Zhu W, Chang L, Bentler PM, Ernst T (2007): Unified Structural Equation Modeling
Approach for the Analysis of Multisubject, Multivariate Functional MRI Data. Hum
Brain Map 28:85-93.
Kirschen MP, Chen ASH, Schraedley-Desmond P, Desmond JE (2005): Load- and
practice-dependent increases in cerebro-cerebellar activation in verbal working memory: an
fMRI study. NeuroImage 24:462-472.
Maldjian JA, Laurienti PJ, Kraft RA, Burdette JH (2003): An automated method for
neuroanatomic and cytoarchitectonic atlas-based interrogation of fMRI data sets.
Neuroimage 19:1233-1239.
Meiron O, Lavidor M (2013): Unilateral prefrontal direct current stimulation effects are
modulated by working memory load and gender. Brain Stimul 6:440-447.
Mottaghy FM, Gangitano M, Krause BJ, Pascual-Leone A (2003): Chronometry of parietal
and prefrontal activations in verbal working memory revealed by transcranial
19
Narayanan NS, Prabhakaran V, Bunge SA, Christoff K, Fine EM, Gabrieli JDE (2005): The role
of the prefrontal cortex in the maintenance of verbal working memory: an
event-related fMRI analysis. Neuropsychology 19:223-232.
Nee DE, Brown JW, Askren MK, Berman MG, Demiralp E, Krawitz A, Jonides J (2013): A
meta-analysis of executive components of working memory. Cereb Cortex
23:264-282.
Owen AM, Herrod NJ, Menon DK, Clark JC, Downey SPMJ, Carpenter TA, Minhas PS,
Turkheimer FE, Williams EJ, Robbins TW, Sahakian BJ, Petrides M, Pickard JD (1999):
Redefining the functional organization of working memory processes within human
lateral prefrontal cortex. Eur J Neurosci 11:567-574.
Owen AM, McMillan KM, Laird AR, Bullmore ET (2005): N-back working memory paradigm: a
meta-analysis of normative functional neuroimaging studies. Hum Brain Mapp
25:46-59.
Paulesu E, Frith CD, Frackowiak, RS (1993): The neural correlates of the verbal component of
working memory. Nature362:342–345.
Penny WD, Stephan KE, Daunizeau J, Rosa MJ, Friston KJ, Schofield TM, Leff AP (2010):
Comparing Families of Dynamic Causal Models. PLoS Comput Biol 6:1-14.
Rajan K, Abbott LF, Sompolinsky H (2010): Stimulus-dependent suppression of chaos in
recurrent neural networks. Phys Rev E Stat Nonlin Soft Matter Phys 82:011903.
Ramnani N, Behrens T, Penny WD, Matthews PM (2004): New approaches for exploring
anatomical and functional connectivity in the human brain. Biol Psychiatry 56:613–
20
Rottschy C, Langner R, Dogan I, Reetz K, Laird AR, Schulz JB, Fox PT, Eickhoff SB (2012):
Modelling neural correlates of working memory: a coordinate-based
meta-analysis. Neuroimage 60:830-846.
Salinas E, Sejnowski TJ (2001): Gain modulation in the central nervous system: where
behavior, neurophysiology, and computation meet. Neuroscientist 7:430-440.
Sala-Llonch R, Peña-Gómez C, Arenaza-Urquijo EM, Vidal-Piñeiro D, Bargalló N, Junque
Carme, Bartres-Faz D (2012): Brain connectivity during resting state and subsequent
working memory task predicts behavioural performance. Cortex 48:1187-1196.
Schlosser RG, Wagner G, Sauer H (2006): Assessing the working memory network: Studies
with functional magnetic resonance imaging and structural equation modeling.
Neuroscience 139:91–103.
Stephan KE, Baldeweg T, Friston KJ (2006): Synaptic plasticity and dysconnection in
schizophrenia. Biol Psychiatry 59:929-939.
Stephan KE, Penny WD, Daunizeau J, Moran RJ, Friston KJ (2009): Bayesian model selection
for group studies. Neuroimage 15:1004-1017.
Stephan KE, Penny WD, Moran RJ, den Ouden HEM, Daunizeau J, Friston KJ (2010): Ten
simple rules for dynamic causal modeling. Neuroimage 49:3099-3109.
Sussillo D, Abbott LF (2009): Generating coherent patterns of activity from chaotic neural
networks. Neuron 63:544-557.
Volle E, Kinkingnéhun S, Pochon JB, Mondon K, Thiebaut de Schotten M, Seassau M, Duffau
H, Samson Y, Dubois B, Levy R (2008): The functional architecture of the left
posterior and lateral prefrontal cortex in humans. Cereb Cortex 18:2460-2469.
Wager TD, Smith EE (2003): Neuroimaging studies of working memory: a meta-analysis.
21
Wechsler D. 1981. Manual for the Wechsler Adult Intelligence Scale—Revised. New York,
22
Figure Legends
Figure 1. Model specification: The sources comprising the models were: DLPFC: dorsolateral
prefrontal cortex; PAR: parietal; ACC: dorsal anterior cingulate cortex; left and right.
Schematically, the modulations are represented as one memory load (•), but correspond to
the three distinct modulations: 1-back, 2-back and 3-back. A. A six-area DCM was specified
with bidirectional endogenous connections between all regions (PAR, ACC, DLPFC) in each
hemisphere and lateral connections between homologous areas. Driving input of ‘1, 2, 3
-back’ modelled into the left and right PAR. B. For each memory load (1, 2, 3 -back condition)
18 models were constructed.
Figure 2. A. Image showing task-related brain activation in the group (N=40) during the
working memory N-back task (FWE, corrected at p<0.05 on a voxelwise basis, minimum
cluster size 20 voxels; image created with MRIcron
http://www.mccauslandcenter.sc.edu/mricro/mricron/index.html). B. The effect of the 1, 2,
3 -back conditions on the left and right parietal cortex (PAR), the left and right anterior
cingulate cortex (ACC), left and right dorsolateral prefrontal cortex (DLPFC) in healthy
participants (N=40).
Figure 3. A. Family Exceedance Probability for the Left- and Right-sided Family, as well as
the Forward, Backward and Lateral Family in the 1-back condition (N=40). B. Family
Exceedance Probability for the Left and Right-sided Family, as well as the Forward,
23
Probability for the Left and Right-sided Family, as well as the Forward, Backward and Lateral
Family in the 3-back condition (N=40).
Figure 4A. Exceedance Probability for the eighteen models specified (N=40) in the 1-back
condition. Yellow lines represent the Models that have Exceedance Probability above 5%. B.
Exceedance Probability for the eighteen models specified (N=40) in the 2-back condition.
Yellow lines represent the two winning models, Model 5 and Model 16. C. Exceedance
Probability for the eighteen models specified (N=40) in the 3-back condition. Yellow line
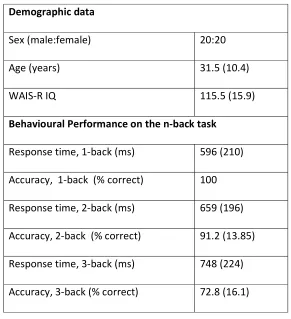
Table 1. Demographic and behavioural data of study participants (n=40)
Continuous variables are presented as mean and standard deviation; WAIS-R=Wechsler Adult Intelligence Scale-Revised
Demographic data
Sex (male:female) 20:20
Age (years) 31.5 (10.4)
WAIS-R IQ 115.5 (15.9)
Behavioural Performance on the n-back task
Response time, 1-back (ms) 596 (210)
Accuracy, 1-back (% correct) 100
Response time, 2-back (ms) 659 (196)
Accuracy, 2-back (% correct) 91.2 (13.85)
Response time, 3-back (ms) 748 (224)
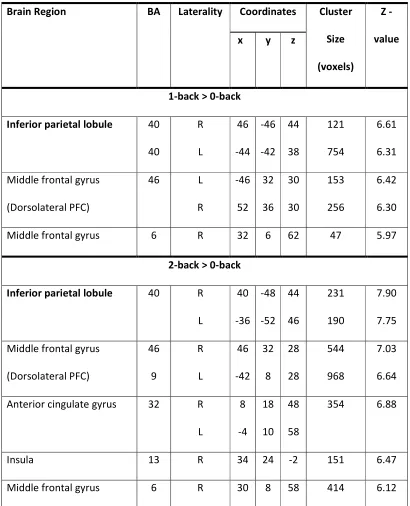
Table 2. Voxel-based whole brain SPM analysis: Brain regions showing significant main
effects in terms of hemodynamic responses to different working memory loads; 1, 2, 3 -back
(p < 0.05, FWE cluster-level corrected across the whole brain with minimum cluster size 20
voxels).
Brain Region BA Laterality Coordinates Cluster
Size
(voxels)
Z
-value x y z
1-back > 0-back
Inferior parietal lobule 40
40 R L 46 -44 -46 -42 44 38 121 754 6.61 6.31
Middle frontal gyrus
(Dorsolateral PFC)
46 L
R -46 52 32 36 30 30 153 256 6.42 6.30
Middle frontal gyrus 6 R 32 6 62 47 5.97
2-back > 0-back
Inferior parietal lobule 40 R
L 40 -36 -48 -52 44 46 231 190 7.90 7.75
Middle frontal gyrus
(Dorsolateral PFC) 46 9 R L 46 -42 32 8 28 28 544 968 7.03 6.64
Anterior cingulate gyrus 32 R
L 8 -4 18 10 48 58
354 6.88
Insula 13 R 34 24 -2 151 6.47
[image:26.612.92.502.201.707.2]3-back > 0-back
Inferior parietal lobule 40 R
L 50 -48 -42 -48 42 48 287 263 8.01 7.98
Middle frontal gyrus
(Dorsolateral PFC) 9 46 L R -48 48 26 40 30 30 800 542 8 7.99
Anterior cingulate gyrus 32 L
R -10 8 26 20 30 28
333 7.53
Insula 13 L -34 22 0 680 6.99
Thalamus N/A L -12 -10 6 142 6.44
Inferior frontal gyrus 10 L -44 46 2 319 5.98
Inferior frontal gyrus 47 R 34 20 0 572 5.67
Sophia Frangou
[image:28.612.88.549.146.708.2]1
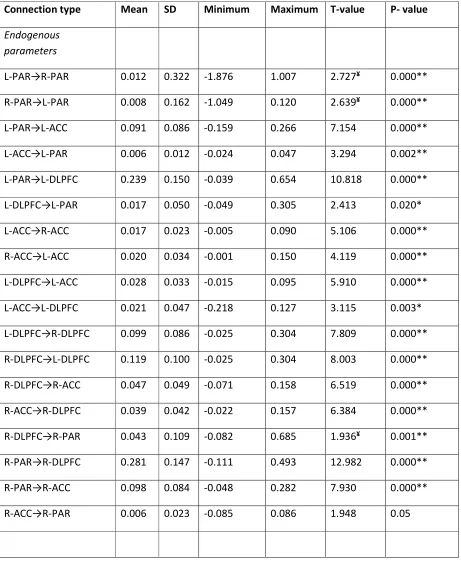
Table 3. Dynamic Causal Modeling endogenous parameter and modulatory estimates for all
connections across all subjects and across all models.
Connection type Mean SD Minimum Maximum T-value P- value
Endogenous
parameters
L-PAR→R-PAR 0.012 0.322 -1.876 1.007 2.727¥ 0.000**
R-PAR→L-PAR 0.008 0.162 -1.049 0.120 2.639¥ 0.000**
L-PAR→L-ACC 0.091 0.086 -0.159 0.266 7.154 0.000**
L-ACC→L-PAR 0.006 0.012 -0.024 0.047 3.294 0.002**
L-PAR→L-DLPFC 0.239 0.150 -0.039 0.654 10.818 0.000**
L-DLPFC→L-PAR 0.017 0.050 -0.049 0.305 2.413 0.020*
L-ACC→R-ACC 0.017 0.023 -0.005 0.090 5.106 0.000**
R-ACC→L-ACC 0.020 0.034 -0.001 0.150 4.119 0.000**
L-DLPFC→L-ACC 0.028 0.033 -0.015 0.095 5.910 0.000**
L-ACC→L-DLPFC 0.021 0.047 -0.218 0.127 3.115 0.003*
L-DLPFC→R-DLPFC 0.099 0.086 -0.025 0.304 7.809 0.000**
R-DLPFC→L-DLPFC 0.119 0.100 -0.025 0.304 8.003 0.000**
R-DLPFC→R-ACC 0.047 0.049 -0.071 0.158 6.519 0.000**
R-ACC→R-DLPFC 0.039 0.042 -0.022 0.157 6.384 0.000**
R-DLPFC→R-PAR 0.043 0.109 -0.082 0.685 1.936¥ 0.001**
R-PAR→R-DLPFC 0.281 0.147 -0.111 0.493 12.982 0.000**
R-PAR→R-ACC 0.098 0.084 -0.048 0.282 7.930 0.000**
R-ACC→R-PAR 0.006 0.023 -0.085 0.086 1.948 0.05
Sophia Frangou
2
Connection type Mean SD Minimum Maximum T-value P- value
Modulatory
parameters in 3-back
R-PAR→R-DLPFC 0.102 0.073 -0.039 0.292 9.431 0.000**
Legend for Supplemental Figure 1.
The sources comprising the models were: DLPFC: dorsolateral prefrontal cortex; PAR:
parietal; ACC: dorsal anterior cingulate cortex; left and right. A six-area DCM was specified
with bidirectional endogenous connections between all regions (PAR, ACC, DLPFC) in each
hemisphere and lateral connections between homologous areas. Driving input of ‘1, 2, 3
-back’ modelled into the left and right PAR. Schematically, the modulations are represented
as one memory load (•), but correspond to the three distinct modulations: 1-back, 2-back