City, University of London Institutional Repository
Citation
:
Casu, B., Clare, A., Sarkisyan, A. and Thomas, S. (2013). Securitization and Bank Performance. Securitization and Bank Performance, 45(8), pp. 1617-1658. doi: 10.1111/jmcb.12064This is the accepted version of the paper.
This version of the publication may differ from the final published
version.
Permanent repository link:
http://openaccess.city.ac.uk/5948/Link to published version
:
http://dx.doi.org/10.1111/jmcb.12064Copyright and reuse:
City Research Online aims to make research
outputs of City, University of London available to a wider audience.
Copyright and Moral Rights remain with the author(s) and/or copyright
holders. URLs from City Research Online may be freely distributed and
linked to.
City Research Online: http://openaccess.city.ac.uk/ [email protected]
1
Securitization and Bank Performance
Barbara Casu Andrew Clare Anna Sarkisyan Stephen Thomas
* We thank Robert DeYoung (the Editor) and two anonymous referees, whose comments substantially improved this paper. We are also grateful to Alberto Abadie, Elena Beccalli, Elena Kalotychou, Philip Molyneux, Paulo Soares de Pinho, Alberto Pozzolo, Lorenzo Trapani, John O.S. Wilson, and Simon Wolfe for valuable comments and discussions on earlier drafts of this paper. We also thank seminar participants at the British Accounting and Finance Association (BAFA), Cass Business School, Catholic University of Milan, Essex Business School, and Wolpertinger Club for stimulating discussions.
2
ABSTRACT
Using predominantly pre-crisis US commercial bank data, this paper employs a propensity
score matching approach to analyze whether individual banks did improve their
performance through securitization. On average, our results show that securitizing banks
tend to be more profitable institutions, with higher credit risk exposure. Despite a more
diversified funding structure, they face higher funding costs. We also find that securitizing
banks tend to hold larger and less diversified loan portfolios, have less liquidity, and hold
less capital. However, our analysis does not provide evidence to suggest that
securitization had an impact upon bank performance.
JEL codes: G21; G32
3
1 INTRODUCTION
Before the recent financial crisis proponents of securitization, which included the
banks themselves, as well as investors, regulators, and governments, believed that this
activity helped improve bank performance. In addition, it was generally perceived that
securitization promoted a more efficient allocation of risk and a relaxation of constraints on
credit availability, therefore providing social benefits in addition to private ones. We can
now see that the securitization trend also led to an increase in systemic risk that
crystallized with the collapse of Lehman Brothers. Since then, several studies have
investigated the link between securitization and financial instability (BIS 2008, Shin 2009).
This literature generally concludes that credit risk transfer techniques (CRT) undermine
financial stability and emphasizes the misalignment of incentives between banks and
investors in the securitization process.1 A number of other recent papers provide evidence
to suggest that securitization went hand in hand with a decline in credit standards,
particularly in relation to the securitization of subprime mortgages (Mian and Sufi 2009,
Keys et al. 2010, Elul 2011, Dell’Ariccia, Igan, and Laeven 2012).
Despite the weaknesses in the securitization process revealed by the crisis,
policy-makers as well as market practitioners, acknowledge its potential benefits and are
currently attempting to revive the market by increasing transparency and by introducing
changes in terms of simplicity and standardization.2 These new policies aim to ensure that
securitization remains beneficial and that potential risks do not outweigh potential benefits,
both at the individual bank level and for the market as a whole.
We contribute to the ongoing securitization debate by assessing whether individual
banks had improved their performance through accessing the securitization market in the
run up to the crisis. Economic theory tells us that, by using securitization, a bank may be
able to improve its performance through a number of channels, including lower funding
4
performance benefits from the originating bank’s perspective can be substantial, in
practice the key to their realization lies in the quality of the underlying assets, which in turn
is directly related to the underwriting and credit risk management employed by the banks
(FDIC 2007). As a result, the net impact of securitization remains ambiguous. It is
therefore important that we establish at the individual bank level whether securitization
enhances the performance of securitizing banks. To this end, in this paper we estimate the
effects of securitization on a number of bank performance indicators, including: (i) cost of
funding; (ii) credit risk; (iii) profitability; (iv) interest income and expense structure; (v)
liquidity; (vi) loan portfolio; (vii) capital; and finally (viii) growth.
An important issue that arises when attempting to estimate the effect of securitization
on bank performance is that the choice to securitize may be endogenous, that is, banks
determine whether they want to access the securitization market and when. To address
self-selection concerns with regard to the endogeneity of the decision to securitize, two
common approaches have been used in the literature: instrumental variables (IV) and
Heckman selection estimators. However, both approaches suffer from a number of issues.
The IV method requires the existence of at least one instrumental variable that determines
the treatment and is unrelated to unobserved heterogeneity; but the choice of this
instrument might create potential issues. While the Heckman selection estimator is more
robust than the instrumental variables estimator, it is more demanding on the assumptions
about the structure of the model (Blundell and Dias 2000).
Our empirical design seeks to address self-selection concerns with regard to the
endogeneity of the securitization decision by applying a propensity score matching
approach. To our knowledge, this methodology has not been employed in this context in
the past, and thus represents the key methodological contribution of our paper.
Specifically, we estimate the securitization effect on the change in the performance of
5
known as a difference-in-differences or double-difference matching strategy, where the
first difference removes the unobserved heterogeneity and restores conditional
independence and the second difference produces the impact estimate.
Our univariate analysis of securitizing and non-securitizing US commercial banks
between 2001 and 2008 shows that securitizing banks tend to be more profitable
institutions, have higher credit risk exposure, and have a more diversified funding
structure. We also find that they have higher funding costs and tend to hold larger and less
diversified loan portfolios, are less liquid, and hold less capital. However, our propensity
score matching analysis does not provide evidence to suggest that securitization had an
impact upon bank performance. For non-securitizing banks that have similar ex-ante
characteristics to first-time securitizers, we find instead that the use of alternative
performance-enhancing techniques had a similar impact. Therefore, the results presented
in this paper show that securitization did not, on average, improve the performance of
individual banks compared to adequately matched non-securitizing banks. Rather our
evidence suggests that securitization allowed banks to maintain risky and more profitable
activities. Finally, our results seem to support previous evidence that in the run up to the
crisis the risks associated with increasingly complex securitization structures outweighed
the benefits.
The rest of this paper is organized as follows: Section 2 reviews the relevant
literature; Section 3 discusses methodological issues in estimating the effect of
securitization on bank performance and introduces the propensity score matching
approach used in this paper; Section 4 presents the data and preliminary univariate
analysis; Section 5 lays out the implementation of the propensity score matching; Section 6
presents the results of the propensity score matching analysis; and finally, Section 7
6
2 LITERATURE REVIEW
Securitization involves a bank transforming its (usually) illiquid assets, that are
traditionally held until maturity, into marketable securities by pooling these assets and
transferring them into a special purpose vehicle (SPV), a bankruptcy-remote entity that in
turn finances the purchase through the issuance of securities backed by the pool. Between
the early 1990s and 2008 there was a tremendous increase in the size of securitization
markets. In the US, the outstanding volume of mortgage-backed securities increased from
$2.3 trillion in 1994 to $8.4 trillion by the end of 2008, while the market for asset-backed
securities increased from $192 billion to $2.6 trillion over the same period. In Europe, at
year-end 2008, the outstanding volume of mortgage-backed securities reached about $2
trillion (from $26 billion in 1994), while the market for asset-backed securities reached
$299 billion (from $5 billion in 1994).4 According to the International Monetary Fund (IMF
2009), asset-backed securities and covered bonds provided between 20 per cent and 60
per cent of the funding for new residential mortgage loans originated in mature economies
before the credit crisis of 2008. After this extended period of rapid expansion,
securitization markets froze in late 2008 following the collapse of Lehman Brothers. The
impact of the crisis on securitization markets has since been well documented
(Brunnermeier 2009, Gorton 2010, BIS 2011).
With the rapid growth in the market for securitized assets, there existed a substantial
academic literature that focused on both the possible benefits of securitization as well as
the main drivers and effects of the process.5 Below we briefly review this literature.
7
Early studies of securitization focused on its potential economic benefits. Greenbaum
and Thakor (1987), Pavel and Phillis (1987), and Hess and Smith (1988) suggest that
securitization provides a means of reducing risk, of diversifying portfolios, and of funding
both ongoing operations and the purchase of new assets. Greenbaum and Thakor suggest
that securitization allows banks to specialize in activities of comparative advantage while
shifting the activities of comparative disadvantage. Rosenthal and Ocampo (1988) argue
that securitization offers banks a way of lowering their cost of financing. Boot and Thakor
(1993) show that, in the presence of asymmetric information, pooling assets and issuing
multiple financial claims with different risk characteristics against the pool cash flow
enables the issuer to increase its expected revenue. Empirical evidence consistent with
the profitability-enhancing theory of securitization is found by Bannier and Hänsel (2008)
and by Affinito and Tagliaferri (2010).
Flannery (1994), Lockwood, Rutherford, and Herrera (1996), and James (1988)
consider the role of securitization in mitigating the underinvestment problem of financial
intermediaries. Lockwood, Rutherford, and Herrera suggest that the cash inflow from the
issuance of asset-backed securities can be used to retire existing debt, which in turn
reduces interest expense and increases reported earnings. More recently, Chiesa (2008)
suggests that optimal credit risk transfer (which can be achieved via securitization)
reduces the amount of capital that a bank must stake in order for it to be
incentive-compatible to screen and monitor its loans. As a consequence, Chiesa argues that
securitization can enhance loan monitoring, leading to an increase in the volume of
financial intermediation and an improvement in welfare.
8
Another branch of the literature focuses on the economic motives that encourage
banks to securitize. Theory provides us with three main determinants: (i) funding
requirements; (ii) risk sharing; and (iii) profitability. One fourth theory puts forward the role
of capital and the potential for regulatory arbitrage because securitization allows banks to
adjust their regulatory capital ratios.
Donahoo and Shaffer (1991) suggest that deposit-taking institutions securitize to
reduce reserve and capital requirements. But Jones (2000) argues that “regulatory capital
arbitrage” is not the only incentive to engage in securitization and suggests that banks will
also securitize to benefit from increased economies of scale, to reduce the costs of debt
financing, and to diversify funding sources. Minton, Sanders, and Strahan (2004) and
Calomiris and Mason (2004) provide empirical tests of the regulatory arbitrage hypothesis
against the efficient contracting hypothesis, which suggests that securitization lowers the
cost of debt finance. The evidence from both studies supports the efficient contracting
view. In particular, Minton, Sanders, and Strahan find that unregulated finance companies
and investment banks are more likely to securitize than commercial banks; in addition,
risky and highly leveraged financial institutions are more likely to engage in securitization
than safer ones. Bannier and Hänsel (2008) find consistent results using data on
European banks’ collateralized loan obligation transactions. The authors conclude that the
securitization market seems to be driven by credit risk management and liquidity raising
incentives, rather than by regulatory capital arbitrage. Recent work by Panetta and
Pozzolo (2010) indicates that banks are more likely to securitize when they face lower
direct and indirect costs. They also find evidence to suggest that banks securitize to
modify their asset portfolio, allowing them to take up riskier profit opportunities. Using a
sample of Italian bank data, Affinito and Tagliaferri (2010) analyze the ex-ante
9
profitable banks with higher levels of non-performing loans are more likely to securitize,
and in larger amounts.
2.3 The Effects of Securitization
Another strand of research has focused on the effects of securitization on the
originating banks. Some studies have focused on the quality of assets securitized. Dionne
and Harchaoui (2003) find evidence to suggest that regulation encouraged banks to hold
more risky assets and to securitize their lower risk assets. Ambrose, LaCour-Little, and
Sanders (2005) also found that in response to regulatory capital incentives lenders tended
to retain riskier loans in their portfolios. However, Carey (1998) shows that the default
rates on loans retained by the originator were lower than the default rates on the loans
sold to other investors, which implies that banks tend to retain higher quality loans.
Similarly, recent studies by Mian and Sufi (2009), Keys et al. (2010), and Dell’Ariccia, Igan,
and Laeven (2012) find evidence to suggest that US banks securitized their worst
mortgage loans over the last decade. Calem, Henderson, and Liles (2010) also confirm
this view with findings of evidence of "cream-skimming" behavior during the subprime
lending boom. Krainer and Laderman (2011) explore the factors that determine which
loans are securitized. The results show that the loans chosen by lenders for private-label
securitizations tend to be riskier than the loans retained in their own portfolios.
Other researchers have investigated the implicit recourse commonly provided by the
originating bank and the resulting risk and performance implications for the issuer.
Calomiris and Mason (2004) and Higgins and Mason (2004) argue that risk remains with
the securitizing banks as a result of implicit recourse. Chen, Liu, and Ryan (2008) find that
risk retention by banks varies by type of securitization and is relatively low in the case of
10
Similarly, Vermilyea, Webb, and Kish (2008) find evidence of implicit recourse in credit
card securitizations. In particular, they show that banks that securitize credit card
receivables, and banks with poorly performing securitization portfolios, are more likely to
claim fraud losses on securitized assets which are borne by the originator as opposed to
credit losses incurred by the owner of the assets, that is, by the SPV. Higgins and Mason
identify beneficial effects of recourse which arise in the form of increased short- and
long-term stock returns and improved long-long-term performance. This evidence is consistent with
that of Gorton and Souleles (2006), who find that market prices of asset-backed securities
reflect the originator’s ability to provide recourse. Barth, Ormazabal, and Taylor (2012)
examine whether credit rating agencies and the bond market have a different view of the
sources of credit risk. They find that while credit rating agencies view securitizations as
asset sales, bond market participants view securitizations as secured borrowing.
Finally, some authors have focused on the reinvestment of securitization proceeds.
Cebenoyan and Strahan (2004) find evidence to suggest that banks use the risk-reducing
benefits of securitization to engage in more profitable but higher risk activities and to
operate with greater financial leverage. Purnanandam (2011) also provides evidence to
suggest that US banks used the proceeds from securitizations to issue loans with higher
than average default risk. In particular, the author shows that US banks that used credit
risk transfer techniques to a larger extent before the 2007 subprime crisis had significantly
higher mortgage charge-offs after the crisis. On the other hand, Jiangli and Pritsker (2008)
suggest a positive role for mortgage securitization and relate the recent turmoil in
mortgage credit and securitization markets to recent excesses in those markets. Finally,
Nadauld and Weisbach (2011) investigate whether securitization-driven demand for
corporate bank loans had an impact on the cost of corporate debt. Their results indicate
that yield on a loan that was subsequently securitized was 15 basis points lower, on
11
provides evidence to support the view that securitization led to a reduction in the cost of
corporate debt.
Overall, the existing literature has focused on different aspects of the securitization
process, but has not provided comprehensive evidence of the impact of securitization on
bank performance. While in theory there may well be benefits of accessing the
securitization market from the originating bank’s perspective, the empirical evidence to
date seems to suggest that it went hand in hand with a decline in credit standards.
Evidence also suggests that banks used the proceeds from securitizations to engage in
more profitable but higher risk activities and to operate with greater financial leverage. We
therefore believe that it is important to establish whether securitization enhances the
performance of securitizing banks at the individual bank level, otherwise in the rush to
condemn the process of securitization we run the risk of throwing the baby out with the
bath water. Using US commercial banking data for individual banks from 2001 to 2008, we
contribute to the existing literature by evaluating the effects of securitization on several
bank performance indicators, including cost of funding, credit risk, and profitability. In
addition, the methodology that we apply in this paper augments the existing literature by
addressing the self-selection concerns with regard to the endogeneity of the decision to
securitize by applying a propensity score matching approach. We now turn to the empirical
design of our research.
3 EMPIRICAL DESIGN
In this section, we first discuss the methodological issues in estimating securitization
effects and then introduce the propensity score matching approach used in this paper to
address those issues.
12
The analysis of the effect of securitization on bank performance gives rise to several
methodological issues, particularly, self-selection concerns with regard to the endogeneity
of the decision to securitize. First, comparing securitizing banks with non-securitizers might
yield biased estimates of the securitization effect because the performance of
non-securitizers may differ systematically from the performance of non-securitizers in the absence
of securitization. Therefore, if securitizers are found to perform better, on average, than
non-securitizers, the difference may be due to the effect of having accessed the
securitization market or to differences in banks' characteristics prior to securitization.
Second, considering only securitizing banks eliminates the possibility of a hypothetical
benchmark, that is, the performance that banks would have had, had they not securitized.
Furthermore, the observed change in performance might be due to shocks affecting all
banks equally.6
In an attempt to identify the effect of securitization on bank performance, in this paper
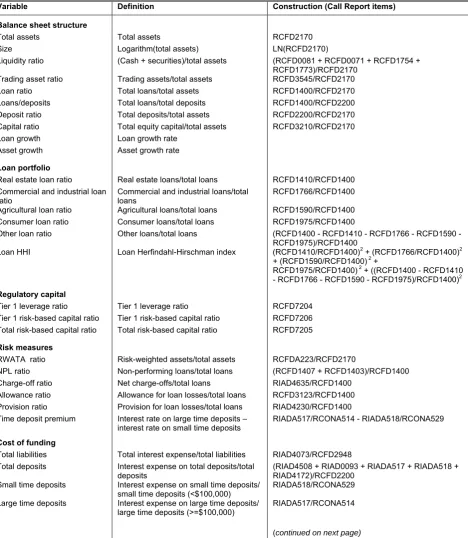
we focus on first-time securitizers. To understand our choice of analysis, consider the
following three types of bank:
(i) “securitizers”, that is, banks that have undertaken at least one securitization
transaction at the beginning of an observation period;
(ii) “non-securitizers”, that is, banks that do not engage in securitization throughout the
observation period; and
(iii) “first-time securitizers”, that is, banks that switch from being non-securitizers to
being securitizers during the observation period (at time t) by conducting their first
securitization transaction.
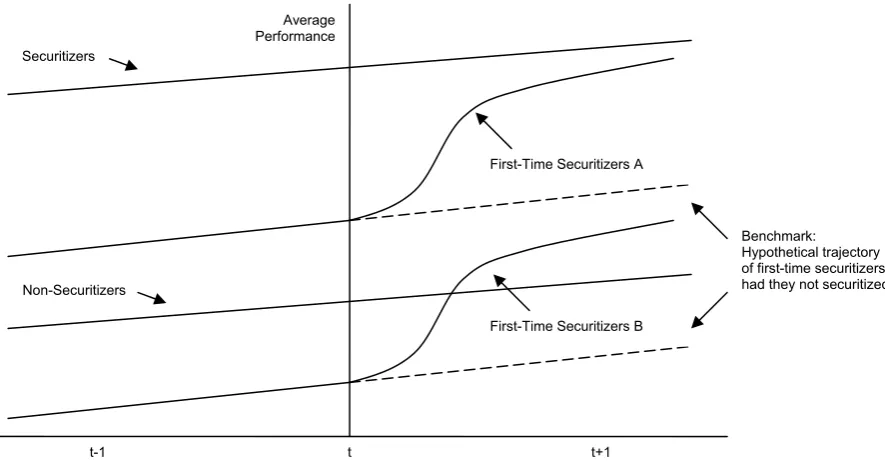
Figure 1 illustrates the theoretical trajectories of average performances of the three
types of bank and their relative positions. Recall that the proponents of securitization argue
13
number of channels as discussed earlier. Therefore, securitizing banks are assumed to
perform better than non-securitizing ones. This is reflected in Figure 1 by drawing the
performance trajectory of securitizers above the performance trajectory of non-securitizers.
However, as noted above, this could be because securitizers were better performers prior
to securitization and/or the consequence of using the securitization market.
<Insert Figure 1 about here>
Looking at first-time securitizers might help to disentangle the securitization effect.
Specifically, if securitization has a positive impact on bank performance, the latter should
improve once these banks start to securitize. As shown in Figure 1, the performance
trajectory of first-time securitizers should become steeper and closer to that of securitizers
after time t.
To test this hypothesis, we need to know what would have happened to the
performance of first-time securitizers had they not securitized. Because it is impossible to
observe the same bank in both states, we need to find an appropriate proxy for the
counterfactual performance of first-time securitizers. In other words, we need to find a
proxy for the dotted lines in Figure 1.
Good candidates for the counterfactual are non-securitizing banks. The performance
trajectory of the non-securitizers after time t could be considered a proxy for the dotted
lines. However, this comparison would still entail a selection problem (Heckman and Smith
1995) - first-time securitizers might be ex-ante different from those that never access the
securitization market. Specifically, these banks might be either better or worse performers
at time t-1 compared to non-securitizers, which is reflected by the trajectories “First-Time
Securitizers A” and “First-Time Securitizers B”, accordingly.
To overcome this issue and to disentangle the securitization effect, the ex-post
performance of first-time securitizers (at time t+1) should be compared with that of
14
Therefore, we need to build a control group from the non-securitizers whose performance
trajectory lies as close as possible to that of the first-time securitizers at time t-1. To
construct this control group, we apply a propensity score matching approach.
3.2 The Propensity Score Matching (PSM) Approach
Matching has become a popular non-parametric approach for estimating causal
effects and it is widely used in policy impact analysis. Although it is a relatively new
technique in the finance literature, this method has been applied in the past to the question
of diversification (Villalonga 2004), in the context of foreign investment (Barba Navaretti
and Castellani 2008), and to the decision of firms to go public (Saunders and Steffen
2011). The idea and methodology can be applied in any study where it is possible to
identify: (i) a treatment; (ii) a group of treated units; and (iii) a group of non-treated units
(Caliendo and Kopeinig 2008). In this study we apply propensity score matching (PSM) to
gauge the causal effect of securitization on bank performance, with the first securitization
considered as the treatment, the first-time securitizers as the group of treated units, and
the non-securitizers as the group of non-treated units.
To estimate the causal effect of securitization, we need to know what would have
happened to the performance of securitizing banks had they not securitized. To do so, let
it
S be a variable indicating securitization activity and taking a value equal to one if bank i
conducts a securitization transaction for the first time in period t. Let 1
1
yit be the
performance change of bank i at time t+1 after having securitized assets in period t and let
0 1
yit be the hypothetical performance change of the same bank i at the same time t+1
15
securitization on the performance of bank i, known in the evaluation literature as the
average treatment effect on the treated, can be expressed as:
) 1 | ( ) 1 |
( 1 1 0 1
E yit Sit E yit Sit
(1)
In equation (1), E(yit01 |Sit 1), which represents the counterfactual mean or the
hypothetical performance change of a first-time securitizer had it not securitized, is
unobservable. This constitutes the fundamental problem of causal inference in evaluation
studies (see Holland 1986). To overcome this problem, we need to find a proxy for this
counterfactual mean. Using the mean outcome for non-securitizers, that is E(yit01 |Sit 0)
as a proxy for the counterfactual mean, equation (1) becomes:
) 0 | ( ) 1 |
( 1 1 0 1
E yit Sit E yit Sit
(2)
Unless E(yit01|Sit 1)E(yit01 |Sit 0), equation (2) is a biased estimator of
equation (1) because it would yield estimates of the securitization effect plus selection bias
(Heckman and Smith 1995). Here, the selection bias stems from the unit heterogeneity, or
the fact that banks might choose endogenously whether to securitize and therefore
first-time securitizers and non-securitizers might be systematically different prior to the
securitization period t (that is, at time t-1).
In experimental studies, the selection problem is dealt with by random assignment of
treatment, which ensures that every individual has the same ex-ante chance of receiving
treatment (Ravallion 2003). In non-experimental studies, the selection problem is of
paramount concern because there is no direct estimate of the counterfactual mean
analogous to the one based on randomization (Dehejia and Wahba 2002, Smith and Todd
2005).
A variety of non-experimental estimators allow for the reduction and possible
elimination of the selection bias in the estimation of average treatment effects under
different assumptions. Two common approaches are the use of instrumental variables and
16
issues.7 In this paper we use a matching approach to deal with the selection bias. This is a
non-parametric approach that enables us to identify the effect of the treatment on the
outcome under unconfoundedness and common support assumptions (discussed later in
this section). To apply this approach to the case of securitization, we build a control group
from non-securitizers that are similar to the first-time securitizers in all relevant
pre-securitization characteristics. Therefore, the causal effect of pre-securitization could be
presented as: ) , 0 | ( ) , 1 |
( 11 1 01 1
E yit Sit Xit E yit Sit Xit
(3)
where E(y1it1 |Sit 1,Xit1) is the mean performance change of the first-time securitizers
at time t+1 after securitizing in period t; E(yit01|Sit 0,Xit1) is the weighted mean
performance change of the control group at the same time t+1; and Xit1 is a vector of
conditioning covariates observed at time t-1.
The implementation of the matching directly on the covariates, or covariate matching,
might be impractical when the vector of conditioning covariates X is highly dimensional
(Zhao 2008). To overcome the “curse of dimensionality”, Rosenbaum and Rubin (1983)
suggest matching on the propensity score, or the probability of assignment to a particular
treatment conditional on a vector of relevant pre-treatment covariates.8 Using propensity
score, the equation for the average securitization effect becomes:
)) ( , 0 | ( )) ( , 1 |
( 11 1 01 1
E yit Sit p Xit E yit Sit p Xit
(4)
where p is a propensity score conditional on Xit1. In other words, the average
securitization effect is estimated as the difference between the mean performance change
of the first-time securitizers after their first securitization and that of the banks that had
ex-ante similar likelihood of securitizing but did not.
For consistent estimates of the securitization effect, two key assumptions must hold:
17
unconfoundedness assumption, also referred to as the “conditional independence
assumption” or “selection on observables”, requires the mean outcomes to be independent
of the treatment after conditioning on a set of observable covariates (Imbens 2004, Smith
and Todd 2005) and can be formally stated as:9
1 1
1 0
1, ) |
(yit yit Sit Xit or ( , ) | ( 1) 1
1 0
1
yit yit Sit p Xit (5)
In other words, it assumes that there are no unobservable differences between
first-time securitizers and non-securitizers after conditioning on Xit1, so that any systematic
differences in outcomes can be attributed to the securitization effect.
The unconfoundedness thus assumes away the potential bias arising from the
selection on observables (Sianesi 2004).10 To link the unconfoundedness assumption with
standard exogeneity assumptions, it could be written as:
i i i
i S X
y
'
(6)
Here, the unconfoundedness is equivalent to the independence of Si and i
conditional on Xi which would also capture the idea that Si is exogenous (Imbens 2004).
This is a strong assumption because, even after conditioning on the observable covariates
included in X , there may be systematic differences between the first-time securitizers’ and
non-securitizers’ outcomes (Smith and Todd 2005).11 Such discrepancies may arise, for
example, because first-time securitizers and non-securitizers may operate in regions that
may have a differential impact on performance. Therefore, in this paper we estimate the
securitization effect on the change in the performance of banks measured as the
difference in outcomes before and after securitization. This is known as a
difference-in-differences or double-difference matching strategy, where the first difference removes the
unobserved heterogeneity and restores conditional independence and the second
difference produces the impact estimate (Essama-Nssah 2006).12 The assumptions
18
required to justify simple matching; moreover, the difference-in-differences matching
estimator is suggested to be the most robust (Heckman et al. 1998, Smith and Todd
2005).
Next, the common support, or overlap assumption requires an overlap in the
distribution of covariates between the treated and control units to make matching possible
(Imbens 2004) and can be formally stated as:
1 ) | 1 Pr(
0 Sit Xit1 (7)
This assumption imposes a positive probability of either securitizing (Sit 1) or not
securitizing (Sit 0), to ensure the existence of potential matches for each first-time
securitizer among non-securitizers.13
When the unconfoundedness and common support assumptions are satisfied, the
mean outcome observed for the matched non-treated group can be substituted for the
missing counterfactual mean for the treated units (Smith and Todd 2005). In other words, if
the two assumptions hold, we can estimate the casual effect of securitization using the
mean outcome for the matched non-securitizers as a proxy for the performance change
that the first-time securitizers would have had had they not securitized, that is,
) 1 | (yit01 Sit
E in equation (1).
This matching approach thus provides a means of dealing with the selection problem
and a means of estimating causal treatment effects in a non-experimental context using
observational data. The most attractive feature of the matching approach is its
non-parametric nature, that is, it does not impose functional form restrictions in estimating the
conditional expectation of the outcome variable and it leaves the individual causal effect
unrestricted and hence allows arbitrary heterogeneity of the effects in the sample (Lechner
19
4 DATA AND PRELIMINARY UNIVARIATE ANALYSIS
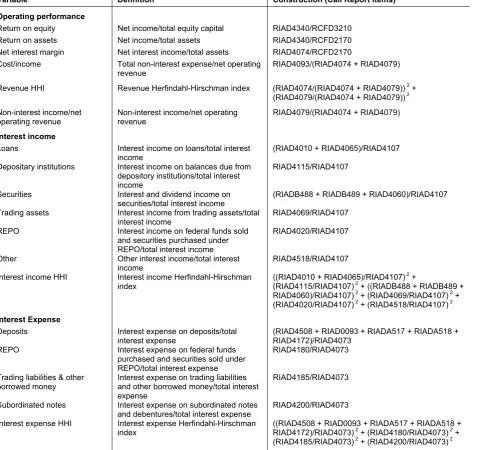
The data for this paper were obtained from the Federal Reserve’s Reports of
Condition and Income (Call Reports) that are filed by insured commercial banks on a
quarterly basis and contain the complete balance sheet, income statement, and detailed
supporting schedules, including a schedule of off-balance-sheet items. Starting from June
2001, US banks were required to provide detailed information on securitization activities in
their regulatory forms.14 Given the incorporation of the new data into the reporting forms,
we use Call Reports from the second quarter of 2001 to the fourth quarter of 2008. When
constructing the data set, we first exclude banks with missing information on total assets,
liquidity, loans, deposits, capital, income, and securitization activities for any quarter of the
sample period. We then keep banks with at least 5 consecutive quarters of data and define
a bank as a securitizer if there is an outstanding securitization in at least one quarter. To
prevent the possibility of outliers driving the results, we winsorize all quarterly ratio
variables at the 1% level.15 Finally, we average the quarterly data on a yearly basis to build
a data set of annual observations.16
As a preliminary step to the PSM analysis, we begin with a cross-sectional analysis
of the full sample and compare the characteristics of banks that securitize with those that
do not. First-time securitizers are included in the group of securitizers because we analyze
the differences between banks that never securitize and those that securitize at least once
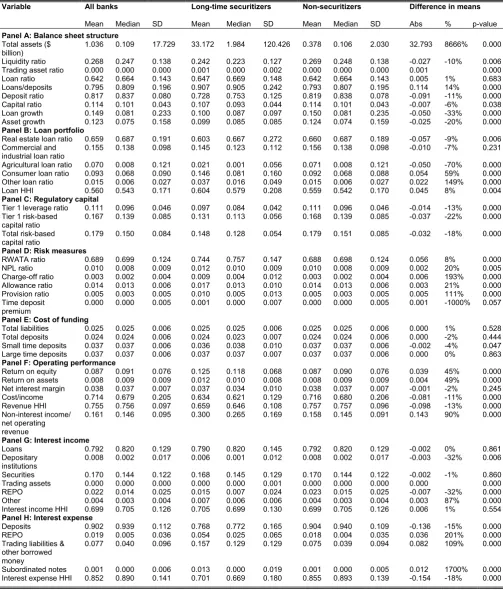
throughout the sample period.17 The results of the comparisons are reported in Table 1.
There are 9,182 banks in the sample, of which 432 are securitizers and 8,750 are
non-securitizers. Despite their smaller number (4.7% of the sample), securitizers still account
for nearly 67% of the sample by total assets.18
20
Panel A of Table 1 presents a summary of the balance sheet information of the
banks in our sample. We find that the most significant difference is bank size, with the
mean value of total assets for securitizers ($15.6 billion) being approximately 40 times
larger than that for non-securitizers ($0.4 billion). This finding is consistent with previous
research that finds that larger banks are more likely to securitize (Minton, Sanders, and
Strahan 2004, Uzun and Webb 2007, Bannier and Hänsel 2008, Jiangli and Pritsker 2008,
Minton, Stulz, and Williamson 2009). Further, securitizers tend to hold less liquid assets
(25% of total assets versus 27% for non-securitizers), which is consistent with them having
better access to external funding and thus needing a smaller liquidity buffer compared to
non-securitizers. While being relatively small, the trading asset ratio appears higher for
securitizers. Both the loan ratio and the loan to deposit ratio are higher for securitizers
(66% versus 64% for non-securitizers and 88% versus 79% for non-securitizers,
respectively); this might reflect securitizers’ reduced access to core deposits (which in turn
might have forced them to securitize). It might also reflect their choice of funding because
securitizing institutions are larger and might have a preference for accessing
wholesale/interbank funds rather than relying on retail deposits.
Looking at the liability side of the balance sheet, we find that both securitizers and
non-securitizers are mainly financed by deposits; however, securitizers rely on this source
of funding to a smaller extent (76% of total assets versus 82% for non-securitizers).
Further, 10.6% of total assets is funded by equity capital for securitizers compared with
11.4% for non-securitizers. This could reflect both the effect of securitization and/or a size
effect where securitizers (which are on average larger banks) might tend to hold less
capital. Interestingly, the data show that loan growth is lower for securitizers compared
with non-securitizers (12% versus 15%); however, there appears to be no statistically
significant difference between securitizers and non-securitizers in terms of asset growth
21
Table 1 also contains information on banks’ loan portfolios (Panel B). Securitizers’
loan portfolios differ in terms of both diversification and composition. In particular, they
tend to be less diversified, as indicated by the mean value of the Herfindahl-Hirschman
Index (HHI) of 0.59 versus 0.56 for non-securitizers, with real estate loans constituting
more than 60% of total loans in both samples. Despite the similar relative distribution,
there are differences in terms of the loan share values between securitizers and
non-securitizers. Specifically, securitizers tend to hold less agricultural loans (4% versus 7% for
non-securitizers) and more consumer (11% versus 9% for non-securitizers) and other
loans (3% versus 2% for non-securitizers) on the balance sheet; while securitizers appear
to hold less real estate and commercial and industrial loans (64% versus 66% for
non-securitizers and 15% versus 16% for non-non-securitizers, respectively), the differences are
not statistically significant.19
Comparing the regulatory capital (Table 1, Panel C), we find that securitizers have
significantly less capital than non-securitizers on a risk-adjusted basis; nonetheless, they
are overcapitalized in terms of regulatory requirements. For example, the mean total
risk-based capital ratio for securitizers is 15% (compared with 18% for non-securitizers).
Securitizers also have lower Tier 1 leverage and Tier 1 risk-based capital ratios (10%
versus 11% for non-securitizers and 14% versus 17% for non-securitizers, respectively).
This finding is consistent with Cebenoyan and Strahan (2004) who find that banks that sell
loans hold less capital. Similarly, Minton, Stulz and Williamson (2009) find evidence to
suggest that risk-adjusted capital ratios are lower for the net buyers of credit protection.
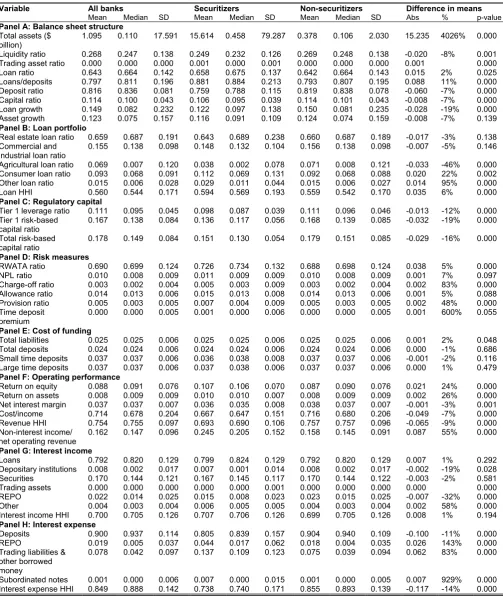
We next compare the risk profiles of securitizers and non-securitizers using a number
of risk measures (Table 1, Panel D): (i) risk-weighted assets to total assets ratio; (ii)
non-performing loan ratio; (iii) charge-off ratio; (iv) allowance ratio; (v) provision ratio; and (vi)
time deposit premium. The latter measured as the interest rate spread between uninsured
22
greater for a riskier bank because uninsured depositors would require a higher rate to
deposit money with the bank (Jiangli and Pritsker 2008). We find that securitizers are more
risky in all the measures considered with the differences being statistically significant.
Similar results are found by Jiangli and Pritsker (2008) and Minton, Stulz and Williamson
(2009) with provision, charge-off, and non-performing loan ratios higher for securitizers.
Jiangli and Pritsker suggest that this could reflect securitization and/or size effects in
allowing banks to extend loans with higher expected losses.
For the cost of funding (Table 1, Panel E), we consider the cost of (i) total liabilities,
(ii) total deposits, (iii) small time deposits, and (iv) large time deposits. We find that the
cost of total liabilities is higher for securitizers, while the difference in the cost of deposits
appears insignificant; this suggests that securitizing banks rely more heavily on
non-deposit funding and pay a higher cost for this source of funding.
We next turn to the indicators of operating performance (Table 1, Panel F). The data
show that securitizers are more profitable in terms of both return on equity and return on
assets (11% versus 9% for non-securitizers and 1% versus 0.8% for non-securitizers,
respectively). The net interest margin is, however, found to be lower for securitizers (3.6%
versus 3.8% for non-securitizers); this suggests that the higher profitability of securitizers
derives from non-interest income. The latter also constitutes a greater part of net operating
revenue for securitizers (25% compared with 16% for non-securitizers), which is consistent
with securitizers having an additional source of income in the form of servicing fees and
possibly more revenue from trading activities.20
Finally, in panels G and H respectively of Table 1, we consider the structure of
interest income and interest expense. We find that securitizers have less income from
balances due from depository institutions and from federal funds sold and securities
purchased under agreements to resell (REPO) (0.7% versus 0.8% for non-securitizers and
23
(0.6% versus 0.4% for non-securitizers). As for the interest expense, we find that
securitizers have significantly lower expense on deposits (81% versus 90% for
non-securitizers); this is probably driven by the lower deposit ratio given that the data show no
significant difference in the cost of deposits between securitizers and non-securitizers.
Further, securitizers have greater expense associated with funding raised in the form of
federal funds and securities sold under agreements to repurchase (REPO) (4.4% versus
1.8% for non-securitizers), trading liabilities and other borrowed money (13.7% versus
7.5% for non-securitizers), and subordinated notes and debentures (0.7% versus 0.1% for
non-securitizers). Overall, the data show more significant differences between securitizers
and non-securitizers in terms of the structure of interest expense rather than interest
income.
Taken together, the comparisons suggest that securitizers appear to be more
profitable, although they extend riskier loans while paying a higher cost of funds for the
excessive risk taking. Securitizing banks also hold less liquidity, larger and less diversified
loan portfolios, and less equity capital. They also diversify their funding to a greater extent
through repurchase agreements, trading liabilities, and subordinated debt, and increase
their non-interest income through fees and trading revenues.
5 PROPENSITY SCORE MATCHING ANALYSIS
5.1 First-Time Securitizers and Non-Securitizers
To determine the impact of securitization on bank performance, we focus on two
groups of banks: first-time securitizers and non-securitizers. Given that securitization is a
recurring activity, we focus on the first observed transaction to build the sub-sample of
first-time securitizers from the sample of securitizing banks.21 We do not use the first-time
securitizers of 2001 and 2008 because for these cases we are not able to collect pre- and
24
matching analysis consists of banks that conduct their first securitization in any year from
2002 to 2007. The control group is built from banks that do not securitize over the
2001-2008 period, that is, the sample of non-securitizers used in the univariate analysis in
section 4. This gives 197 first-time securitizers and 46,375 bank-years in the control group
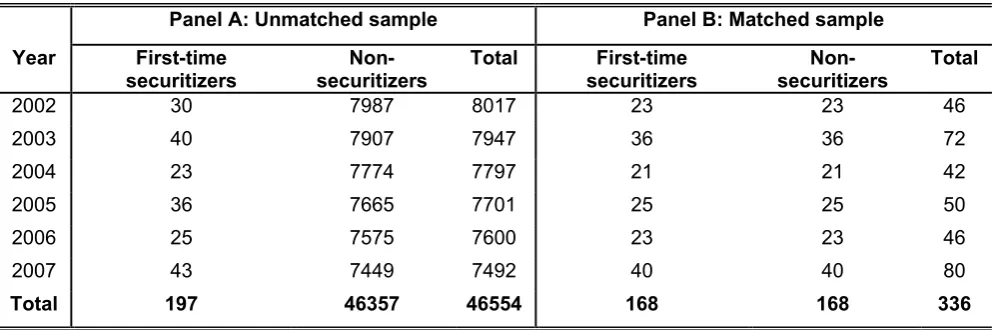
of non-securitizers over the period from 2002 to 2007. Panel A of Table 2 reports the
statistics on the final unmatched sample by year, which shows that the number of first-time
securitizers in this unmatched sample is fairly evenly dispersed across the six years.22
<Insert Table 2 about here>
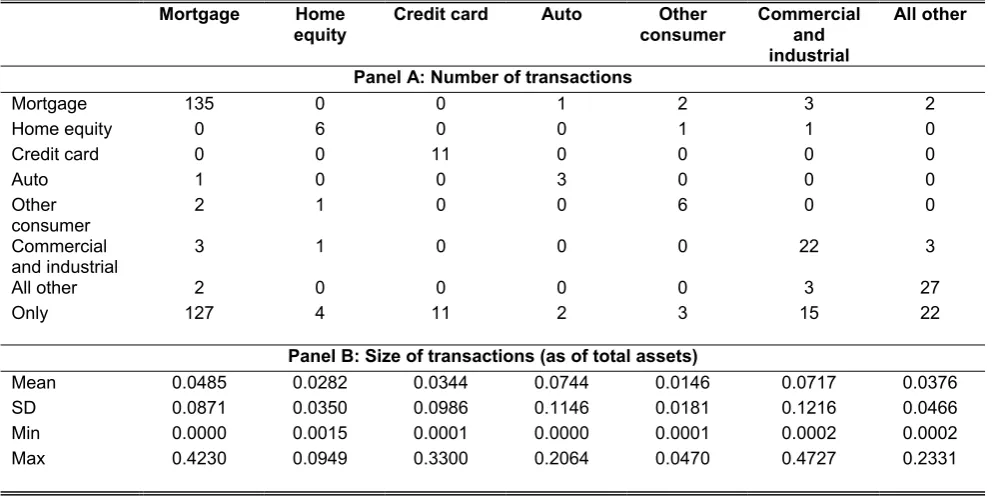
Table 3 reports the statistics for the 197 first securitizations in the unmatched sample
by the type of underlying assets, that is: (i) mortgages; (ii) home equity lines; (iii) credit
card receivables; (iv) auto loans; (v) other consumer loans; (vi) commercial and industrial
loans; and (viii) all other loans, all leases, and all other assets. The statistics include the
number of first securitizations and the amount of securitized assets relative to total assets
for each asset type.
<Insert Table 3 about here>
The data show that of the 197 first securitizations, 135 transactions include
mortgages, of which 8 combine mortgages with other assets and 127 include mortgages
only. The next largest groups are: securitizations of all other loans, all leases, and all other
assets (27 transactions), commercial and industrial loans (22 transactions), and credit card
receivables (11 transactions). While most of the asset classes appear to be combined in a
number of first securitizations, credit card receivables are not. This could be explained by
the revolving nature of credit card receivables, which therefore entails a different
securitization structure. The mean size of transactions varies from 1.5% of total assets for
other consumer loan securitizations to around 7% of total assets for auto and commercial
25
proportion of total assets was comprised of commercial and industrial loans (47%)
followed by one comprising of mortgages (42%).
5.2 Implementation of the Propensity Score Matching
The implementation of the propensity score matching approach can be broken down
into three steps: (i) estimating propensity scores for first-time securitizers and
non-securitizers; (ii) matching first-time securitizers with non-non-securitizers; and finally, (iii)
estimating average securitization effects.
To estimate the propensity scores, we use a probit regression of a dummy variable
that has a unit value for the first securitization, and zero otherwise.23 According to the
matching literature, the regressors included in the model should reflect both the
institutional settings of banks and the theoretical and empirical background on the
determinants of banks’ decision to securitize. It is also worth noting that the main purpose
of the propensity score estimation is not to predict the treatment, but to balance all the
covariates between the two groups (Caliendo and Kopeinig 2008). To do so, we define six
sets of bank-specific variables. The first set reflects general characteristics of bank
balance sheet and income structure. From the asset side, we include measures of bank
liquidity, loan portfolio size and composition. The latter is captured in terms of both the
breakdown of loans into five major categories (real estate, commercial and industrial,
agricultural, consumer, and other loans)24 and the Herfindahl-Hirschman Index (HHI)
calculated using the five loan shares. From the liability side, we include deposit and capital
ratios. We also include bank size, measured as the logarithm of total assets.25 Finally, we
capture the income structure using the non-interest income to net operating revenue ratio.
Next we include sets of variables that proxy for most of the commonly cited motives
26
improvement; regulatory capital relief; and liquidity needs. The funding cost reduction
hypothesis is captured by the cost of total liabilities. To reflect the credit risk management
hypothesis, we use the non-performing loan ratio (Calomiris and Mason 2004, Jiangli and
Pritsker 2008, Minton, Stulz, and Williamson 2009, Affinito and Tagliaferri 2010,
Cardone-Riportella, Samaniego-Medina, and Trujillo-Ponce 2010). We capture bank profitability
using return on equity (Minton, Sanders, and Strahan 2004, Bannier and Hänsel 2008,
Minton, Stulz, and Williamson 2009). With respect to the regulatory capital relief
hypothesis, we include the Tier 1 risk-based capital ratio (Calomiris and Mason 2004,
Uzun and Webb 2007, Bannier and Hänsel 2008, Minton, Stulz, and Williamson 2009).
Finally, we capture liquidity needs using the loan growth (Affinito and Tagliaferri 2010). We
also indirectly capture other possible motives for securitization through the variables
included in the balance sheet and income structure set. Specifically, the loan HHI captures
the portfolio diversification motive; the non-interest income to net operating revenue ratio
captures the banking activity diversification motive (Affinito and Tagliaferri 2010); and
finally, bank size captures the possible influence of economies of scale (Uzun and Webb
2007, Bannier and Hänsel 2008, Jiangli and Pritsker 2008, Minton, Stulz, and Williamson
2009, Affinito and Tagliaferri 2010, Cardone-Riportella, Samaniego-Medina, and
Trujillo-Ponce 2010, Panetta and Pozzolo 2010).
One of the required conditions in the propensity score matching analysis is that the
variables included in the propensity score model should not be affected by the treatment
(Caliendo and Kopeinig 2008). To this end, the bank-specific variables employed in our
model are lagged by one year:
) , , | 1
(Sit Xit 1 Zit 1 Sti
P (8)
where Sit is a first-securitization dummy, Xit1 is a vector of general balance sheet
characteristics, Zit1 is a vector of variables capturing the five main hypotheses on the
27
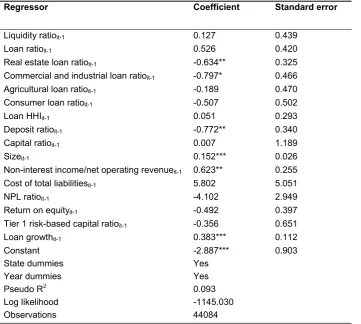
We estimate the propensity scores for the 197 first-time securitizers and 46,357
bank-years of non-securitizers reported in Panel A of Table 2, estimating the model year
by year. For reporting reasons, we reproduce a pooled probit regression for the period
from 2002 to 2007 as it yields qualitatively similar results. To control for dependence of
standard errors for a given bank, we cluster the standard errors at the bank level. The
estimates of the pooled regression are reported in Table 4.
<Insert Table 4 about here>
The results provide significant evidence for the economies of scale, banking activity
diversification, and liquidity needs hypotheses. Specifically, we find that a bank is more
likely to securitize if it has a larger size, a higher share of non-interest income in the net
operating revenue, and high liquidity needs reflected in a higher loan growth. These results
are consistent with previous studies on banks’ propensity to securitize.
Having estimated the propensity scores, we proceed to match first-time securitizers
with non-securitizers. We employ nearest-neighbor matching where the unit chosen from
the non-securitizers (that is, unit j from the control group) as a match for the first-time
securitizer (that is, unit i from the treatment group) is the one closest in terms of the
propensity score: 27
|} min{|
| |
} 0
{S i k
k j
i p p p
p
(9)
To avoid the risk of bad matches entailed in this approach, we impose a 1%
tolerance level on the maximum propensity score distance allowed, the so called caliper.28
We run nearest-neighbor matching year by year to ensure that each first-time securitizer is
matched with an observation from the non-securitizer group of the same year the first
securitization occurs. The empirical setting requires us to restrict the initial unmatched
sample of first-time securitizers and non-securitizers to those with data from one year
before and to two years after the first-securitization year.29 Further, we impose the
28
predictability of first securitization given the observed covariates to ensure the existence of
potential matches in the non-securitizers group.30 This leaves us with 168 first-time
securitizers and their 168 non-securitizing controls in the matched sample. This is the
sample used for the estimation of the average securitization effects. Panel B of Table 2
reports the number of completed matches by year.
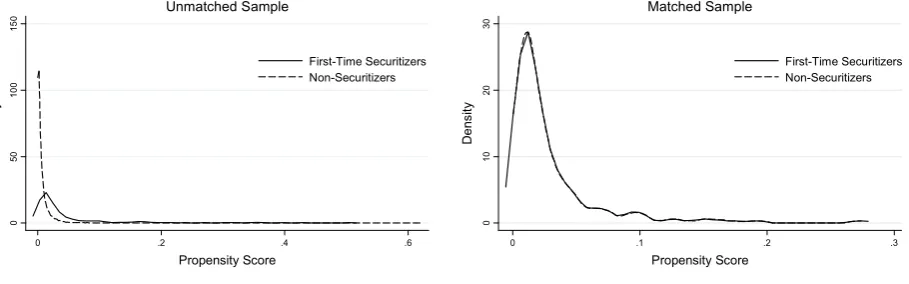
To verify the quality of matching, we plot the distribution of the propensity score for
the first-time securitizers and non-securitizers before and after matching (Figure 2). In the
unmatched sample the propensity score distribution of the non-securitizers is skewed to
the left, whereas it is very close to that of the first-time securitizers in the matched sample.
This result suggests that the matches are appropriate.
<Insert Figure 2 about here>
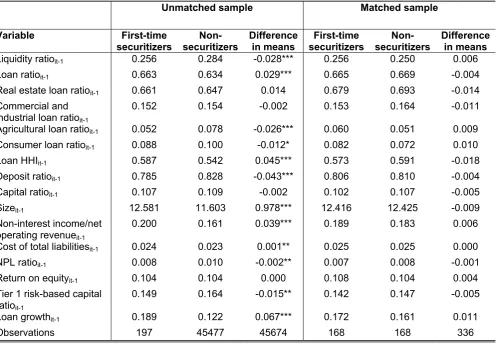
Further, since matching is conditioned on the propensity score rather than on all
covariates, we check whether the matching procedure is able to balance the distribution of
all the relevant variables in both the control and treatment groups (Caliendo and Kopeinig
2008). Rosenbaum and Rubin (1985) suggest a two-sample t-test for comparing the
distributions of the covariates in the treated and matched control groups. To this end, we
compare the first-time securitizers and non-securitizers before and after matching and
check if there remain any significant differences in the balancing covariates after
conditioning on the propensity score. The results of the tests are reported in Table 5. We
find significant differences before matching, whereas in the matched sample the covariates
are balanced in both groups suggesting successful matching.
<Insert Table 5 about here>
6 SECURITIZATION EFFECT ON BANK PERFORMANCE: RESULTS
29
We now use the matched sample to estimate the effects of securitization on the
following indicators of bank performance: (i) cost of funding (cost of total liabilities and total
deposits); (ii) credit risk (non-performing loan and charge-off ratios); (iii) profitability (return
on assets and equity); (iv) interest income and expense structure (interest income and
interest expense HHIs); (v) liquidity (liquidity and loan to deposit ratios); (vi) loan portfolio
(loan ratio and loan HHI); (vii) capital (equity and Tier 1 risk-based capital ratios); and
finally, (viii) growth (loan and asset growth). To do so, we first pool the yearly matched
first-time securitizers and non-securitizers. Second, we calculate the changes in the
performance indicators over a two-year window around the first-securitization year (that is,
1 1
1
yit yit yit ) for each indicator. Finally, we estimate the average securitization
effects as differences in the mean changes in the performance indicators between the
first-time securitizers and non-securitizers.
We run the analysis for the full 2002-2007 sample with 336 banks in total. The results
are reported in Panel A of Table 6. The estimates of the average securitization effects are
presented as “∆” with statistical significance in parentheses, where the latter is calculated
based on bootstrapped standard errors. The interpretation of the estimates is as follows. If
∆ is different from zero, the change in the performance indicator over the time window for
the first-time securitizers is different from that for the matched non-securitizers. For
example, a positive ∆ for profitability would suggest a larger rise, a smaller drop, or a rise
versus a drop in the profitability for the first-time securitizers compared to the matched
non-securitizers, which in turn would suggest a positive effect of securitization on
profitability.
<Insert Table 6 about here>
In what follows, we discuss the key differences between the two samples. We find a
30
suggests a positive impact of securitization on the cost of funding. As for credit risk,
securitization seems to result in a smaller rise in the non-performing loan ratio but a higher
rise in the charge-off ratio. While the data show a reduction in both return on equity and
return on assets for both samples, the reduction is larger for first-time securitizers thus
suggesting a negative impact of securitization on bank profitability, in the short term at
least. Both samples exhibit an increase in interest income concentration; however,
first-time securitizers experience a smaller rise compared with non-securitizers. Looking at the
interest expense structure, while both samples experience a decrease in concentration,
the drop is smaller for first-time securitizers.
Turning to indicators of bank liquidity, we find a larger drop in the liquidity ratio for the
first-time securitizers; the result is reversed for the loan to deposit ratio with first-time
securitizers exhibiting a smaller rise. While both samples exhibit an increase in loan
portfolio size and concentration, first-time securitizers’ portfolio size and concentration
increase to a lesser extent than those for matched non-securitizers.
The analysis of the impact of accessing the securitization market on bank capital
produces mixed results: while first-time securitizers experience a smaller fall in equity
capital, their Tier 1 risk-based capital ratio falls more compared with non-securitizers.
Finally, we estimate a larger drop in both loan and asset growth for first-time securitizers.
The results of the analysis highlight some differences between first-time securitizers
and non-securitizers; however, it is important to emphasize that none of the estimates are
statistically different from zero. In other words, overall the results suggest that the first-time
securitizers would have had comparable performance in the one year after first securitizing
had they not securitized.
31
To test whether securitization takes effect over a longer period, we analyze a
three-year window. To do so, we calculate the changes in the performance indicators as
1 2
2
yit yit yit . As with the two-year window, we then estimate the average
securitization effects as differences in the mean changes in the performance indicators
between the first-time securitizers and non-securitizers. We have to exclude from our
sample 40 banks that securitized for the first time in 2007 because the t+2 data are not
available for these banks. This leaves 128 first-time securitizers and their 128
non-securitizing controls for the estimation.
The results of the three-year window analysis are reported in Panel B of Table 6.
While for some performance indicators the estimates of the average securitization effect
differ slightly from the two-year window results in terms of the magnitude, overall the signs
and statistical significance of the estimates remain unchanged. In other words, consistent
with the two-year window results, we find no evidence of a significant effect on bank
performance of securitization over the longer three-year period.
6.3 Robustness Tests: Alternative Performance Measures
To validate our main results, we consider alternative measures for the performance
indicators examined in the main part of the analysis. Specifically, for the cost of funding we
use the cost of small and large time deposits. As alternative measures of credit risk, we
consider the provision ratio and the time deposit premium. For profitability, we use the net
interest margin, cost to income and non-interest income to net operating revenue ratios.
We also break down the interest income and expense into the main categories. We
consider the loan portfolio in terms of five major types of loans. Finally, we use Tier 1
32
We estimate securitization effects on the alternative performance measures using
both two- and three-year windows. The results are reported in Table 7. Overall, we find
that the evidence is consistent with the main finding of no significant effect of securitization
on bank performance, apart from that on the consumer loan ratio where we find a larger
drop for first-time securitizers over the two-year window. This might be a consequence of
accessing the securitization market. For the three-year window the result for the consumer
loan ratio is similar, although, the estimate is not statistically significant.
<Insert Table 7 about here>
Overall, we find no evidence that securitizing for the first time had a significant impact
on the performance of banks, that is, first-time securitizers would have had comparable
performance had they not securitized. Referring to Figure 1, the evidence suggests the
performance trajectories of first-time securitizers (that is, First-Time Securitizers A and
First-Time Securitizers B) might change the trend marginally after first securitization at
time t, but remain close to the hypothetical trajectories presented by the dotted lines.
The finding of no significant impact of securitization on bank performance may be
driven by a number of factors that might mitigate potential benefits of securitization,
including: (i) the quality of assets securitized and of those retained on the balance sheet,
which in turn might be driven by regulatory capital arbitrage and earnings management
motives (Dionne and Harchaoui 2003, Ambrose, LaCour-Little, and Sanders 2005,
Karaoglu 2005, Dechow, Myers, and Shakespeare 2010); (ii) contractual and
non-contractual credit enhancements, which might result in the originating bank retaining
significant interests in the securitized asset pool (Niu and Richardson 2006, Landsman,
Peasnell, and Shakespeare 2008, Casu and Sarkisyan 2012); and (iii) post-securitization
lending behavior in terms of both risk taking and the volume of credit supply (Cebenoyan
and Strahan 2004, Loutskina and Strahan 2009, Panetta and Pozzolo 2010, Purnanandam
33
7 CONCLUSIONS
In this paper, we conduct an analysis of the effect of accessing the securitization
market on bank performance. The theoretical predictions are that securitizing banks
should have better performance because securitization should enable them to lower the
cost of funding, to improve credit risk and capital management, and to increase
profitability, both via income and portfolio diversification. Using US commercial bank data
from 2001 to 2008, our univariate analysis reveals that securitizing banks do tend to be
more profitable institutions, with a more diversified funding structure, but with higher
funding costs, and with higher credit risk exposure. They also tend to hold larger and less
diversified loan portfolios, have less liquidity, hold less capital, and appear to have lower
loan growth compared with non-securitizing banks.
In an effort to understand better the impact of securitization on bank performance, we
attempt to determine what would have happened to securitizing banks had they not
securitized their assets. In other words, we try to identify the counterfactual performance.
We do this by using propensity score matching (PSM) which allows us to estimate the
effect of securitization by comparing the performance of first-time securitizers with that of
banks that had, ex-ante, a similar securitization likelihood but which chose not to
securitize. Using PSM, we estimate the effects of securitization on a number of bank
performance indicators, including: (i) cost of funding; (ii) credit risk; (iii) profitability; (iv)
interest income and expense structure; (v) liquidity; (vi) loan portfolio; (vii) capital; and
finally, (viii) growth.
We find no evidence that securitization had significant effects on the performance
indicators considered; that is, the results suggest that one and two years after a bank’s
first securitization, it would have had comparable performance had it not securitized. In
34
alternative performance-enhancing techniques used by adequately matched
non-securitizing banks.
The absence in our findings of a significant impact of securitization on banks’
performance may be partially driven by the underwriting and credit management
techniques employed by securitizing banks – when performed poorly, these may
undermine the potential performance benefits of accessing the securitization market.
Specifically, while securitization may allow banks to raise funds at a lower cost,
non-performing underlying assets may impair the banks’ access to the market and require
higher credit risk enhancements, thereby considerably increasing the cost of this funding
source. In addition, while securitization may allow banks to reduce credit risk exposure by
transferring the unexpected portion of the default risk to credit-enhancers and outside
investors, management’s incentives to ensure the performance of the securitized pool –
and, thereby, establish and maintain a bank's reputation in the market - may result in
“cherry-picking” of assets when designing the securitization transaction and in providing
implicit and/or explicit recourse to the structure. This might be particularly important when
banks access the securitization market for the first time. As a consequence, in the short
term, the potential benefits to banks in terms of reduced cost of funding and reduced credit
risk might be outweighed by the implicit and explicit costs of structuring the transaction. In
the longer term, there is evidence in the literature that securitization may also trigger lax
origination and monitoring processes. This could eventually offset the potential credit risk
reduction achieved through securitization. Finally, the additional capital released through
securitization can be used by banks for expansion purposes or to retire existing debt,
which in turn might increase profitability. However, poor underwriting and credit risk
management practices might offset the potential positive effect on profitability. Additionally,
the effect on profitability of securitization may be distorted by managers' discretion