www.solid-earth.net/7/1059/2016/ doi:10.5194/se-7-1059-2016
© Author(s) 2016. CC Attribution 3.0 License.
4-D imaging of sub-second dynamics in pore-scale processes using
real-time synchrotron X-ray tomography
Katherine J. Dobson1,a, Sophia B. Coban2, Samuel A. McDonald3, Joanna N. Walsh3, Robert C. Atwood4, and Philip J. Withers3
1Ludwig-Maximilians-Universität München, Department für Geo-und Umweltwissenschaften, 80333 München, Germany 2School of Mathematics, University of Manchester, Manchester, M13 9PL, UK
3School of Materials, University of Manchester, Manchester, M13 9PL, UK 4Diamond Light Source, Harwell Innovation Campus, Didcot, OX11 0DE, UK
anow at: Durham University, Department of Earth Sciences, South Road, Durham, DH1 3LE, UK
Correspondence to:Katherine J. Dobson ([email protected]) Received: 1 March 2016 – Published in Solid Earth Discuss.: 21 March 2016 Revised: 1 June 2016 – Accepted: 7 June 2016 – Published: 15 July 2016
Abstract. A variable volume flow cell has been integrated with state-of-the-art ultra-high-speed synchrotron X-ray to-mography imaging. The combination allows the first real-time (sub-second) capture of dynamic pore (micron)-scale fluid transport processes in 4-D (3-D+time). With 3-D data volumes acquired at up to 20 Hz, we perform in situ exper-iments that capture high-frequency pore-scale dynamics in 5–25 mm diameter samples with voxel (3-D equivalent of a pixel) resolutions of 2.5 to 3.8 µm. The data are free from motion artefacts and can be spatially registered or collected in the same orientation, making them suitable for detailed quantitative analysis of the dynamic fluid distribution path-ways and processes. The methods presented here are capable of capturing a wide range of high-frequency nonequilibrium pore-scale processes including wetting, dilution, mixing, and reaction phenomena, without sacrificing significant spatial resolution. As well as fast streaming (continuous acquisition) at 20 Hz, they also allow larger-scale and longer-term exper-imental runs to be sampled intermittently at lower frequency (time-lapse imaging), benefiting from fast image acquisition rates to prevent motion blur in highly dynamic systems. This marks a major technical breakthrough for quantification of high-frequency pore-scale processes: processes that are crit-ical for developing and validating more accurate multiscale flow models through spatially and temporally heterogeneous pore networks.
1 Introduction
Porosity, permeability, and flow in geological systems are all highly dynamic. Changes in the confining condi-tions (e.g. pressure, temperature), flow volume, fluid chem-istry/viscosity, or suspension composition can drive mass transport (through processes such as precipitation, dissolu-tion, deposidissolu-tion, or erosion) and change the connectivity and tortuosity of the pore network. The evolving porosity and permeability then cause further changes in both micro- and macro-scale flow. These mass transport processes and the passage of fluid–fluid and fluid–rock reaction fronts through heterogeneous geological systems occur at the pore scale. Developing a detailed appreciation of macroscopic processes as diverse as pollutant transport, hydrocarbon recovery, CO2 sequestration, storage of nuclear waste, aquifer management, nutrient bio-accessibility, building stone preservation, and hydrothermal deposit formation requires a quantitative un-derstanding of the multiscale effect of pore-scale processes.
Synchrotron imaging for dynamic geoscience applications
in a series of recent reviews (Bultreys et al., 2016; Cnudde and Boone, 2013; Hess et al., 2011; Maire and Withers, 2014; Wildenschild and Sheppard, 2013). For the specific applica-tion of understanding pore-scale processes, XCT and sXCT are now becoming widely used for both qualitative and quan-titative imaging of complex natural pore networks and the distribution of liquid(s) within them (Al-Raoush et al., 2011; Al-Raoush and Willson, 2005; Berg et al., 2013; Bhreasail et al., 2012; Boone et al., 2014; Bultreys et al., 2015a; Cnudde and Boone, 2013; Dewanckele et al., 2012; Geraud et al., 2003; Herring et al., 2013; Iglauer et al., 2011; Katuwal et al., 2015; Ma et al., 2016; Naveed et al., 2013b; Olafuyi et al., 2010; Sakellariou et al., 2003; Sok et al., 2010; Wildenschild et al., 2002; Wildenschild and Sheppard, 2013). The data are also being used as a basis of, and validation, for numerical simulations (Al-Raoush and Papadopoulos, 2010; Alhashmi et al., 2015; Bultreys et al., 2015b, 2016; Degruyter et al., 2010; Menke et al., 2015; Naveed et al., 2013a; Raeini et al., 2014, 2015; Fourie et al., 2007).
Standard operation is to collect a set of 2-D “projections” or “radiographs” at constant angular spacing (hereafter angu-lar density) while the sample is rotated through 180◦or 360◦. Standard 3-D tomographic image datasets require seconds (synchrotron), minutes (synchrotron and laboratory), or even hours (laboratory) to acquire (Maire and Withers, 2014). Un-til recently this has limited 3-D experimental investigations of dynamic processes because the critical pore-scale pro-cesses occur over much shorter durations. Many key fluid– rock and fluid–fluid interactions therefore remain poorly con-strained. Furthermore, while numerical simulations can now consider multiple mass and thermal transport processes si-multaneously and can incorporate realistic pore geometries (see Bultreys et al., 2016, for in depth review), many gener-ally still lack validation from experimental data from natural systems where observations are needed with a range of tem-poral and spatial resolutions.
In recent years, careful alignment of 3-D datasets col-lected at fixed time points over moderate duration experi-ments has enabled “time-integrated” tomography as a tool for quantification of fluid dynamics and porosity evolution (Andrew et al., 2014, 2015; Armstrong et al., 2014a; Berg et al., 2013; Blunt et al., 2013; Herring et al., 2013, 2014; Lin et al., 2016; Menke et al., 2015; Wildenschild and Sheppard, 2013). The increased image acquisition rates now available at third-generation synchrotron facilities have driven devel-opment of faster “continuous” imaging. In this mode, sam-ple rotation is not stopped for each projection; instead data are acquired over a narrow arc (typically 0.1–0.5◦). For most
geological materials, collection of the projection data can be just a few seconds (Andrew et al., 2015; Berg et al., 2013; Bhreasail et al., 2012; Pistone et al., 2013, 2015; Youssef et al., 2014). However, 2-D imaging (the same projection acquisition rates but without rotation) is still needed to ob-serve processes occurring on a timescales of milliseconds to a few seconds, such as individual Haynes jumps and the
sub-sequent relaxation dynamics (Armstrong et al., 2014b; Berg et al., 2013). Two-dimensional imaging cannot capture pore and pore–fluid interface morphology, pore throat orientation and size, or the location of the events within the fluid volume. Advances in temporal resolution through camera and beamline technology have been followed by highly paral-lelised iterative reconstruction methods which require far fewer projections yet still achieve adequate reconstructed image quality (Batenburg and Sijbers, 2011; Brabant et al., 2014; Kaestner et al., 2015; Kazantsev et al., 2015a, b; Van Eyndhoven et al., 2015). However, direct in situ observation of sub-second events and processes, as well as those that cause rapid change over longer durations, still remain chal-lenging. Pushing time-integrated tomography towards true long duration 4-D imaging would therefore have high impact on our understanding of pore-scale processes.
Here we present a state-of-the-art 4-D (3-D+real time) imaging methodology that enables visualisation and quanti-tative assessment of dynamic pore-scale processes in real-time (3-D acquisition rates of up to 20 Hz) over variable ex-perimental durations. We present two key methodology de-velopments: sub-second real-time imaging of fluid transport up to an order of magnitude faster than previously presented and the extension of that imaging protocol to allow slower or variable flow dynamics to be quantitatively assessed over longer time periods. We illustrate the potential of these de-velopments for providing insight into pore-scale processes using three case studies showing preliminary data from ex-periments that quantify initial wetting, the evolution from dy-namic to steady state flow, and the evolution of the reaction front during chemical dilution or fluid mixing.
2 Experimental set-up
X-ray beam position
Fluid feed tubes
Sample
Perspex or Al cylindrical sample holder
Mesh & seal fixed in base of sample holder Screw down
mounting to reservoir
125ml outflow reservoir (height can be varied to increase volume)
Reservoir mounted on rotation stage Optional inlet for
pressurised upward flow
Figure 1.A schematic showing the simple peristaltic pump drip-fed gravity-driven flow cell. The system was designed to be modifiable to incorporate laminar and multiphase flow and to be suitable for use with confining pressure and variable temperatures. All key dimen-sion (sample cell diameter, height, and material; reservoir volume; feed) can be adjusted to fit experimental parameters and beamline imaging conditions.
to 500 µm, with pore diameters of 10–150 µm. Mercury and helium porosimetry and water absorption measurements on the disaggregated samples were 13–18, 15–23, and ∼19 % respectively, and the measured permeabilities ranged from 250 to 600 md. In the configuration used here, fluid was sup-plied at a constant flow rate by a 12-channel peristaltic pump operated from the beamline control room (outside the X-ray enclosure or “hutch”) so that flow rates and compositions could be adjusted in real time, i.e. while 3-D data are being acquired. The inlet tube was attached centrally to the top of the cell using a slip ring to ensure a fixed drip point (approx. 5 mm above the centre of the rotating sample). Flow rates were varied from 40 to 200 µL min−1, which corresponded to a drip every 2 and 10 s. The majority of experimental runs were performed using a 6 M KI solution to ensure high con-trast between air, fluid, and rock particles. Pilot scans showed un-doped H2O and some oils could be observed under the hard X-rays of the JEEP white beam (50–150 kV), although low contrast would make post-processing challenging.
The flow cell was designed to be easily modified and can accommodate base fed laminar flows, simultaneous flow
XY
(c) (d) XY
XY
(a) (b) YZ
XY
(e) (f) XY
XY
Figure 2.Two-dimensional reconstructed slices through a typical gravel sample. High-resolution (1800 projection data) perpendic-ular (a; XY) and parallel to flow direction (b; YZ) reconstructed using filtered back projection.(c)A 2-D slice (XY) through a sim-ple spherical bead pack containing a small volume for KI solution reconstructed from 360 projections (2/◦) using filtered back projec-tion;(d)the same 2-D slice reconstructed from 180 projections (1/◦) using filtered back projection;(e, f)comparison of the segmentation of the rock possible from the 1800 and 180 projection data. All scale bars are 200 µm.
3 Ultra-fast image acquisition
The maximum rotation speed of the JEEP tomography stage is 10 Hz (continuous rotation). As synchrotron tomography datasets are acquired over 180◦, 3-D volumes can be ac-quired at up to 20 Hz. The actual operational rotation speed for the given experiment will be controlled by the exposure time for each projection and the total number of projections collected per 3-D dataset. Exposure time is controlled by X-ray flux and sample density. Imaging at the JEEP beam-line can be performed using a polychromatic (white, higher flux) or monochromatic X-ray beam (selectable energy range 53–150 kV). Images were acquired using a Vision Research Phantom Miro™310 M camera (up to 5000 images per sec-ond). In monochromatic beam mode, the exposure time for the large diameter cell was 200 µs (3.8 µm pixel resolution), which dropped to 90 µs for the smaller diameter system (2.5 µm pixel resolution). The system can be in continuous rotation at this speed, in one direction, for as long as required. Beam hardening can occur under white beam in response to the energy dependence of the attenuation, but none was seen in our test data. While white beam would allow shorter expo-sure times (between 30 and 50 % reduction in the test scans), there would be lower contrast between the low density phases and more X-ray scattering and associated noise in the images. Imaging in monochromatic beam gave increased contrast be-tween air and water in a three phase system, without requir-ing long exposures. The diameter of the samples used here exceeds the field of view of the highest magnification mod-ule available at JEEP (1.25 µm pixel resolution), but region-of-interest images could be obtained with a 200 µs exposure. Qualitative analysis of the images at different rotation speeds showed no visible dependence of liquid distribution on ac-quisition (rotation) speed, suggesting the centrifugal effect on this sample and fluid was negligible.
In most “traditional” tomography experiments, over 1000 projections are collected for each 3-D volume. We collected high-resolution data (1800 projections, 0.2 and 0.5 s per 3-D data acquisition) for each dry sample prior to flow initiation to characterise the inter- and intra-grain porosity of each sam-ple (Fig. 2a, b). This dataset can also be used as a structural prior for iterative reconstruction methods (e.g.; Kazantsev et al., 2015a, b; Van Eyndhoven et al., 2015). Reducing the angular density of the projections will shorten overall scan time. The reconstructed image quality does reduce as the projection density drops, but a significant increase in tem-poral resolution can be achieved. To achieve the maximum 20 Hz 3-D image acquisition rate, it is necessary to reduce the number of projections to 250 (200 µs exposure) and 550 (90 µs exposure) per scan.
Under-sampling (using fewer projections) to this degree does cause image quality to degrade, making differences be-tween phases of similar attenuation difficult to observe and reducing the precision with which phase boundaries and vol-umes can be defined. When features of interest are relatively
small, or have complex geometries, then under-sampling can prevent quantitative analysis. However, here the contrast be-tween the saline solution, rock, and air is high, and the pri-mary target is the sub-second distribution of the fluid phase. Using the routine filtered back-projection reconstruction al-gorithms, testing with as few as 360 (Fig. 2c) and 180 pro-jections (Fig. 2d) gave adequate images for basic quantifica-tion (Fig. 2e). Comparison of the two under-sampled datasets shows little increase in quality and little overall change be-tween the 360 and 180 projection scans. For the smaller cells, it is possible to collect 360 projections at maximum image acquisition frequency.
The Miro camera has fixed on-board data storage, which allowed a maximum of approximately 20 000 projections to be collected for the field of view needed in this experiment (in this set-up, the number of projections is dependent on the field of view needed). The under-sampling allowed between 53 and 141 3-D datasets to be acquired in a single experi-mental run (2.5–7 s of acquisition at maximum frequency). Capturing a specific event with this short a duration of col-lection is challenging, especially as the high rotation speeds prevent observation of small volume changes in the live view radiographs. During collection the camera is armed and then triggered. Arming the camera starts projection acquisition, but those data are automatically overwritten until the trigger signal is received. The user can define the trigger to mark (a) the last image (all existing projections on the card are saved), (b) the first image (projections are collected until the card volume is full), or (c) an event (a user-defined number of projections before and after the trigger is saved). The lat-ter option allows a small amount of buffer time for the user to capture a specific event, such as a drip entering the sample or a flow volume/composition change. Automatic triggering mechanisms such as light gates can be incorporated although in this experiment a webcam was used to observe the delivery of each drip.
Case study: observing sub-second dynamics using ultra-fast imaging
Wetting processes and the formation of rivulet networks are poorly understood in heterogeneous media. The processes operate on short timescales and are strongly influenced by sample morphology. Non-invasive 4-D tomography is ideal for capturing the dynamics of these behaviours. Figure 3 shows the evolution of the fluid distribution in a sub-volume of the sample immediately below the drip point. The data were collected under continuous acquisition mode, with a 3-D frame acquisition frequency of 0.07 s (system operating at 7 Hz rotation speed).
The first drip of KI solution (shown in blue) enters the dry sandstone bed (rendered in translucent grey) between frames F0 and F1 (Fig. 3). Initially (t=0.07 s) the KI solution fills the inter-grain pore space to the front of the sub-volume (A) and then immediately begins lateral transport into the intra-grain porosity in the neighbouring intra-grains (Fig. 3b). By the second frame (t=0.14 s) the inter-grain volume has largely emptied, and the majority of the fluid is now within the grains. Intra-grain transport has also occurred with capillary-driven wetting of grains not in direct contact with inter-grain fluid (e.g. C), and drainage of previously saturated intra-grain pores can also be observed from other viewing angles. Be-tween F1 and F2 most grains in contact with the inter-grain fluid have become partially or fully saturated. The remain-ing intra-grain fluid is generally limited to a few small pores and surface films (D). The figure only shows the relaxation after the first drip. As the experiment continues (F3 to F5), the fluid moves away from the initial location, with grain sat-uration increasing by radial and vertical redistribution, with oblique upward propagation of the saturation front in some instances (E). Most grains show an expansion and coales-cence of grain-surface fluid films after initial intra-grain satu-ration (F), although grain surface wetting does occur with no, or prior to, intra-grain saturation (G). Capillary forces con-tinue to redistribute the intra-grain pore fluid over the remain-der of the experiment, with saturation of many grains de-creasing as the system moves towards equilibrium. Grains at both the upper and lower extent of the wetted region (H) are almost completely saturated and then drained again within 1.54 s.
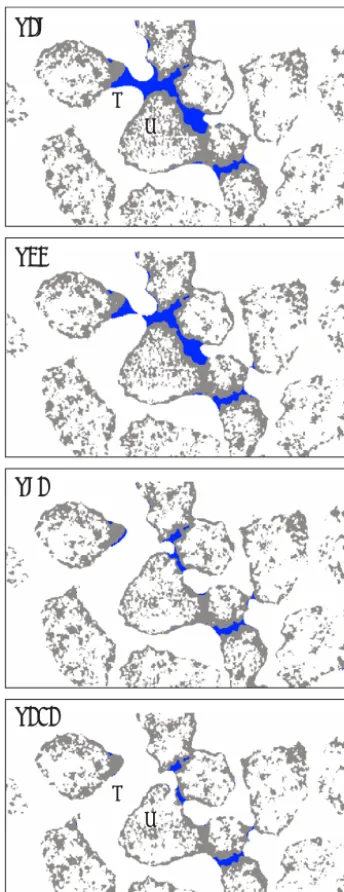
Vertical slices taken through the same sub-volume of the sample in the second scan of the experiment show the ar-rival of the third drip (Fig. 4). In this experiment the fluid feed was stopped during data download. When the pump was restarted, the first drip was used as the trigger for the scan ac-quisition. The initial frames of the second scan were before the arrival of the drip and act as a wet reference. Differences in the fluid volume across the download period result from the fall of a drip at the very end of the experiment, immedi-ately after fluid feed was stopped. Figure 4 captures the ma-jor changes in the fluid distribution in the inter-grain porosity (blue). At this time, the intra-grain fluid distribution (grey)
has become largely stable, although a few grains still show some variability (Fig. 4b).
Passage of the drip causes transient fluid bridging (Fig. 4a). Most bridging connections are maintained through-out the drip cycle, but some transient connections are formed with every drip, and others form only occasionally. Tempo-rary isolation of fluid (enhanced by capillary-driven draw in of the surface film during equilibration as observed at A; Fig. 4) could control chemical reaction rates in reactive sys-tems. Upon reconnection the relatively small volume of this fluid would be rapidly diluted, but rates of dissolution would be locally reduced by limited fluid supply. A later part of the experiment is shown in Movie 1 (see Supplement).
Although the focus of this contribution is on method de-velopment, we include a limited selection of the quantita-tive analysis performed on these samples, as an illustration of the adequacy of the data quality. Quantitative analysis of inter- and intra-grain fluid volume shows the strong fluctu-ation over the course of two drips (Fig. 5) and the general instability of the fluid volume as it is redistributed. After the first drip, the saturation of the intra-grain porosity becomes more gradual, with significant increases on the arrival of sub-sequent drips. The inter-grain distribution equilibrates more slowly.
4 Ultra-high-speed imaging for longer-duration experiments
The experiments presented above allow capture of the high-speed dynamics but have very short overall durations (< 10 s). Capturing longer duration processes with the same 3-D frame acquisition rates requires lower frame acquisition frequen-cies. The Miro camera allows frames to be acquired either continuously (as above) or at user-defined intervals (hereafter called gapped acquisition). Gapped acquisition decreases frame acquisition frequency, while maintaining frame acqui-sition speeds and the resultant data therefore benefit from a lack of motion induced blurring in the reconstructed data.
Although any time or angular gap can be defined, in these experiments they were limited to odd multiples of 180◦. This ensures that the initial projection of every frame was col-lected at the same angle. Registration of the data in this manner saves significant time aligning datasets during post-processing. A gapped acquisition with a spacing of 1 (G1) collects projections over the 0–180◦sector of every rotation
(one full rotation between acquisition start points); a gapped acquisition with spacing of 5 (G5) acquires projections from 0 to 180◦on every third rotation (three full rotations between acquisition start points).
tempo-Figure 3. Time series showing the wetting of the sandstone gravel under the first drip. Three-dimensional frame acquisition fre-quency=0.07/3-D volume (14 Hz). The first frame shows the dry sample with the sandstone grains rendered in semi-transparent grey. From the second frame the KI solution is shown in blue. Note the rapid changes in both the inter- and intra-grain fluid distribution (see text for discussion). The rendered volume is a small sub-volume of the larger dataset and shows a volume approximately 3.5 mm×3.5 mm×2 mm. Data are from sample LH_9, scan 1.
ral scales in one scan or the inclusion of much longer delays between high speed frame acquisitions.
4.1 Case study: capturing multiscale dynamics in pore-scale processes
To show the suitability of this method for capturing the variability of pore-scale flow dynamics, wetting experiments were scanned repeatedly at different gap lengths (continuous through to G25). Between 53 and 106 frames were collected in each scan. High-frequency data acquisition (continuous or G1) was used to capture the first few drips, with longer acquisition intervals (G3–G25) used to capture the slower
processes as the flow network evolved towards steady state through time (Fig. 6). In some experimental runs, variability in the high-speed processes through time was also assessed by repeating continuous G1 or G3 acquisitions at intervals among G5 or G7 acquisitions.
[image:6.612.97.495.68.475.2]vari-A B
A B F17
F23
F71
F101
Figure 4.A single vertical 2-D slice through the second frame. The frames shown cover the passage of the through the sample. The inter-grain fluid is shown in blue and the intra-grain fluid in grey. Wet rocks are grey; KI solution outside the rocks is blue; air and dry rocks are in the background. Field of view is 3.5 mm×2 mm. Data are from sample LH_9, scan 3.
ability in the distribution of the KI solution (Fig. 6) over the 35–60 min experiments.
From the same data it is possible to track the local changes in saturation at the grain scale. Well-established network analysis and morphological quantification algorithms can be applied to extract details of saturation on the pore scale (Fig. 7) or on the geometry of individual phase interfaces and contact angles (Andrew et al., 2014, 2015). For under-sampled data, higher levels of image noise in filtered
back-0.00 % 0.02 % 0.04 % 0.06 % 0.08 % 0.10 %
0.00 % 0.30 % 0.60 % 0.90 % 1.20 % 1.50 % 1.80 %
0 2 4 424 428 844
Intra-grain volume fraction Inter-grain volume fraction
[image:7.612.82.254.65.511.2]Time (s)
Figure 3 data Drip Drip
Drip
Data download Data download
Drips flowing through image volume with steady state intra-grain saturation
420
4 840
Figure 5.The change in fluid volume within the inter- (red) and intra-grain (blue) porosity over the experiment showing the arrival and subsequent equilibration of two drips. After the first drip the system equilibrates to very low inter-grain saturation. Data are from sample LH_9, scans 1 to 3.
projection reconstructions may limit quantitative surface cur-vature and contact angle analysis, but optimised iterative reconstruction methods may give more suitable data (see Sect. 5 below).
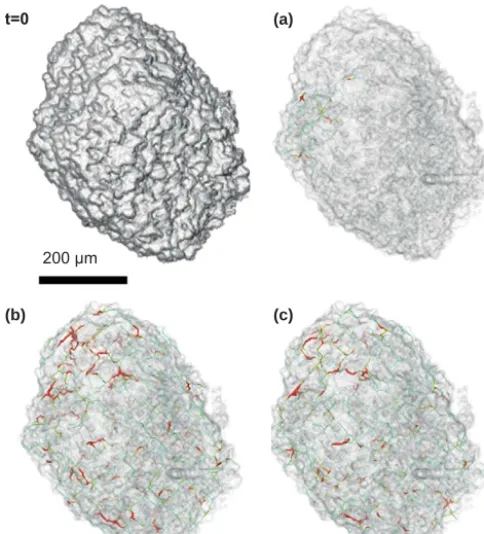
[image:7.612.310.547.67.189.2]200 µm
t=0 (a)
[image:9.612.46.288.68.335.2](c) (b)
Figure 7.A 3-D render of a single grain showing the progression of saturation. The images show the evolution from first contact with the fluid to a steady saturated state over three scans. The colours and the size of tubes representing the pore network correspond to the lo-cal volume of the fluid within the pores: thick red tubes represent the higher local volume; thin blue tubes represent lower local sat-uration. Data are from sample LD_1, showing the dry scan (t=0) and the final frames of(a)scan 1 (continuous),(b)scan 2 (G1), and
(c)scan 3 (G1).
5 Moving beyond the state of the art
The ultra-high-speed imaging presented here allows cap-ture of wetting and transport behaviour at the moderate-to-high spatial resolution necessary for quantitative understand-ing of the processes involved. The 3-D frame acquisition speed and frequency are substantially faster that has been previously achieved. Events such as Hayne jumps (milliond timescale) and the subsequent relaxation (a few sec-onds) have been observed in 2-D imaging (acquisition of projections without rotation) (Armstrong et al., 2014b). The method presented here can provide data on the 3-D nature of those changes, at comparable timescales. Such quantita-tive data can be used to develop or validate larger-scale flow models and to better incorporate pore-scale processes.
The data presented here are reconstructed using standard filtered back-projection reconstruction algorithms. However, these methods are not optimal for under-sampled data. Re-cent advances in iterative reconstruction algorithms use in-formation about the different phases contained within the data to enhance the quality of the reconstruction, with great
effect (Fig. 9). Visual comparison of this type of method (Fig. 9b, d) with reconstructions using filtered back projec-tion (Fig. 9a, c) shows the improvement in phase resoluprojec-tion that can be achieved on fewer projection data. This exam-ple applies an iterative optimisation solver, and along total variation penalisation is incorporated as a regularisation step (Rudin et al.,1992; Little and Jones, 2010) that takes the sam-ple porosity into account (i.e. uses the dataset themselves as prior information), with refinement at each iteration. The it-erative data have fewer line artefacts and lower noise and per-mit accurate phase segmentation from fewer than 45 projec-tions.
Iterative methods have significant potential to develop imaging dynamic pore-scale processes further still. Of spe-cific interest are those methods that use high-quality dry scan data as a structural prior (Kazantsev et al., 2014, 2015a, b; Van Eyndhoven et al., 2015) and those that divide the data volume into static and dynamic regions using the static infor-mation from sequential scans to better define the reconstruc-tion volume Kazantsev et al., 2014, 2015a, b; Van Eyndhoven et al., 2015). Both allow reconstruction of better-quality im-ages from under-sampled data (data with fewer projections) and also allow data of comparable or better quality to those displayed here to be produced from datasets with as few as 18 projections (Van Eyndhoven et al., 2015). These meth-ods can improve the quality of the quantitative data, espe-cially on the key phase interfaces; however, the key advance is likely to come from working with still higher degrees of under-sampling. However, iterative methods are computa-tionally expensive and can take an order of magnitude longer to reconstruct. The methods applied here took between 15 (Fig. 9d) and 45 (Fig. 9b) min per volume, depending on the number of projections in being used. As such, their use in processing every frame of long-duration high-frame-rate data for near-real-time assessment remains unrealistic at present. This may change as computational efficiency increases, but we envisage that iterative methods are more practically ap-plied retrospectively to achieve higher spatial resolution over short periods of critical interest.
At the 3-D volume acquisition rates achieved here, the pro-jection exposure times and mechanical limit of the rotation stage means that imaging faster is not currently possible for the current samples. For higher-density materials, or higher resolution cameras where longer exposure times mean slower overall volume acquisition, iterative methods may improve temporal resolution. However, on the JEEP experimental set-up, the main advantage of iterative methods is the ability to acquire fewer projections per scan and so collect more scans per experiment without sacrificing image quality. This could enable experimental run times to be extended by up to an order of magnitude.
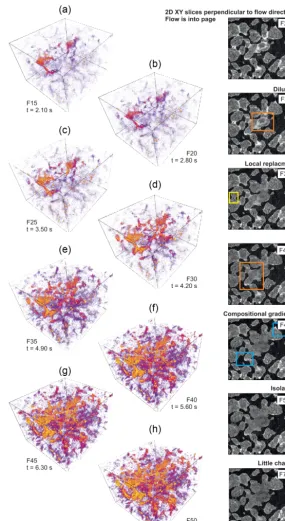
Figure 8.In situ observation of dilution. The 6 M saline solution feed is replaced by H2O att=0.(a–h)Three-dimensional renders of the differential density (greyscale) between the initial saline fluid volume and the saline+water mixture at the times shown. The frame acquisition rate was 0.07 s and acquisition frequency was 7 Hz(g). Data are from sample LD_3, scan 1. Yellow represents complete replace-ment with H2O. Cooler colours represent volumes that are undergoing dilution. Volumes remaining at 6M KI are not shown, as they have undergone no change.
the overall experimental set-up can equally be used for solid core samples at the same spatial and temporal resolution. This experiment was performed at below maximum tion, and imaging finer structures (grains or pores) at
Figure 9. Two-dimensional reconstructed slices through a gravel sample using filtered back projection (a, c)and an iterative opti-misation method with the total variation regularisation incorporated as prior information(b, d). Reconstructions are obtained using 180 projections(a, b)and 90 projections(c, d). The cropped area shown is approximately 3.5 mm×3.5 mm. Note the increased definition of both the inter- and intra-grain porosity that can be achieved for a given number of projections. Data are from sample LD_3, first frame, scan 1. The optimised iterative methods took approximately 45 min (b, 180 projections) and 15 min (d, 90 projections) per 3-D frame, making them a viable element of the post-processing work-flow for key datasets.
experimental set-up to acquire large numbers of projections at constant angular density means that even higher tempo-ral resolution could be achieved. Reconstruction of volumes from datasets with small rotational offsets (typically about 10–20◦, i.e. scan 1 reconstruction from 0 to 180◦, scan 2 re-construction from 10 to 190◦, etc.) could increase temporal resolution by over an order of magnitude (Van Eyndhoven et al., 2015), especially when coupled to iterative methods that can reduce image noise and enhance phase boundary defini-tion in the reconstructed data.
Complex multiphase, spatially heterogeneous micro- and pore-scale processes control many key macro-scale geolog-ical system responses. However, the method is not limited to the simple drip-fed experiments on geological materials presented here and can as be easily applied to high-speed processes operating in any material (metals, ceramics, plas-tics, biological materials, foodstuffs, etc.) suitable for syn-chrotron X-ray tomography at JEEP/i12. It can also be ap-plied in other dynamic systems for samples and materials
sXCT White 2013
sXCT Mono 2013 Lab White 2016
0.01 0.1 1 10 100 1000
Time (s) 0.1
1 10 100
Spatial resolution (
m)
m
White & Mono Gapped (this study)
Iterative reconstruction methods Undersampled
White & Mono (this study)
Undersampled
Figure 10.A schematic showing the current state-of-the-art imag-ing capabilities for synchrotron and laboratory XCT scannimag-ing (mod-ified after Bultreys et al., 2016; Maire and Withers, 2014).
undergoing modification through treatment at extreme tem-perature (hot or cold) or experiencing deformation (tension, compression, cyclic fatigue, fracture, or shear). The devel-opment of the real-time 4-D imaging methods we have pre-sented means that quantitative understanding of all of these processes is now possible, in porous media and beyond.
6 Data availability
Appendix A: Post-processing and image analysis Visualisation and quantification was performed using Avizo™and MATLAB. The greyscale volumes were cropped to the sample boundaries to reduce all subsequent process-ing times. When processprocess-ing continuous acquisition data the frames were first aligned to allow direct comparison and quantitative analysis. For the gapped scans, all data are ac-quired over the same angle and no additional alignment is required. The italicised steps in the following refer to built-in algorithms in Avizo™, and the reader is directed to the asso-ciated documentation for further details of the implementa-tion.
The edge-preserving Bilateral Filter was applied to the greyscale-filtered back-projection reconstructions to reduce image noise. Water, air, and rock phases were segmented us-ing the Interactive Thresholdus-ing tool, and the resultant binary data volumes were used in subsequent analysis. The inter-and intra-grain porosity was defined by creating two sepa-rate binary masks: one by segmentation of the wet and dry grains and one by segmentation of the fluid (inter-and intra-granular). Logical combination of these allows calculation of the inter- and intra-granular fluid volumes. Fluid volumes were calculated using in-built image measures (Volume3-D).
The Supplement related to this article is available online at doi:10.5194/se-7-1059-2016-supplement.
Author contributions. The study was designed by Katherine J.
Dobson and Sam A. McDonald; reconstruction and visualisation was led by Sophia B. Coban and Katherine J. Dobson with assis-tance from Samuel A. McDonald. Robert C. Atwood led camera integration at Diamond Light Source. Katherine J. Dobson, Sophia B. Coban, Sam A. McDonald, Joanna N. Walsh, and Robert C. Atwood performed the experiments at i12/JEEP. The lead author was Katherine J. Dobson, with all other authors contributing to the manuscript.
Acknowledgements. Katherine J. Dobson was supported in this
work by EVOKES ERC247076 and NERC NE/M018678/1; Sophia B. Coban is supported by EPSRC EP/J010456/1, the School of Mathematics, and the BP International Centre for Advanced Materials. Philip J. Withers wishes to acknowledge the BP International Centre for Advanced Materials for funding under ICAM 03. Samuel A. McDonald is grateful to Zeiss for funding his fellowship. We thank Diamond Light Source for access to beamline I12 (beam time award EE10500-1).
Edited by: M. Halisch
References
Alhashmi, Z., Blunt, M. J., and Bijeljic, B.: Predictions of dynamic changes in reaction rates as a consequence of incomplete mixing using pore scale reactive transport modeling on images of porous media, J. Contam. Hydrol., 179, 171–181, 2015.
Al-Raoush, R. and Papadopoulos, A.: Representative elementary volume analysis of porous media using X-ray computed tomog-raphy, Powder Technol., 200, 69–77, 2010.
Al-Raoush, R. I. and Willson, C. S.: Extraction of physically realis-tic pore network properties from three-dimensional synchrotron X-ray microtomography images of unconsolidated porous media systems, J. Hydrol., 300, 44–64, 2005.
Al-Raoush, R., Gordon, C., Robins, S., and Richardson, J.: Charac-terization of immiscible non-wetting fluids in porous media sys-tems using synchrotron tomography, Abstracts of Papers of the American Chemical Society, 241, 1, 2011.
Andrew, M., Bijeljic, B., and Blunt, M. J.: Pore-by-pore capillary pressure measurements using X-ray microtomography at reser-voir conditions: Curvature, snap-off, and remobilization of resid-ual CO2, Water Resour. Res., 50, 8760–8774, 2014.
Andrew, M., Menke, H., Blunt, M. J., and Bijeljic, B.: The Imag-ing of Dynamic Multiphase Fluid Flow UsImag-ing Synchrotron-Based X-ray Microtomography at Reservoir Conditions, Trans-port Porous Med., 110, 1–24, 2015.
Armstrong, R. T., Georgiadis, A., Ott, H., Klemin, D., and Berg, S.: Critical capillary number: desaturation studied with fast X-ray computed microtomography, Geophys. Res. Lett., 41, 55–60, 2014a.
Armstrong, R. T., Ott, H., Georgiadis, A., Rucker, M., Schwing, A., and Berg, S.: Subsecond pore-scale displacement processes and relaxation dynamics in multiphase flow, Water Resour. Res., 50, 9162–9176, 2014b.
Batenburg, K. J. and Sijbers, J.: DART: A Practical Reconstruction Algorithm for Discrete Tomography, IEEE T. Image Process., 20, 2542–2553, 2011.
Berg, S., Ott, H., Klapp, S.A., Schwing, A., Neiteler, R., Brussee, N., Makurat, A., Leu, L., Enzmann, F., Schwarz, J.-O., Kersten, M., Irvine, S., and Stampanoni, M.: Real-time 3-D imaging of Haines jumps in porous media flow, P. Natl. Acad. Sci., 110, 3755–3759, 2013.
Bhreasail, Á. N., Lee, P. D., O’Sullivan, C., Fenton, C. H., Hamil-ton, R., Rockett, P., and Connolley, T.: In-Situ Observation of Cracks in Frozen Soil using Synchrotron Tomography, Per-mafrost Periglac., 23, 170–176, 2012.
Blunt, M. J., Bijeljic, B., Dong, H., Gharbi, O., Iglauer, S., Mostaghimi, P., Paluszny, A., and Pentland, C.: Pore-scale imag-ing and modellimag-ing, Adv. Water Resour., 51, 197–216, 2013. Boone, M. A., De Kock, T., Bultreys, T., De Schutter, G., Vontobel,
P., Van Hoorebeke, L., and Cnudde, V.: 3-D mapping of water in oolithic limestone at atmospheric and vacuum saturation using X-ray micro-CT differential imaging, Mater. Charact., 97, 150– 160, 2014.
Brabant, L., Dierick, M., Pauwels, E., Boone, M. N., and Van Hoorebeke, L.: EDART, a discrete algebraic reconstructing tech-nique for experimental data obtained with high resolution com-puted tomography, J. X-Ray Sci. Technol., 22, 47–61, 2014. Bultreys, T., Boone, M. A., Boone, M. N., De Schryver, T.,
Mass-chaele, B., Van Hoorebeke, L., and Cnudde, V.: Fast laboratory based micro-computed tomography for pore-scale research: Il-lustrative experiments and perspectives on the future, Adv. Water Resour., in press, 2015a.
Bultreys, T., Van Hoorebeke, L., and Cnudde, V.: Multi-scale, micro-computed tomography-based pore network models to sim-ulate drainage in heterogeneous rocks, Adv. Water Resour., 78, 36–49, 2015b.
Bultreys, T., De Boever, W., and Cnudde, V.: Imaging and image based fluid transport modeling at the pore scale in geological materials: A practical introduction to the current state-of-the-art, Earth-Sci. Rev., 155, 93–128, 2016
Cnudde, V. and Boone, M. N.: High-resolution X-ray computed to-mography in geosciences: A review of the current technology and applications, Earth-Sci. Rev., 123, 1–17, 2013.
Degruyter, W., Burgisser, A., Bachmann, O., and Malaspinas, O.: Synchrotron X-ray microtomography and lattice Boltzmann sim-ulations of gas flow through volcanic pumices, Geosphere, 6, 470–481, 2010.
Dewanckele, J., De Kock, T., Boone, M. A., Cnudde, V., Brabant, L., Boone, M. N., Fronteau, G., Van Hoorebeke, L., and Jacobs, P.: 4-D imaging and quantification of pore structure modifica-tions inside natural building stones by means of high resolution X-ray CT, Sci. Total Environ., 416, 436–448, 2012.
at Diamond Light Source, J. Synchrotron Radiat., 22, 828–838, 2015.
Fourie, W., Said, R., Young, P., and Barnes, D. L.: The Simulation of Pore Scale Fluid Flow with Real World Geometries Obtained from X-Ray Computed Tomography, Proceedings of the Boston COMSOL Conference, 2007.
Geraud, Y., Surma, F., and Mazerolle, F.: Porosity and fluid flow characterization of granite by capillary wetting using X-ray com-puted tomography. Geological Society, London, Special Publica-tions, 215, 95–105, 2003.
Herring, A. L., Harper, E. J., Andersson, L., Sheppard, A., Bay, B. K., and Wildenschild, D.: Effect of fluid topology on residual nonwetting phase trapping: Implications for geologic CO2 se-questration, Adv. Water Resour., 62, 47–58, 2013.
Herring, A. L., Andersson, L., Newell, D. L., Carey, J. W., and Wildenschild, D.: Pore-scale observations of supercritical CO2 drainage in Bentheimer sandstone by synchrotron X-ray imag-ing, Int. J. Greenh. Gas Con., 25, 93–101, 2014.
Hess, K. U., Flaws, A., Muehlbauer, M. J., Schillinger, B., Franz, A., Schulz, M., Calzada, E., Dingwell, D. B., and Bente, K.: Advances in high-resolution neutron computed tomography: Adapted to the earth sciences, Geosphere, 7, 1294–1302, 2011. Iglauer, S., Paluszny, A., Pentland, C. H., and Blunt, M. J.: Residual
CO2imaged with X-ray micro-tomography, Geophys. Res. Lett., 38, L21403, doi:10.1029/2011GL049680, 2011.
Kaestner, A. P., Trtik, P., Zarebandkouki, M., Kazantsev, D., Sne-hota, M., Dobson, K. J., and Lehmann, E. H.: Recent develop-ments in neutron imaging with applications for porous media research, Solid Earth Discuss., 7, 3481–3510, doi:10.5194/sed-7-3481-2015, 2015.
Katuwal, S., Norgaard, T., Moldrup, P., Lamande, M., Wildenschild, D., and de Jonge, L. W.: Linking air and water transport in intact soils to macropore characteristics inferred from X-ray computed tomography, Geoderma, 237, 9–20, 2015.
Kazantsev, D., S., O., Hutton, B. F., Dobson, K. J., Kaestner, A. P., Lionheart, W. R. B., J., W. P., Lee, P. D., and Arridge, S. R.: A novel technique to incorporate structural prior information into multi-modal tomographic reconstruction, Inverse Probl., 30, 065004, doi:10.1088/0266-5611/30/6/06500, 2014.
Kazantsev, D., Thompson, W. M., Van Eyndhoven, G., Dobson, K., Kaestner, A.P., Lionheart, W., Withers, P. J., and Lee, P. D.: 4-D-CT reconstruction with unified spatial-temporal patch-based reg-ularization, Inverse Probl. Imag., 9, 447–467, 2015a.
Kazantsev, D., Van Eyndhoven, G., Lionheart, W., Withers, P., Dob-son, K., McDonald, S., Atwood, R., and Lee, P.: Employing tem-poral self-similarity across the entire time domain in computed tomography reconstruction, Philos. T. R. Soc. A, 373, 20140389, doi:10.1098/rsta.2014.0389, 2015b.
Lin, Q., Barker, D. J., Dobson, K. J., Lee, P. D., and Neethling, S. J.: Modelling particle scale leach kinetics based on X-ray computed micro-tomography images, Hydrometallurgy, 162, 25–36, 2016. Little, M. A. and Jones, N. S.: Sparse Bayesian step-filtering for high-throughput analysis of molecular machine dynamics, IEEE International Conference on Acoustics, Speech and Signal Pro-cessing, ICASSP 2010 Proceedings Dallas, Texas, USA, 4162– 4165, 2010.
Ma, L., Taylor, K. G., Lee, P. D., Dobson, K. J., Dowey, P. J., and Courtois, L.: Novel 3-D centimetre-to nano-scale quantification
of an organic-rich mudstone: The Carboniferous Bowland Shale, Northern England, Mar. Petrol. Geol., 72, 193–205, 2016. Maire, E. and Withers, P. J.: Quantitative X-ray tomography, Int.
Mater. Rev., 59, 1–43, 2014.
Menke, H. P., Bijeljic, B., Andrew, M. G., and Blunt, M. J.: Dy-namic Three-Dimensional Pore-Scale Imaging of Reaction in a Carbonate at Reservoir Conditions, Environ. Sci. Technol., 49, 4407–4414, 2015.
Naveed, M., Hamamoto, S., Kawamoto, K., Sakaki, T., Takahashi, M., Komatsu, T., Moldrup, P., Lamande, M., Wildenschild, D., Prodanovic, M., and de Jonge, L. W.: Correlating Gas Transport Parameters and X-Ray Computed Tomography Measurements in Porous Media, Soil Sci., 178, 60–68, 2013a.
Naveed, M., Moldrup, P., Arthur, E., Wildenschild, D., Eden, M., Lamand, M., Vogel, H. J., and de Jonge, L. W.: Revealing Soil Structure and Functional Macroporosity along a Clay Gradient Using X-ray Computed Tomography, Soil Sci. Soc. Am. J., 77, 403–411, 2013b.
Olafuyi, O. A., Sheppard, A. P., Arns, C. H., Sok, R. M., Cinar, Y., Knackstedt, M. A., and Pinczewski, W. V.: Experimental Verification of Effect of Size on Drainage Capillary Pressure Computed from Digitized Tomographic Images, Int. J. Eng. Res. Africa, 1, 1–10, 2010.
Pistone, M., Caricchi, L., Ulmer, P., Reusser, E., and Ardia, P.: Rhe-ology of volatile-bearing crystal mushes: Mobilization vs. vis-cous death, Chem. Geol., 345, 16–39, 2013.
Pistone, M., Arzilli, F., Dobson, K. J., Cordonnier, B., Reusser, E., Ulmer, P., Marone, F., Whittington, A. G., Mancini, L., Fife, J. L., and Blundy, J. D.: Gas-driven filter pressing in magmas: Insights into in-situ melt segregation from crystal mushes, Geology, 43, 699–702, 2015.
Raeini, A. Q., Blunt, M. J., and Bijeljic, B.: Direct simulations of two-phase flow on micro-CT images of porous media and up-scaling of pore-scale forces, Adv. Water Resour., 74, 116–126, 2014.
Raeini, A. Q., Bijeljic, B., and Blunt, M. J.: Modelling capillary trapping using finite-volume simulation of two-phase flow di-rectly on micro-CT images, Adv. Water Resour., 83, 102–110, 2015.
Rudin, L. I., Osher, S., and Fatemi, E.: Nonlinear total variation based noise removal algorithms, Physica D, 60, 259–268, 1992. Sakellariou, A., Sawkins, T. J., Senden, T. J., Arns, C. H., Limaye,
A., Sheppard, A. P., Sok, R. M., Knackstedt, M. A., Pinczewski, W. V., Berge, L. I., and Øren, P.-E.: Micro-CT Facility For Imag-ing Reservoir Rocks At Pore Scales, SEG Technical Program Ex-panded Abstracts, 22, 1664–1667, 2003.
Sato, M., Bitter, I., Bender, M. A., Kaufman, A. E., and Nakajima, M.: TEASAR: tree-structure extraction algorithm for accurate and robust skeletons, Proceedings of the Eighth Pacific Confer-ence on Computer Graphics and Applications, 281–449, 2000. Sok, R. M., Varslot, T., Ghous, A., Latham, S., Sheppard, A. P., and
Knackstedt, M. A.: Pore Scale Characterization of Carbonates at Multiple Scales: Integration of Micro-CT, BSEM, FIBSEM, PetroPhysics, 51, 379–387, 2010.
Wildenschild, D. and Sheppard, A. P.: X-ray imaging and analy-sis techniques for quantifying pore-scale structure and processes in subsurface porous medium systems, Adv. Water Resour., 51, 217–246, 2013.
Wildenschild, D., Hopmans, J. W., Vaz, C. M. P., Rivers, M. L., Rikard, D., and Christensen, B. S. B.: Using X-ray computed tomography in hydrology: systems, resolutions, and limitations, J. Hydrol., 267, 285–297, 2002.