Volume 3, No. 2/3
July 1998
Newsletter of the Climate Variability and Predictability Programme (CLIVAR)
Exchanges
In this Issue
From the Director ICPO
CLIVAR Scientific Steering Group
7th Session
-Development and Forecasts of the
1997/98 El Niño: CLIVAR Scientific
Issues
Upper Ocean Panel - 3rd Session
Prospectus for ARGO
- A global profiling float array
VAMOS/PACS Workshop on Field
Programmes, 1st Session of the CLIVAR
VAMOS Panel
African Study Group
WOCE Data Products Committee
-11th
Session-Calendar
1
2
4
15
15
20
22
23
24
From the Director ICPO
CLIVAR Initial Implementation Plan
A
s this issue of CLIVAR Exchanges goes to press, CLIVAR reaches another important milestone with the publication of its Initial Implementation Plan (IIP). To-gether with the 1995 Science Plan and the brochure “CLI-VAR - A Research Programme on Climate Variability and Predictability for the 21st Century” published in Au-gust 1997, it spells out the scope of CLIVAR science. The term “Initial” implies that the plan reflects the present sta-tus of CLIVAR science and that this view will inevitably evolve as our understanding improves based on the results of TOGA, WOCE and CLIVAR itself.The IIP is the culmination of 3 years of intensive discussions, workshops, writing assignments and editing and this has involved a great deal of hard work by many people. While it is impossible to thank everyone who has been involved, special mention needs to be made of the contributions from Andreas Villwock in the ICPO in Hamburg and from George Needler who played a major editorial role in the later stages.
The printed versions will be distributed from the ICPO in Hamburg and Southampton in July but it is al-ready available in html format at
http://www.dkrz.de/clivar/vol2/contents_new.html and on the US mirror site at
http://www.clivar.ucar.edu/vol2/contents_new.html Additionally, you can preview, download and print a camera-ready version of the plan in pdf-format from: http://www.dkrz.de/clivar/vol2/contents_pdf.html and its mirror site
http://www.clivar.ucar.edu/vol2/contents_pdf.html CLIVAR Conference
CLIVAR
- Exchanges
V
olume 3 No. 2/3, July 1998
1998. At that Conference we will be demonstrating the scope of CLIVAR science and its potential bene-fits and seeking expressions of interest and firm re-source commitments from countries that wish to participate in the project.
Since CLIVAR is seeking commitments we ex-pect that national delegations to the conference will consist primarily of senior representatives of funding agencies supported by key members of the scientific community. We do not now see this as a conference at which scientists will discuss amongst themselves the details of the IIP - those discussions will come later when the details of national commitments become clear. There has already been enormous interest in the Conference and in the IIP from individual scientists, research institutes, funding agencies and other institu-tions. These interests now need to be focused into the written submissions and presentations to be made by national delegations to the Conference.
The Conference Organizing Committee, now chaired by David Carson from the UK Meteorological Office, the CLIVAR SSG and the ICPO are preparing the Conference programme which will be distributed soon, together with information on what countries are asked to do in preparation. Updates on the current planning status will be put on our Conference web-sites: http://www.dkrz.de/clivar/clivar_conf.html http://www.clivar.ucar.edu/clivar_conf.html. Other news
The spin-up of the relocated ICPO in Southamp-ton is under way. A full time secretary (Mrs. Sandy Grapes) will be in post at the end of July and the proc-ess of recruiting a senior scientist to join the ICPO is progressing well. In the meantime the staff in the two office locations (Hamburg and Southampton) together with input from WCRP JPS in Geneva are supporting CLIVAR meetings, providing information on the project and preparing for the Conference.
This Newsletter
The 1997/98 ENSO event is of enormous im-portance both scientifically and as a wonderful oppor-tunity to highlight the importance and relevance of CLIVAR science. I am therefore very pleased to see the stimulating ENSO review article by Kevin Tren-berth. The remaining articles, while apparently report-ing on meetreport-ings, contain much useful information relevant to CLIVAR implementation. The article by Neville Smith on the CLIVAR UOP meeting high-lights a proposal (ARGO) for a global network of sub-surface floats as part of the Global Climate Observing System (GCOS) and as a potential contribution to
CLIVAR and GODAE. It would provide real-time data on upper ocean temperature and salinity distribu-tions and have an enormous impact on both the global and regional implementation of CLIVAR. South America, SE Asia and Africa will be areas of intense interest in CLIVAR and all the meetings reported in this issue of Exchanges addressed aspects of imple-mentation whether in these and other regions or more generally (WOCE Data Products Committee and the CLIVAR SSG). This is a bumper issue (Combining 1998 numbers 2 and 3). Number 4 will appear in the run-up to the December CLIVAR Conference.
CLIVAR Exchanges has the potential to be a means of rapidly spreading information on new scitific findings from CLIVAR-related research and I en-courage you to submit any relevant articles to the ICPO for possible publication in future issues.
John Gould
CLIVAR Scientific Steering Group
7th Session
-Santiago de Chile, 27 April - 1 May 1998
T
he CLIVAR Scientific Steering Group (SSG) held its seventh session in Santiago, Chile, at the stately headquarters of the Chilean National Science Founda-tion. This was the first SSG meeting to be held south of the equator, and the site was selected to highlight the role of Latin American science and scientists in CLIVAR, and particularly VAMOS (the CLIVAR study of the Variability of the American Monsoon Systems). The local host was Dr. Fuenzalida of the University of Chile, the nominated CLIVAR liaison with the Inter American Institute for Global Change Research (IAI). Representatives from the local mete-orological and hydrographic services also participated in the meeting. Scientific presentations were made by two local researchers, Drs Aceituno and Rutlland on climate predictions efforts in Chile and on a studies of regional climate dynamics.V
olume 3 No. 2/3, July 1998
CLIVAR
- Exchanges
of various aspects of the programme. The SSG was also looking to maximize the synergy with other relat-ed programmes, through sharrelat-ed resources and com-mittees.
Some basic principles for CLIVAR implemen-tation were agreed:
1. International coordination is the essence of CLI-VAR implementation and is the primary responsi-bility of the International CLIVAR Project Office (ICPO).
2. The CLIVAR panels should focus primarily on implementation issues, based on what is in the Plan and on the outcomes of the December Confer-ence, with the SSG providing overall scientific guidance and coordination amongst panels.
3. Implementation of CLIVAR reaches across time-scales. In particular, many observing systems pro-vide data essential for several principal research areas (PRAs) within GOALS, DecCen and ACC and modelling necessarily encompasses all time-scales.
4. Many aspects of implementation are regional; therefore formation of regional oversight panels should be considered.
5. The SSG should encourage, and the ICPO should help coordinate, international and multi-national process studies. The SSG should regularly invite reports from these projects to enable effective coordination.
6. Background sustained observing systems should be recommended and encouraged by CLIVAR, but implemented through programmes such as GCOS and GOOS.
Three of the GOALS PRAs are already served by planning and oversight panels. Two of these - VA-MOS and the Asian-Australian Monsoon, had just met. The SSG endorsed the staged approach to field programmes proposed by VAMOS (summary on page 21) and urged the ICPO to assist in implementing the first phase observing systems, particularly in the re-gion of the low level jet in central South America. The SSG discussed in depth how best to manage the five DecCen PRAs, each of which has a strong ocea-nographic component tied to regional and global at-mospheric circulation issues and, in some cases, to sea ice and land surface processes, as well. The Group concluded that the three “Atlantic” PRAs would ben-efit from cross-fertilization and coordination under a single oversight Panel. This was consistent with the views expressed at the EuroCLIVAR Atlantic meet-ing which was held two weeks later in Florence. Draft
terms of reference were drawn up and task groups es-tablished to recommend membership. Similar propos-als were put forward for a Southern Ocean group and one for the Pacific. The Indian Ocean is being actively considered by the AA Monsoon Panel and the SSG felt that this Panel should currently remain the focal point for CLIVAR requirements in the area. The for-mation of all these groups is being coordinated with Ocean Observing Panel for Climate (OOPC) to avoid duplication of effort. In light of these developments, the terms of reference of the CLIVAR Upper Ocean Panel (UOP) would be reviewed at the end of 1999.
A second focus of the SSG meeting was a pre-liminary assessment of how well the 97/98 ENSO event, and its impacts around the globe, have been ob-served, modelled and predicted. Reports were heard from the various nations and institutions represented at the meeting as to their experiences and what lessons had been learned which might be applied to CLIVAR research. It was clear that the observing system in the Pacific had played a key role in the ability to predict the event, but also that most models failed to predict the intensity of the event until it was underway. Pre-diction of regional impacts saw a mixture of successes and failures; some of the latter may be attributable to anomalous conditions in the rest of the equatorial oceans and elsewhere. A comprehensive report will be compiled by K. Trenberth and submitted as a CLI-VAR contribution to the United Nations 97/98 ENSO Retrospective which is being organized under the aus-pices of several UN agencies. A summary appears in this issue of Exchanges.
CLIVAR
- Exchanges
V
olume 3 No. 2/3, July 1998
SSG also agreed to work with the WOCE SSG to en-sure that issues related to the improvement of ocean models were adequately addressed within the WCRP modelling programme.
The SSG recognized that a successful CLIVAR required active coordination with other WCRP pro-grammes. Based on the reports from VAMOS and the modelling groups, it was agreed that cooperation with GEWEX should be increased in the following ar-eas: (1) the study of stratus clouds, particularly VA-MOS with GEWEX Cloud System Study (GCSS), (2) land processes (VAMOS with LBA, AA Monsoon with GAME), and (3) the work of WGCM, NEG 1, and the radiation and cloud panels of GEWEX.
The second major goal of WOCE is to deter-mine the representativeness of the specific WOCE data sets for the long-term behaviour of the ocean, and to find methods for determining long-term changes in ocean circulation. Meeting this objective is of para-mount importance to CLIVAR, and the CLIVAR SSG volunteered to work with the WOCE SSG to develop plans for a workshop on the representativeness of WOCE data sets.
The CLIVAR Conference to be held in Paris 1-4 December 1998 will provide an opportunity to ad-vertise CLIVAR to programme managers and deci-sion makers interested in climate science. It should also allow nations to publicize their plans for partici-pation in CLIVAR activities, and to make some pre-liminary steps towards coordination with the activities of other nations. The SSG will take stock of what con-stitutes CLIVAR after the December meeting and will direct the programme accordingly, working to fill gaps and modifying projects as necessary.
The SSG developed some guidelines concern-ing the formulation of the Conference programme. In particular it stressed that the audience should take home the message that CLIVAR is in tune with user requirements and interested in improving the applica-tion of CLIVAR research for the socio-economic ben-efit. The SSG restructured the Conference Organizing Committee in order to get stronger advice from na-tions on how this Conference would best serve their needs as well as CLIVAR’s. The SSG is looking to the Organizing Committee (now chaired by D. Carson of the Hadley Centre, UK), with the assistance of the ICPO, to develop in the very near future an appropri-ate agenda and selection of speakers.
Valery Detemmerman
Development and Forecasts of the 1997/98
El Niño: CLIVAR Scientific Issues
1Kevin E. Trenberth, NCAR, Boulder, CO, USA2 Email: [email protected]
Phone: (303) 497-1318 Fax: (303) 497-1333
Abstract
A brief description is given of the developments in the tropical Pacific during the 1997-98 El Niño event and how well they were predicted by objective means (dynamical models and statistical methods) and how these were translated into forecasts to the community and public. The failure of a previously successful model inhibited early recognition of the event, although alerts were given in a very timely fashion, and the forecasts for the second half of 1997 were excellent. The description highlights research is-sues for both the physical scientists and social scien-tists. For the former, there is a call for more detailed description and diagnosis of what went on and the processes involved, and for studies, including numer-ical experimentation, to sort out the role of sea sur-face temperatures in different oceans and the prominent intraseasonal oscillations that existed through the buildup phase of the event, implications for the observing system, the role of global climate change, and attribution of weather and climate anom-alies to the El Niño. Further attribution questions arise in linking the climate anomalies to impacts and, because the event was forecast ahead of time, it is sug-gested that the successes and failures in mitigation of effects may provide useful analogs for societal re-sponse to global warming. Substantial issues arise on communication, use and utility of information, and the user needs.
Introduction
The development of the 1997-98 El Niño event into, by some measures, the biggest on record in over a century has given the CLIVAR community a won-derful opportunity to exploit an experiment mounted for us by nature. This event is the best observed ever and the worth of the TAO moored buoy system strad-dling the equatorial Pacific has been clearly
demon-1. Based in part on presentations made at the Seventh session of the CLIVAR SSG in Santiago, Chile (April 1998).
V
olume 3 No. 2/3, July 1998
CLIVAR
- Exchanges
strated by its ability to provide data that firstly showed the evolution of subsurface temperature anomalies and secondly was very useful for initializing models for successful prediction of the future evolution. “El Niño” is in the public vernacular. All kinds of things have been blamed on El Niño when sometimes there is at best a tenuous link. A new aspect of this event is that it was predicted by CLIVAR scientists well in advance, and forecasts were widely dissemi-nated. But how good were the forecasts? Were the ex-pressions of uncertainty appropriate? Were the forecasts used? And were they misused? How can the links to El Niño be established and impacts attributed? Clearly, this event demands a careful, in-depth analy-sis of its many aspects and has lessons for CLIVAR. It is expected that several workshops and conferences will touch on aspects important for a full retrospective examination of the 1997-98 event. There are a huge number of possible subtopics, with many of direct concern to CLIVAR. In this note, the main focus is on the forecasts of the developing stage of the event and possible lessons to be learned.
The Development of the 1997-98 El Niño
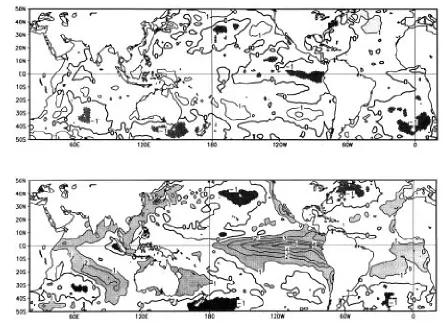
Several figures are presented to show the evolu-tion of the 1997-98 El Niño. The startling change in SST anomalies is revealed by the fields for December 1996 and 1997 (Fig. 1). Weak positive SST anomalies in the western tropical Pacific and SSTs that were more than 1°C below normal in the eastern Pacific gave no hint of the explosive warming that peaked in December 1997 with anomalies over 5°C above nor-mal. However, by December 1996 there were clear signs of the developing event below the surface of the ocean (Fig. 2). The evolution of the main relevant fields in the tropical Pacific can be seen as longitude-time sections of anomalies of zonal winds, SSTs, and the depth of the 20°C isotherm (Fig. 3). Note that the latter is in the middle of the thermocline (Fig. 2) and thus reveals the upper ocean heat content and thermo-cline evolution.
[image:5.595.78.522.399.724.2]The subsurface ocean observations come from the TAO array and are especially revealing when ex-amined week by week and month by month. The latter show a wonderful series of the evolution of observa-tions of the subsurface temperature and temperature anomaly (Figs. 2 and 3). TOPEX/Poseidon altimeter
CLIVAR
- Exchanges
V
olume 3 No. 2/3, July 1998
[image:6.595.59.551.75.402.2]Five Day Mean Zonal Wind, SST, and 20oC Isotherm Depth 2oS to 2oN Average Fig. 3: Time /
longi-tude sections of anomalies in the sur-face zonal winds (in m s-1), SST (in oC) and 20oC isotherm depth (in m) for the past 24 months. Analysis is based on 5-day averages be-tween 2oN-2oS of moored time series from the TAO array. Anomalies are rela-tive to monthly cli-matologies cubic spline fitted to 5-day intervals (COADS winds, Reynolds SST, CTD/XBT 20oC depths). Positive winds are westerly. Squares on the abscissas indicate
[image:6.595.57.552.464.736.2]longitudes where data where available at the start of the time series (top) and at the end of the time series (bottom). The TAO array is presently supported by the US (NOAA Office of Global Programs), Japan (JAMSTEC), Taiwan (NSC), Korea (STA) and France (ORSTOM). Further information is available from Dr. M.J. McPhaden (NOAA/PMEL) (courtesy of NOAA/PMEL).
Fig. 2: Longitude-depth cross-sections of mean TAO array temperatures from 2°S to 2°N in the equatorial Pacific Ocean for the months of December 1996 and December 1997. Contours every 1°C. Top panels: total field; bottom panels: cor-responding anomalies (courtesy of NOAA/PMEL).
V
olume 3 No. 2/3, July 1998
CLIVAR
- Exchanges
data (published in the NOAA Climate Diagnostics Bulletin) also reveal aspects of the evolution through the sea surface topography. Several other space-based sensors were also available to provide sea surface temperatures, surface winds, ocean colour and precip-itation and these should lead to a better description of the event than has ever been possible before.
The TAO data reveal that the subsurface anomalies which eventually developed into the El Niño were traceable at least from about September 1996 on the equator in the far western Pacific. However, positive subsurface temperature anomalies in the upper one to two hundred meters in the far western Pacific exceed-ed 1°C for all of the months of 1996, and so this was not a sufficient predictor. In addition, because sea lev-el anomalies are determined by salinity as wlev-ell as tem-perature anomalies, and the salinity is especially prone to change in the west Pacific Warm Pool when eastward shifts occur in heavy rainfall during El Niño, the TAO information is not sufficient for initializing models.
The contrast between the state of the subsurface in December 1996 versus December 1997 at the peak in SST anomalies (Fig. 1), is shown in Fig. 2. By De-cember 1996 subsurface temperature anomalies in the vicinity of the equator had grown to exceed 2.5°C at about 150 m depth and the warm anomaly extended from at least 140°E (the westernmost buoy) to 140°W. However, conditions were still below normal in the eastern Pacific. By December 1997, the subsurface warm anomaly had progressed eastward and ampli-fied to produce positive anomalies exceeding 11°C at about 100 m depth, accompanying the surface SST anomalies exceeding 5°C. Also note, however, in De-cember 1997 the subsequent cold anomaly of over 5.5°C in the western equatorial Pacific near 150 m depth, as the warm pool had been displaced into the central Pacific from 130 to 170°W.
In early 1997, positive anomalies in subsurface temperatures prevailed when integrated across the en-tire Pacific in the equatorial region. By the end of 1997, the heat content was clearly being depleted as negative anomalies appeared to dominate, and this trend has continued through May 1998 where the heat content is clearly anomalously below normal. This in-dicates the effect of the El Niño on effectively remov-ing heat from the tropical Pacific durremov-ing its course as has been found for the 1986-87 event (Sun and Tren-berth 1998). No doubt the heat losses after the peak in the event contributed to the exceptional warmth evi-dent in surface temperatures globally during the first five months of 1998.
Another key feature of this event was the
pres-ence of intraseasonal oscillations which may have helped to initiate the event. A prevailing theory of ENSO is that it behaves as a delayed oscillator in which Rossby waves travel westwards off the equator to the western side of the Pacific where they are re-flected and manifested as Kelvin waves along the equator and cause a reversal of the previous condi-tions. Evidence for such a sequence is not readily ap-parent in the onset of this event. Instead, the intraseasonal oscillations (40-50 day Madden-Julian Oscillation, (MJO)) were very prominent in the west-erly wind anomalies in the far western Pacific, with westerly bursts in December 1996, February, May, August, October, and November 1997, and each one is traceable as a down-welling Kelvin wave propagat-ing rapidly eastwards (across the Pacific in about 3 months) in the thermocline, as seen in the 20°C iso-therm anomalies, see Fig. 3. Thus within the overall envelope of the eastward developing subsurface tem-perature anomalies, there is important structure asso-ciated with the MJOs. The first warming at the surface in March 1997 coincided with the arrival of the down-welling Kelvin wave generated in December 1996 (Fig. 3). The role of MJOs in the development and in-tensification of the 1997-98 ENSO is a key scientific question (e.g., see Li and Zhou 1994, Li and Liao 1998).
Forecasts of the Onset of the 1997-98 El Niño Onset of some warming was predicted by sever-al dynamicsever-al models beginning about November 1996. These included the Scripps, NCEP, COLA, UKMO and ECMWF dynamical model predictions. There were also some notable failures (LDEO/Cane-Zebiak). Of forecasts available operationally (which did not include those from ECMWF), none captured the strength of the warming during the first part of 1997 (NCEP seems to come closest to observed). However, ECMWF did very well in forecasting ob-served tropical Pacific SST increases for May 1997 from December 1996, but this forecast was only avail-able later (see Stockdale et al., 1998). Several aspects of the predictions of the event are discussed by Ander-son and Davey (1998).
stand-CLIVAR
- Exchanges
V
olume 3 No. 2/3, July 1998
ard deviations for Niño 3.4 (170°W to 120°W, 5°N to 5°S) SSTs for JJA 1997 in September through No-vember 1996 but by February 1997 this method was not predicting as much or as rapid warming. Some in-termediate low order coupled models, which are typi-cally spun up with observed winds, were able to forecast the future evolution of the event once it had begun and the winds had changed, an example is the prediction by the BMRC intermediate model of Klee-man (1993), although the latter does assimilate sub-surface information as well.
In digesting these predictions in real time, it was not possible to make a forecast of the coming El Niño un-til April 1997 when SST warming first became clearly evident in the eastern tropical Pacific and the El Niño can be said to have begun. Expectations at the end of 1996 from forecast models based on past performance had led to considerable confidence being placed in in-termediate models such as the Cane-Zebiak model, which had successfully forecast the 1986-87 event (Cane et al. 1986, Zebiak and Cane 1987, Cane 1991). Hence, the failure of the Cane-Zebiak model to fore-cast warming in 1997 was a substantial inhibition on issuing a forecast for El Niño until it became clear that results from that model were unreliable and should not be considered. In January 1997, the NOAA Climate Prediction Center (CPC) issued an ENSO Advisory
[image:8.595.92.481.427.737.2]about the current cold phase of ENSO and indicated that conditions in the tropical Pacific “will gradually return to near normal by mid-1997, and become slightly above normal by the end of the year.” On April 9, 1997, a new ENSO Advisory was issued by the CPC in which they noted that warming in the trop-ical Pacific was progressing to the point where SST anomalies exceeded +1°C in the extreme eastern Pa-cific and near the date line by the end of March. The advisory noted that there were forecasts for warming later in the year and that conditions should be closely monitored. A subsequent advisory in May noted that a warm event had begun and the outlook was now for continued warming throughout the year. In Australia, the Australian Bureau of Meteorology, in its regular Seasonal Climate Outlook in May 1997 noted the like-ly development of an El Niño event and gave the im-plications for Australia of the likelihood for drier conditions across eastern Australia. In Japan, regular one month, three month and Warm/Cold season fore-casts are issued based on dynamical ensembles for one month and empirical methods for longer ranges. On May 20, 1997 the Japanese Meteorological Agency (JMA) released a forecast for a cold summer for Japan with 50% probability based on El Niño. While ob-served conditions were below normal in Nansei Is-lands, they were above normal over most of Honshu
V
olume 3 No. 2/3, July 1998
CLIVAR
- Exchanges
(the main Japanese Island) in summer 1997.
Information on the forecasts, advisories or warnings available in other countries is not readily available, although considerable information was ex-changed on the world wide web (www) and through the NOAA Experimental Long Lead Forecast Bulle-tins which publish, in near real-time, forecasts from many groups every quarter (see also Barnston 1997). In retrospect, given the historical performance of models, the CPC and agencies in other countries picked up on this El Niño very quickly and alerted the community through their advisories.
The Subsequent Predictions of the Event in 1997 As noted earlier, this event was one in which the full climate models were the most successful for the first time (see also Kerr 1998). These models consist of a full atmospheric general circulation model (GCM) coupled to a dynamical ocean GCM, at least for the tropical Pacific, and thus contain much of the
full complexity of the real world. One key advantage of this is that observations are of direct relevance to the atmospheric and oceanic state depicted by the models through data assimilation, whereas this is of-ten not the case for simple or intermediate models whose internal modes of variability generally differ from those in the real world. However, these models are not perfect and require corrections of various kinds, in some cases with flux adjustments to the mod-els themselves, or in other cases by allowing for the biases and systematic drifts in evaluating the results. The strategy for doing this varies from group to group and is a developing art. In addition, the results are not deterministic because of the fundamentally chaotic nature of climate dynamics. Consequently, small changes in initial conditions can give rather different outcomes. Nevertheless, the tropical Pacific appears to be predictable for a year or so in advance.
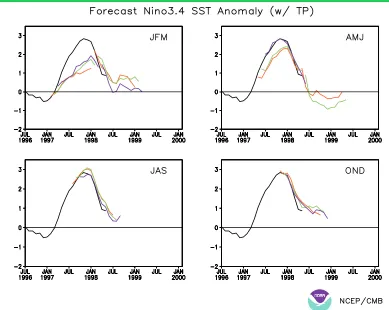
[image:9.595.73.538.353.739.2]One way to depict the predictability, for exam-ple, of the SST anomalies in the tropical Pacific, is to
Figure 5: Plume of monthly mean SST anomalies predicted for the Niño 3 region for forecasts initiated in a) November 96, b) February 97, c) May 97 and d) August 97. Three forecasts are initiated weekly and run for six months. The heavy line shows the observed values. From the ECMWF Seasonal Forecast Project page.
Apr Jul Oct Jan Apr Jul
1.0 0.0 1.0 2.0 3.0 4.0
SST (deg C)
Niño-3 SST anomaly, August 1997 starts
Forecast Observed
Oct Jan Apr Jul Oct Jan
1.0 0.0 1.0 2.0 3.0 4.0
SST (deg C)
Niño-3 SST anomaly, November 1996 starts
Forecast Observed
Oct Jan Apr Jul Oct Jan
1.0 0.0 1.0 2.0 3.0 4.0
SST (deg C)
ECMWF Experimental Seasonal Forecast Project
Niño-3 SST anomaly, February 1997 starts
Forecast Observed
Oct Jan Apr Jul Oct Jan
1.0 0.0 1.0 2.0 3.0 4.0
SST (deg C)
Niño-3 SST anomaly, May 1997 starts
Forecast Observed
a) b)
CLIVAR
- Exchanges
V
olume 3 No. 2/3, July 1998
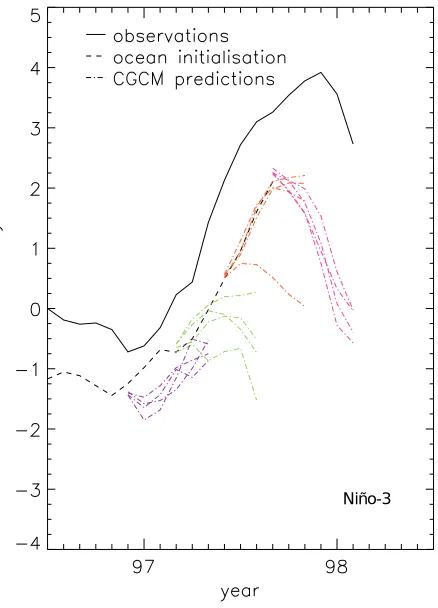
show how the different predictions from ensembles of model runs evolve. These are referred to as “plume” diagrams, and examples are shown in Fig. 4 for the Niño 3.4 (170°W to 120°W, 5°N to 5°S) region for NCEP (A. Leetmaa, personal communication), and one result is shown for each month for 11 months in advance. Other examples are given in Fig. 5 for Niño 3 for ECMWF (from ECMWF 1997) showing 13 en-semble members as 6 month forecasts (although not available in real time) and Fig. 6 for the UKMO (cour-tesy M. Davey). For the UKMO, initialization uses winds only and the model cold bias led to a displace-ment in the initial value of the anomaly in Niño 3 SSTs. In this case, the change is the quantity of inter-est.
Warming was predicted by the NCEP model from November 1996 although the magnitude was un-derestimated by at least a factor of 2 prior to April 1998. Forecasts after that time, at least until May 1998, were excellent. In November 1996, ECMWF 6 month forecasts picked up on the modest warming, but in February 1997, the model prediction indicated a levelling off of the warming in May, whereas the ob-servations showed it continuing. By August, the EC-MWF forecasts were overpredicting the warming, although they correctly indicated the drop off in anomalies in January and February 1998, as did the forecasts from NCEP beginning as early as June 1997. Similar plume forecasts of ensembles from the UKMO show reasonable warming being forecast from December 1996, warming in most but not all en-semble members in February 1997 although with sub-stantially underpredicted magnitude by 4 months, pronounced realistic warming in most forecasts in May 1997 but with cooling being predicted prema-turely in August 1997. Forecasts from other centres demonstrated skill as well, but the ones shown are rep-resentative of the state of the art.
[image:10.595.311.530.87.391.2]Conditions in the tropics are generally regarded as being fairly predictable, given large SST anoma-lies. However, there were exceptions in the 1997-98 event. In Australia, winter (JJA) 1997 rainfall was be-low average over most of eastern Australia but the de-partures were much less than in other major El Niños, such as 1982-83. In India, summer (JJA) 1997 rainfall was only slightly below normal. One factor contribut-ing to the latter, in particular, seemed to be the intra-seasonal oscillations which were strong enough to overcome the larger-scale tendency for dry conditions and brought rain events through the region. The MJOs no doubt had significant influences in other parts of the globe and vice versa (Slingo 1998).
Figure 6: Plume diagrams of the evolution of fore-casts of SST anomalies in the Tropical Pacific from the UKMO for Niño 3 (courtesy S. Ineson). The solid line is the observed, the dashed is the initial ocean state (tropical Pacific OGCM forced by FSU wind anomalies with no assimilation of ocean observa-tions so the model ocean is biased colder than ob-served in 96/97). The other lines are 4 member ensemble members starting on successive days as 6-month predictions using the tropical Pacific OGCM + Hadley Centre ACGM; monthly values are plotted with the first point for each trajectory as the predic-tion for month 1, so displaced from the initial state.
In the extratropics, conditions are not as predict-able. There, established teleconnections and statisti-cally reliable relationships are often used to identify effects of El Niño. This again was an example where full GCM model results provided useful guidance that would not have otherwise been possible. Stockdale et al. (1998) provide an example of an ECMWF forecast of highly statistically significant wet conditions over Europe during the summer (June-August) 1997 which largely verified but would not have been expected from past experience. In places where a pronounced signal often occurs, such as over India and Australia, the model forecasts indicated no clear signal and the result was indeed not a classical signal of much drier than normal conditions. However, the ECMWF fore-cast for JJA did not pick up on the heavy rains in Chile
V
olume 3 No. 2/3, July 1998
CLIVAR
- Exchanges
which eventuated. Above, we further noted that the statistical expectation for Japan for their summer was mostly incorrect. These examples show the limits to statistical analyses which do not have a large enough data base on which to discriminate between different “flavours” of El Niño, and the potential power of models which can predict the unique aspects associat-ed with a particular event. Models can, in principle, also factor in other different factors such as the chang-ing climate and global warmchang-ing effects.
A superficial assessment indicates that some ef-fects fit the classical model (as given by previous events), but many did not. Another area where highly anomalous conditions were experienced was Kenya and the horn of Africa region where heavy rains were surely linked to very high SSTs in equatorial Indian Ocean (above 95th percentile, above 29°C) after about September 1997. The rains in northeastern Ken-ya and southern Somalia were apparently the heaviest since 1961. They began in October 1997 and contin-ued through January 1998 leading to a major outbreak of Rift Valley fever – not only in livestock but also with tens of thousands of cases in humans (P. Epstein, personal communication). Major convection in this area clearly had an impact on the divergent atmos-pheric circulation and there is good reason to believe it altered teleconnections. These aspects need to be es-tablished more firmly. It is likely that these changes had impacts on Australia, India, Southern Asia, – all regions where conditions were not as dry as expected from past events – and elsewhere, but again these need to be confirmed.
Forecasts of the northern winter were made well ahead of time and were widely publicized and, fortu-nately, were generally excellent. In the United States, patterns of temperature and precipitation anomalies were forecast based in part on model output but in large part on statistical relationships developed in the Climate Prediction Center of NOAA, and matched the observed remarkably well. These aspects will not be pursued here.
Research Questions Arising from the El Niño Event
1. Role of MJOs
Given the presence of strong MJOs throughout the developing phase of this event,
• Were these waves a key in triggering and amplify-ing the event?
• Or was their role minimal, as El Niño occurs in intermediate models that do not have MJOs? i.e., are they merely “embroidery”? This is the
prevail-ing hypothesis because no GCMs simulate MJO waves very well, yet several made skilful predic-tions. However, some MJO effects are in the initial conditions for forecasts, especially in the surface winds. If MJOs are important, it has implications for predictability and highlights the need to improve models.
• Was their continual presence a reason for the large magnitude of this event?
• If they are important, why is that the case? Pre-sumably it must relate to positive feedback effects arising from changes in SSTs and subsequent changes in winds.
The role of MJOs in the 1997-98 ENSO is a key question that can and should be explored with diag-nostic and numerical experimentation studies. For in-stance, as well as diagnostic studies of observations, the initial conditions in an atmospheric model can be altered to remove the MJO and thus alter its influence on the ocean.
2. Forecast verification and accuracy
As well as the onset of the event, dynamical model-based forecasts of the evolution of tropical SSTs continued to be made throughout the event and appeared to show considerable skill for several months in advance, including the timing of the peak in SST anomalies in December 1997.
We need to answer how well the event was fore-cast throughout, both for SST forefore-casts and the weath-er regimes around the world (coastal weath-erosion, precipitation, temperature, storminess, flooding, drought, fires, etc.).
In addition, an important research question is to be sure why some models did well and other models did not do well, in spite of strong similarities in sever-al of the models. Unravelling the role of initisever-al condi-tions for each model, the ocean physics, the atmospheric physics, and the coupling is a challeng-ing task.
3. SSTs in other regions
CLIVAR
- Exchanges
V
olume 3 No. 2/3, July 1998
Philippines, and did not spread as much to Australia and parts of Southeast Asia.
SST anomalies also developed in the extratrop-ical Pacific of both hemispheres, as is expected (nota-bly cold anomalies about 40°N and 40°S just east of the dateline).
There is a strong need for numerical experimen-tation to test effects of high SSTs in other tropical oceans: Indian and Atlantic, to sort out what might be attributed to the tropical Pacific SSTs, and whether the extratropical SST anomalies played a role. This is readily done by specifying SST patterns in different oceans and running atmospheric GCMs.
Of course, warming in the tropical Indian Ocean usually accompanies El Niño events, so these other SST anomalies also may not be independent of those in the Pacific. A possible interesting experiment was discussed at the April 1998 CLIVAR SSG meeting (by Trenberth and Palmer). It would be to run an at-mospheric model with the observed Pacific SSTs only (for 1997). Use the winds and heat fluxes from this ex-periment to drive an Indian Ocean model. The scien-tific question - was the big SST anomaly in the Indian Ocean forced by El Niño, via an atmospheric telecon-nection, or was it independent of El Niño?
4. Global warming factors
The above mentioned warmth of all the tropical oceans, along with mild conditions elsewhere late in the 1997, led to 1997 being the warmest on record. This warmth has continued into the first five months of 1998 where February 1998 appears to have been by far the warmest month on record in terms of its anom-aly which was 1.6°C above the 1961-90 normal for land areas (as reported in the Climate Diagnostics Bulletin); previous anomalies have not exceeded 1.0°C except for January 1998. Part of this warmth may have arisen from the release of heat from the tropical Pacific into the atmosphere, cooling the ocean, as was noted above. Over the United States the winter (December-February) 1997-98 was second warmest on record since 1895.
Another major question concerns whether glo-bal warming itself is contributing to the prevalence and size of the El Niño. Trenberth and Hoar (1996, 1997) have noted the unusual behaviour of El Niños in the past 20 years as the tendency toward more El Niños and fewer La Niñas has become more apparent. The magnitude of the 1997-98 El Niño has reinforced this evidence.
This also highlights the need for more compre-hensive models, ones that deal not just with El Niño and SSTs but also changes in atmospheric
composi-tion including both increases in greenhouse gases and aerosols from human activities and debris from vol-canic eruptions. The role of the El Chichon eruption in April 1982 at the time of onset of the 1982-83 El Niño has yet to be deciphered. How much did this eruption contribute to differences between that event and the 1997-98 event? All these climate forcings need to be included in forecast models and it must be recognized that interannual variations occur in the setting of the decadal and longer-term variations.
In any case, short-term climate anomalies pro-vide many useful analogs for longer-term climate change studies about impacts and societal response. Analogs include
• Sea level rise along the coast of California, which combined with storms to produce excessive coastal erosion. Sea level is expected to rise in general with global warming.
• The substantially above normal temperatures over land mirror the kinds of changes projected with global warming. It is also noteworthy that the larg-est warming occurred in areas of below normal rainfall while excessive rainfall and associated cloud accompanied cooler conditions.
• Precipitation patterns change, leading to flooding in some areas such as Chile, Peru, California, the Southeast U.S, and drought in other places (Indo-nesia, Central America) leading to out-of-control fires often arising from slash and burn agriculture, in spite of ample warnings.
• With the fires came respiratory problems in adja-cent areas 1000 km distant. Disease outbreaks, such as Rift Valley fever in Kenya, cholera in Peru, and malaria in Africa occurred and could have been and were anticipated to some extent.
• Because predictions were made, individuals and institutions could respond. Some chose not to; some were unable to.
All of these and many more provide examples of how successful mitigation may be.
5. The 1997-98 El Niño impacts
V
olume 3 No. 2/3, July 1998
CLIVAR
- Exchanges
initial states in the atmosphere to generate the appro-priate statistics and compare these with normal condi-tions. In this way a rigorous probabilistic statement can be made about the likelihood that a given anoma-lous weather event was made more likely by the El Niño. Some studies at the NOAA Climate Diagnostics Center are making ensemble forecasts with and with-out anomalous SSTs to determine the influence on the evolution of the forecast; the other factor is the anom-alous initial state of each forecast. In the 1997-98 El Niño, a general characteristic of the dynamical model forecasts which follows from the magnitude of the anomalies, is that the forecasts tended to be more con-sistent than usual, more skilful than usual, and the anomaly patterns are large-scale and coherent, all of which helps with the attribution question.
Attributing other things such as outbreaks of disease or pests is even more difficult as these require a chain of events linking the El Niño to a particular weather phenomenon which in turn favours outbreaks of some kind that lead to the impact in question. Ex-amples include warmer and wetter conditions which favour more malaria-carrying mosquitoes, or absence of a freeze that would kill off or reduce a pest or fun-gus and thus which subsequently causes problems with fauna.
Many questions arise here.
• What was caused by El Niño, what can be attrib-uted to it?
• What were clearly linked to El Niño and what were only tenuously linked?
• What impacts were positive?
- 1997 Atlantic hurricane suppression.
- Warm conditions over North America in 1997-98 winter, less heating, less coal, oil and natural gas use, and lower heating bills for consumers. • What impacts were negative?
- Layoffs in natural gas industry.
- Coastal damage, flooding, drought, fires, etc. - Tornadoes in Florida, ice storms in Canada and
New England.
No attempt is made here to compile a list. In-stead, it is clear that lists do need to be compiled and the task will not be easy. It is apparent that for many positive impacts, there were negative impacts else-where. For instance, while it may be possible to at-tribute the tornadoes in Florida to the active and southward-displaced storm track, thereby favouring the conditions that led to the outbreak in that location, it is possible that tornadoes may have simply occurred elsewhere, such as in Georgia. Similarly, other exam-ples above are the benefits of warm conditions on con-sumers but not on the heating companies, and the shift
in hurricane activity from one ocean basin to another. These highlight the need to separate the positive and negative effects or else one might conclude that the ef-fects of El Niño economically were zero because of cancellation between huge positive and huge negative impacts.
There is a need for data base development of various kinds and careful analysis.
Acknowledgements
The author is the Co-chair of the CLIVAR SSG and this article arose from the presentations made at the Seventh session of the SSG in Santiago, Chile in April 1998. In particular, contributions from T. Palm-er, A. Busalacchi, N. Nicholls, R. Mechoso, A. Moura, K. Hanawa, C. Li, J. Mitchell, M. Davey, A. Leetmaa, E. Sarachik, W. Lau and D. Battisti are ap-preciated. The use of figures (Fig. 2 and Fig. 3) from the TAO Project Office of NOAA/PMEL, Michael McPhaden, Director, is also acknowledged. Vernon Kousky kindly provided Fig. 4.
References
Anderson, D.L.T., and M.K. Davey, 1998: Prediction of the El Niño of 1997/98. Weather, submitted.
Barnston, A.G., and C.F. Ropelewski, 1992: Prediction of ENSO episodes using Canonical Correlation Analysis. J. Climate, 5, 1316-1345.
Barnston, A.G., 1997: ENSO forecasts for 1998: Experi-mental long lead predictions. Proc. Twenty-second Annual Climate Diagnostics and Prediction Workshop. Oct. 6-10, 1997, US. Dept. Commerce, 6-9.
Cane, M.A., 1991: Forecasting El Niño with a geophysical model. In “ENSO Teleconnections Linking Worldwide Cli-mate Anomalies: Scientific Basis and Societal Impact”. M. H. Glantz, R.W. Katz, and N. Nicholls, Editors, Cambridge University Press, 345-370.
Cane, M.A., S.E. Zebiak and S.C. Dolan, 1986: Experimen-tal forecasts of El Niño. Nature, 321, 827-832.
ECMWF 1997: Seasonal forecasting at ECMWF. ECMWF Newsletter, 77, Autumn 1997, 2-8.
Kerr, R.A., 1998: Models win big in forecasting El Niño. Science, 280, 522-523.
Kleeman, R., 1993: On the dependence of hindcast skill on ocean thermodynamics in a coupled ocean-atmosphere model. J. Climate, 6, 2012-2033.
Li, C., and Y. Zhou, 1994: Relationship between intrasea-sonal oscillation in the tropical atmosphere and ENSO. Chi-nese J. Geophysics, 37, 213-223.
Li, C., and Q. Liao, 1998: The exciting mechanism of trop-ical oscillation to El Niño event. J. Troptrop-ical. Meteor., 4, 118-126.
Slingo, J.M., 1998: Extratropical forcing of tropical con-vection in a northern winter simulation with the UGAMP GCM. Quart. J. Roy. Meteor. Soc., 124, 27-52.
CLIVAR
- Exchanges
V
olume 3 No. 2/3, July 1998
Stockdale, T.N., D.L.T. Anderson, J.O.S. Alves and M.A. Balmaseda, 1998: Global seasonal rainfall forecasts using a coupled ocean-atmosphere model. Nature, 392, 370-373. Trenberth, K.E., and T.J. Hoar, 1996: The 1990-1995 El Niño-Southern Oscillation Event: Longest on record. Geo-phys. Res. Lett., 23, 57-60.
Trenberth, K.E., and T.J. Hoar, 1997: El Niño and climate change. Geophys. Res. Lett., 24, 3057-3060.
Zebiak, S.E., and M.A. Cane, 1987: A model El Niño-Southern Oscillation. Mon. Wea. Rev., 115, 2262-2278.
Dr. Kevin E. Trenberth is a senior scientist and Head of the Climate Analysis Section of the National Center for Atmospheric Research (NCAR) in Boul-der, Colorado. Before joining NCAR in 1984, he was a Professor of Atmospheric Sciences at the University of Illinois and earlier worked in the New Zealand Me-teorological Service. Dr. Trenberth was a convening lead author of the 1995 IPCC Scientific Assessment of Climate Change. He has published over 250 scientific articles or papers, including 23 books or book
chap-ters. He is currently co-chair of the Scientific Steering Group for the World Climate Research Programme's Climate Variability and Predictability (CLIVAR) pro-gramme. Dr. Trenberth is a Fellow of the American Meteorological Service and the American Association for the Advancement of Science, as well as an Honor-ary Fellow of the New Zealand Royal Society.
Some Lessons from the 1997-98 El Niño Event
The 1997-98 El Niño – Possible activities
The following lists some initial suggestions for activities, it is not intended to be comprehensive.
On the physical climate side:
• description of event: gathering requisite datasets • diagnosis of processes, empirical studies
• verification of numerical predictions, forecasts • development of forecast verification techniques,
especially using ensembles
• implications of the event for the observing system • implications for model development
• numerical experimentation • the role of global warming
• attribution of local and regional climate anomalies to the event,
• any process studies that should follow?
On human dimensions and applications side:
• proliferation of “information” (e.g. on the www) of mixed quality
• attribution of impacts to El Niño • impacts of El Niño
• costs/damage and benefits of El Niño
• actions taken because of forecasts (whether useful or not)
• impacts of actions not taken
• impacts of busted forecasts where actions were taken
• assessment of information available • utility of information
• effectiveness of communication and dissemination of information
• benefits of forecasts (mitigating losses etc.)
• assessment of user needs and how well they were met.
The CLIVAR plans in this area are developing. They fit within a United Nations framework on El Niño that has occurred independently of the CLIVAR initiative. The UN General Assembly passed a resolu-tion in December 1997 on Internaresolu-tional Cooperaresolu-tion to Reduce the Impact of the El Niño Phenomenon. The resolution, which was coordinated under the frame-work of the International Decade for Natural Disaster Reduction (IDNDR), has led to the establishment of an El Niño “Task Force” encompassing several UN agencies and programmes. The WMO, for example, has been asked to take the lead in coordinating the pro-vision of scientific and technical advice on El Niño, other agencies will coordinate the socioeconomic im-pacts and response aspects.
V
olume 3 No. 2/3, July 1998
CLIVAR
- Exchanges
CLIVAR Upper Ocean Panel 3rd Session
Toulouse, France, 27-29 April 1998
T
he third meeting of the CLIVAR Upper Ocean Panel focused mainly on the development of a basic observing system for sea level, S(z) and T(z) for the purposes of CLIVAR research.For almost all Principal Research Areas of CLI-VAR (e.g. G1 (Salinity important for ENSO forecast-ing), G2 (E-P), D5 (Thermohaline circulation), A1/2 (long term trends), etc.) a regular systematic sampling of temperature and salinity of the upper ocean is nec-essary to achieve the goals of CLIVAR. This will be especially true for the understanding decadal variabil-ity and processes in areas where deep convection is important.
Based on the proposals for an Array for Real-time Geostrophic Oceanography (ARGO) and for Global Ocean Salinity Monitoring (GOSAMOR) fo-cusing on a global observations for T(z) and S(z), the UOP came to the following conclusions:
During the last two years there has been signifi-cantly progress made in the technical development of the salinity sensors and float equipments that enable a global coverage (about 3000 floats) with these instru-ments at feasible costs (about $12M). Additionally, salinity measurements from merchant ships, moor-ings, drifting buoys and stations are becoming more common in the near future. Hence the UOP recom-mended that CLIVAR implements a global pro-gramme of routine sampling of T(z) and S(z) using a bunch of techniques.
Although the systematic errors of the different observational methods could be reduced substantially (e.g. altimetry, XBT, XCTD), there is a need for a combination of the different methods to reduce the er-rors to a level that allows the detection of decadal and long term climate variability in the upper ocean. Therefore the UOP will work towards an integrated global observing system for CLIVAR to detect natural climate variability on different timescales (seasonal to decadal)
• to monitor long term climate trends (naturally or anthropogenically caused)
• to deliver products needed to calibrate and validate satellite measurements
• to provide observational data for validation of models resp. assimilation into these models (e.g. for purposes of climate forecasting).
Additionally to the proposed global float array, special attention is needed along the boundaries / in
narrow channels. Furthermore this proposed measure-ment system will provide measuremeasure-ments up to a depth of about 2000 meters at present time. Deep ocean measurements (e.g. needed for the monitoring of long term trends) cannot be covered by this network.
For the implementation of the proposed global array as a multinational effort, the UOP recommended to organize a workshop within 6 months. This would enable CLIVAR to present a detailed plan for the main basic upper ocean observational network in time for the CLIVAR conference in December. It was pro-posed to hold the meeting in conjunction with the first GODAE steering group meeting beginning of July in Tokyo.
Other UOP business:
The UOP discussed in depth the future of the panel. It was felt that the UOP will be needed in future to act as an scientific advisory and oversight commit-tee for CLIVAR and the OOPC. In contrast the OOPC is mostly concerned with the implementation aspects of an operational ocean observing system. Therefore is was felt that a dissolving or a merging of the UOP with the OOPC would not be the right way. The im-plementation of the proposed monitoring array during the next year will be one of the main tasks of the panel. Additional efforts are required to work towards an in-tegrated observing system for the purposes of CLI-VAR.
The UOP has now been in existence for three years and it was felt that the panel should start to ro-tate membership. The current chair Dr. Ants Leetmaa would like to step down from his chairmanship by end of this year. He would like to stay on the panel for an-other year and rotate off thereafter. Dr. Chet Koblin-sky has been proposed as his successor.
A.Leetmaa, A.Villwock
Prospectus for ARGO
A global profiling float array
Dr. Neville Smith,
BMRC, Box 1289K, Melbourne, Vic. 3001, Australia, [email protected]
1. Background
ina-CLIVAR
- Exchanges
V
olume 3 No. 2/3, July 1998
bility to adequately observe the ocean, both historical-ly and now, effectivehistorical-ly limiting progress. Technical and logistical constraints restrict the rate of data flow and our ability to observe globally at a resolution that is useful.
The ocean community is presently determining implementation strategies for two major endeavours, CLIVAR (the Climate Variability and Predictability Programme of the World Climate Research Pro-gramme) and GODAE (the Global Ocean Data As-similation Experiment). Both have a strong, and understood, need for direct observations of the ocean (complemented by remote sensing and modelling) but, to this point, the prospects for satisfying these re-quirements have been limited.
This paper proposes a strategy for meeting the global requirement. The strategy is based on the de-velopment of a truly global ocean in situ observing system, using existing and trusted methods such as the Tropical Ocean-Atmosphere array and Volunteer Ob-serving Ships as the foundation, and a major deploy-ment of profiling ocean floats to complete the global sampling. The project has been christened ARGO1 since it is seen as an essential complement to the sat-ellite altimetry mission JASON and its successor mis-sions.
2. The Scientific Case: GODAE and CLIVAR GODAE is in essence an experiment in global ocean estimation, with applications ranging from the provision of boundary conditions to coastal prediction systems, to initialization of climate models. Its overall aim is to demonstrate the viability, feasibility and practicality of operational oceanography and a truly global, integrated ocean observing system. At its first meeting, the GODAE Scientific Steering Team con-cluded that a significant enhancement of the global di-rect ocean observing network was necessary for the successful execution of the experiment in 2003-2005
1. The present paper has been developed from two pre-vious discussion papers, one of which was titled A proposal for Global Ocean Observations for Cli-mate: the Array for Real-time Geostrophic Ocea-nography (ARGO), by D. Roemmich. At around the same time a second paper was prepared, with the same observational basis but focused on salinity, and titled GOSAMOR (for Global Ocean Salinity Moni-toring, by R. Schmitt). This paper combines these ideas within the context of scientific discussions which have taken place within GODAE and CLI-VAR, retaining ARGO as the reference name.
and recommended a major float deployment to meet this requirement. The enhancements were needed to fill gaps in global coverage, to provide more frequent, real-time samples of the ocean and to complement other components of the GODAE system. The GO-DAE strategy emphasises the complementary role of the direct and remote observing networks and the role of models and data assimilation in integrating incom-ing information and producincom-ing useful and practical outputs.
The focus of CLIVAR is improved understand-ing of climate variability and predictability and the de-velopment of models useful for prediction. The time scales range from the intraseasonal scales of the mon-soon systems, through interannual scales of phenom-ena like the El Niño, to decadal and longer variations and trends. CLIVAR has concluded that a global sus-tained network of temperature and salinity observa-tions is critical for most of its Principal Research Areas (PRAs) but particularly for understanding dec-adal variability and processes in areas where deep convection is important. CLIVAR noted that the pau-city of global subsurface salinity data constituted a major weakness, in effect limiting scientific progress in climate studies.
Based on these considerations, CLIVAR has recommended the implementation of a global network of profiling floats, integrated with other elements of the climate observing system, to detect natural climate variability on different timescales (seasonal to dec-adal), to monitor long term climate trends (naturally or anthropogenically caused), to deliver products needed for calibration and validation of satellite meas-urements, and to provide data for validation of models and for assimilation and climate forecasting.
V
olume 3 No. 2/3, July 1998
CLIVAR
- Exchanges
3. The Proposal
Existing observational methods for the upper ocean, such as the Ship-of-Opportunity Programme of XBTs and the Tropical Atmosphere-Ocean array in the Pacific have been extremely successful and pro-vided important data for TOGA and WOCE. However the sampling of the former is biased by the merchant shipping routes while the latter is most effective in the near-equatorial regions. Both are limited in terms of depth-range (typically less than 750 m) and salinity sampling.
Neither GODAE nor CLIVAR can be sustained with a fragmented, regional set of observations since both are inherently global and, in the case of CLI-VAR, have obvious needs for deeper measurements and for salinity as well as temperature. This paper pro-poses that recently developed profiling float technol-ogy provides a cost-effective, feasible solution to this problem.
The profiling float is based on technology de-veloped within WOCE by R. Davis to track currents at mid-depth using an autonomous freely-drifting de-vice called ALACE (Autonomous Lagrangian Circu-lation Explorer) which has the ability to periodically cycle to the surface, transmit data and have its position fixed, then sink once more to its drifting depth. In the latter phase of the WOCE observational programme these devices were fitted with thermistors so that tem-perature profiles could be obtained as it surfaced (re-ferred to as PALACE floats, though variants of such devices exist elsewhere, e.g. MARVOR). Recently stable, medium-cost salinity sensors have also been added, paving the way for a new approach to temper-ature and salinity sampling. Trials in the North Atlan-tic have shown that the technology works, including real-time transmission. The big challenge is to find a way to apply this technology globally, with a sam-pling that is effective for both CLIVAR and GODAE, and with a view to satisfying the long-term needs of GCOS/GOOS.
It is not possible to be truly objective in the pre-scription of desired global sampling since both GO-DAE and CLIVAR are aiming for complicated, model-based processing streams with multiple-pa-rameter input streams. The community has little expe-rience combining in situ and satellite data for ocean estimation, and there is essentially no historical coun-terpart to the proposed data stream upon which esti-mates of required climate sampling might be based. In
the absence of such basic knowledge, both GODAE and CLIVAR are relying on subjective, consensus es-timates by scientists familiar with ocean data and those involved with satellite data and modelling. The best-guess at present is:
• a global array of around 3000 profiling floats, measuring both temperature and salinity, giving an effective spatial sampling of 250-300 km;
• a cycle time for each float of 10-14 days, yielding around 80,000 profiles per year; and
• a park depth at around 1500 m (determined by the need for subsurface drift data) and a profile depth of 1500-2000 m.
To first order, this would double the number of profiles presently available per year through the com-bined efforts of the Ship-of-Opportunity Programme and TAO, but with enhanced vertical extent and sality (close to a factor of 4 increase in the available in-formation). Moreover, the sampling would preferentially target the data sparse regions, increas-ing its value in the context of determinincreas-ing the global ocean circulation.
4. Technical and Resource details
Like the sampling strategy, there are many tech-nical and resources uncertainties, concerning the de-velopment and cost of the float itself, concerning telemetry, and related to deployment. It would be un-wise and irresponsible to paint an over-optimistic pic-ture, but equally it would be a poor strategy that did not take account of likely improvements and attempt to build a realistic assessment. In the following we try to give cost and capability estimates for the present, near-future (Year 2000) and five years hence when presently developing technology should be ready for implementation and GODAE is beginning its inten-sive, “experiment” phase.
Cost and Capability Present
Para-meter
Unit Cost
Lifetime # Sam-ples
z resolu-tion
accuracy
U
AVER-AGE
$8K 2-3 yrs. 50-60 at
1200m
5%?
+ T +$2K 2-3 yrs. 50-60 80 pts,
1200m 0.02
o C
+ S +$5K 1 yr. ~ 25 80 pts,
1200m
CLIVAR
- Exchanges
V
olume 3 No. 2/3, July 1998
Several factors impinge upon the cost per unit of information from a float programme including
• Assume ARGO has a phased implementation, allowing for necessary R&D, reaching full imple-mentation around 2003;
• Cost of the unit, and cost of the T and S sensors (instrument builders are estimating costs lower than those quoted above, ~ $7500, not including possible savings from “mass” production); • Power available, presently split 50-50 between
profiling and communications: power expended per unit of information transferred is the key parameter. A factor of 2 improvement is assumed; • Capability to profile deeper than the drift level
(available now);
• The number of cycles is directly determined by available power, so it is critical they are attuned to the signal of interest;
• Stability of sensors; S is presently stable for 1 year; projected 4-fold improvement by 2003;
• Band-width available from platform to base (Argos projects x 4 improvement);
• Availability of 2-way communications (permits order of magnitude improvement in use of power, and thus order of magnitude improvement in band-width). The tables assume that by 2003 full
resolu-tion and accuracy can be communicated in real-time.
GODAE would place highest premium on the spatial and temporal sampling, while CLIVAR places a high premium on accuracy, vertical resolution and the availability of stable and long-life salinity sensors.
5. Schedule and Investment
Many of the details of the ARGO implementation are yet to be debated, and the projected total cost has several uncertainties. However we can make a reason-able estimate based on the treason-ables above and expected add-ons and processing costs. Assume
• Telemetry at 10% of hardware costs. Presently ARGOS would cost around $10 per profile; future enhancements would more likely be used to improve the information content of the teleme-tered message rather than reduce cost.
• Deployment costs at around 15% of the hardware costs. The GOSAMOR proposal estimates were considerably larger than this but there is no reason to expect that ARGO will be significantly different from the present surface drifter deployment costs, which are minimal. In any event, we could safely assume significant levels of in-kind support from the international community.
• It is critical that realistic levels of scientific and processing support are included in the budget. WOCE and TAO experience suggests up-front investment is most effective (i.e., allow for scien-tific QC and data and information management as close to the source of the data as possible). • All data transmitted in real-time but allow for at
least dual processing streams; one to effect circu-lation of data to operational centres (e.g., via ARGOS), another to apply necessary scientific QC for the climate (final) data sets (TAO is probably a good model).
In the following table we assume 25 cycles per year and an incremental improvement in the life-time of the float sensors as indicated (T and S for tempera-ture and salinity respectively). The seeding rate is as-sumed to apply for the whole period. The cost per profile is calculated from the unit cost divided by the total number of expected cycles times the total per-centage overhead (estimated to be 50% for 2003-2005).
Years 2000-2002
Para-meter
Unit Cost
Lifetime # Sam-ples
z resolu-tion
accuracy
U
AVER-AGE
$6K 3-4 yrs. ~ 100 at
1200m
5%?
+ T +$2K 3-4 yrs. ~ 100 80 pts,
1200m 0.02
oC
+ S +$4K 2 yrs. ~ 50 80 pts,
1200m
0.01
Years 2003-2005
Para-meter
Unit Cost
Lifetime # Sam-ples
z resolu-tion
accuracy
U
AVER-AGE
$5.5K 4 yrs. 100-120 at 1500 m
5%?
+ T +$1.5K 4 yrs. 100-120 800 pts,
2000m 0.01
oC
+ S +$3K 3-4 yrs. ~ 100 800 pts,
2000m
V
olume 3 No. 2/3, July 1998
CLIVAR
- Exchanges
In summary, we are expecting ARGO to have an annual budget of around US$12M for the period 2003 and beyond. If experience in meteorology is used as a guide, we might expect many efficiencies but these are likely to be offset by greater demand (denser and more frequent sampling and/or deeper profiles and/or more sophisticated instrumentation). The total budget is probably of the same order as that presently invest-ed in TAO and SOOP combininvest-ed but, it can be arguinvest-ed, is at least, if not more efficient in terms of the infor-mation returned. It is also of the same order as that projected for Jason 2 (~70%) if that mission reaches its targeted efficiencies.
6. Implementation
There are of course many uncertainties, perhaps the greatest being the capacity of the community to undertake the necessary scientific and technical de-velopment on the above schedule. The needed invest-ment is also significant but it must be cast in the light of expected international investment in ocean obser-vations. If TOGA and WOCE are used as a guide, then we might have expected at least such an investment in oceanographic research observations in the normal course of research programmes over the next decade (indeed, cast in this light, the return from ARGO is in fact both efficient and extremely high). The fact that GODAE (and GCOS/GOOS) are targeting operation-al activities opens up the opportunity of obtaining sig-nificant investment from outside the research
community, just as operational agencies now provide significant resources for the surface float programme.
The above allows for a modest R&D schedule, with perhaps the improvement in the salinity sensor being the most difficult target. The costs have been based on experience with PALACE floats, but other platforms (SOLO, Marvor, ..) are available. For cli-mate applications, improvements in telemetry are es-sential; these might come from expected enhancements to ARGOS or via other developing communications.
The development of the global system is likely to be done both regionally and globally, using existing and developing projects as the basis. A possible phased approach is
• 1998-1999 ACCE and its continuity; 1st deploy-ments in N. Pacific units: 400
• 2000-2001 Implement N. Pacific, maintain and expand Atlantic array 1000
• 2001-2002 1st Southern Ocean and Indian Ocean deployments 2000
• 2003 Focus on targeted global coverage 2500 • 2004+ ARGO implemented 3000
7. Planning
A GODAE/CLIVAR ARGO Workshop
This paper is intended as background for a Workshop on the ARGO proposal, to be held with the second meeting of the GODAE Scientific Steering Team 6-10 July, Tokyo. The Agenda for the Work-shop will include
(a) Review of the scientific rationale for ARGO (for-merly ARGO and GOSAMOR);
(b) Review of the main technical issues;
(c) Review of the draft resource outlook, emphasising that the outlook must be realistic and practical; (d) Review the draft sampling strategies, including
spatial density, frequency of cycles, depth range, drift depth, need for T and S, needed accuracy, etc. (e) Decide minimal and ideal strategies, the former being a cut-off at which ARGO is abandoned as a project;
(f) Draft an outline of a phased implementation, not-ing critical dependencies and links; and
(g) Decide on a work plan, including needed technical and scientific meetings/workshops, means of or-ganisational support, links to GODAE, CLIVAR, satellite agencies, etc.
Present T~2yr, S~1yr
2000-2002 T~3.2yr,
S~2yr
2003-2005 T~4yr, S~3yr
Investment in H/W
~ $3M ~ $5M ~$8M
Add-on costs $0.75M $1.25M $2M
Processing ($1M?) $1M $2M
Total Invest-ment/yr.
$4M $7.25M $12M
Seeding rate/yr.
250 (75 with S)
500 (250) 800 (800)
Total # pro-files/yr.
12,500 (1,875)
40,000 (12,500)
80,000 (60,000)
Cost/drift+T ~ $265 ~ $150 ~ $105
incremental cost for S
CLIVAR
- Exchanges
V
olume 3 No. 2/3, July 1998
The Programmes: GODAE, CLIVAR and GOOS/ GCOS
The responsibility for the scientific and techni-cal development and oversight of implementation of ARGO will be shared by GODAE (Scientific Steering Team) and CLIVAR (Upper Ocean Panel). In concept at least, the thermal component of ARGO can in part be regarded as a response to the recommendations of GCOS/GOOS and will thus be part of the Initial Ob-serving System of the Ocean Climate ObOb-serving Sys-tem. The Ocean Observations Panel for Climate, who initiated GODAE, have responsibility for the over-sight of this system and, in particular, for the opera-tional parts of the ocean observing system (e.g., SOOP). In parallel with the development of ARGO, it has been proposed that a new Implementation Plan for
Subsurface observations (SOOP, TAO, etc.) be re-drafted which will take account, as far as possible, of emerging float capabilities. OOPC will take the lead for this activity.
Contacts
Author of this Prospectus, Convenor of Workshop and chair of the GODAE Scientific Steering Team: Neville Smith ([email protected])
Author of the original ARGO Proposal: Dean Roemmich ([email protected]) Author of GOSAMOR proposal:
Ray Schmitt ([email protected]) Chair of the CLIVAR Upper Ocean Panel: Ants Leetmaa ([email protected])