City, University of London Institutional Repository
Citation
:
Fassnidge, C., Cecconi-Marcotti, C. & Freeman, E. D. (2017). A deafening flash! Visual interference of auditory signal detection. Consciousness and Cognition, 49, pp. 15-24. doi: 10.1016/j.concog.2016.12.009This is the accepted version of the paper.
This version of the publication may differ from the final published
version.
Permanent repository link:
http://openaccess.city.ac.uk/16041/Link to published version
:
http://dx.doi.org/10.1016/j.concog.2016.12.009Copyright and reuse:
City Research Online aims to make research
outputs of City, University of London available to a wider audience.
Copyright and Moral Rights remain with the author(s) and/or copyright
holders. URLs from City Research Online may be freely distributed and
linked to.
A deafening flash!
Visual interference of auditory signal detection
Christopher Fassnidgea, Claudia Cecconi Marcottib, Elliot Freemana
a) Cognitive Neuroscience Research Unit, Department of Psychology, City University London, London, UK
b) King’s College London, UK
Corresponding author: Dr Elliot Freeman City University London Northampton Square London EC1V 0HB United Kingdom
Phone: +44 7739765561
Email: [email protected]
Keywords:
Highlights
• Some people claim to hear what they see: a visually-evoked auditory response (V-EAR);
• We assess the prevalence and perceptual reality of V-EAR for the first time;
• 22% of subjects confirmed they heard faint sounds accompanying silent visual flashes;
• V-EAR is perceptually real enough to interfere with detection of real sounds;
Abstract
In some people, visual stimulation evokes auditory sensations. How prevalent and how perceptually real is this? 22% responded 'Yes' when asked whether they heard faint sounds accompanying flash stimuli, and showed significantly better ability to discriminate visual ‘Morse-code’ sequences. This benefit might arise from an ability to recode visual signals as sounds, thus taking advantage of superior temporal acuity of audition. In support of this, those who showed better visual relative to auditory sequence discrimination also had poorer auditory detection in the presence of uninformative visual flashes, though this was independent of awareness of
visually-evoked sounds. Thus a visually-evoked auditory representation may occur subliminally and disrupt detection of real auditory signals. The frequent natural correlation between visual and auditory stimuli might explain the surprising prevalence of this phenomenon. Overall, our results suggest that learned
1. Introduction
In synaesthesia an inducing stimulus consistently and involuntarily evokes a consciously experienced concurrent sensation in a different sensory dimension or modality. Though there are many variants of synaesthesia, one feature they have in common is that they are rare: the most frequent types (e.g. grapheme and colour, or sound and shape) are found in only about 2-4% of the population (Simner et al., 2006; Ward, 2013). The low prevalence of cases is consistent with suggestions that synaesthesia represents an aberrant genotype (Brang, Williams, & Ramachandran, 2012; Tomson et al., 2011), which may result in unusual patterns of neural cross-wiring or cross-activation between adjacent cortical regions (Ramachandran & Hubbard, 2001; Rouw & Scholte, 2007). However, many researchers have argued that some forms of synaesthesia might be grounded on normal mechanisms involved in forming and reinforcing associations between different modalities and sensory dimensions (Brang, Williams, & Ramachandran, 2012; Cohen, 2013; Cohen Kadosh, Henik, Catena, Walsh, & Fuentes, 2009; Cytowic, 2003; Grossenbacher & Lovelace, 2001; Ramachandran & Hubbard, 2001; Ward, Huckstep, & Tsakanikos, 2006). On this latter view, the rarity of synaesthesia might be explained by the observation that the kinds of exotic associations that typify synaesthesia are very rarely found in nature. For example, grapheme-colour synaesthesia might be rare because consistent correspondences between letters and colours are themselves rare and thus do not typically reinforce strong associations, even though repeated exposure to consistent letter-colour pairings (found in fridge-magnets, educational materials, or experimental stimuli) might shape and reinforce grapheme-colour associations in individuals who are susceptible to them (Bor, Rothen, Schwartzman, Clayton, & Seth, 2014; Witthoft, Winawer, & Eagleman, 2015).
sensations in some individuals (Saenz & Koch, 2008). Saenz & Koch (2008) devised an elegant objective test of this phenomenon, where participants had to compare two paired 'Morse code' type sequences, presented both either as sounds or flashes. A small sample of participants self-identified as ‘hearing-motion’ synaesthetes showed relatively high performance for both auditory and visual stimuli, while control
participants found the task significantly harder in the visual modality. This superior visual performance in synaesthetes was explained on the assumption that they were benefiting from additional temporal information provided by recoding the visual stimulation into the auditory modality (Glenberg, Mann, Altman, Forman, & Procise, 1989; Guttman, Gilroy, & Blake, 2006). Apart from other rare reports of individuals who hear distinct musical sounds associated with visual colours (Baron-Cohen, Burt, Smith-Laittan, Harrison, & Bolton, 1996; Goller, Otten, & Ward, 2009) there has been no other published research on this visual-to-auditory direction of association to our knowledge. Two unresolved questions are raised, which we consider here: how prevalent is this phenomenon, and is it perceptually real?
Prevalence cannot be assessed from Saenz & Koch’s (2008) original study, as the few participants who were identified as synaesthetes were not randomly sampled but self-selected. Our first goal was therefore to make a tentative estimate of the
prevalence of visually-evoked auditory sensations in a random sample, using a combination of subjective questioning and objective tests based on Saenz & Koch’s (2008) paradigm. Our association frequency hypothesis predicts relatively high frequency of reports of visually-evoked sensations, in neurotypical individuals, along with task performance resembling that of Saenz & Koch’s synaesthetes.
2. Methods
2.1.Participants
A total of 40 naïve participants with normal hearing (by self-report) took part in the research and were paid for their participation. Two participants who did not have time to complete the debriefing questions were excluded from analysis, and a further participant was excluded because of chance performance in both auditory and visual sequence discrimination tasks. The final sample had 24 females, aged 19-36 (mean 24.24, standard deviation 4.68). One participant had an absolute auditory threshold of more than 3 standard deviations higher than the sample mean, but was included as performance on the main tasks was in the normal range and exclusion made no difference to the pattern of results. A subsample of 24 participants (18 female, mean age 23.8, SD 4.27) also performed an additional ‘Colavita’ test (see below). All participants had normal or corrected vision and reported normal hearing. All
procedures were carried out with informed consent and were approved by the local Psychology ethics committee.
2.2.Apparatus and stimuli
The experimental procedure was conducted using an Apple Mac Mini connected to a 17” Sony HMD-A420 cathode ray tube (CRT) display. Auditory stimuli were
presented through two Labtec PC speakers both positioned next to each other directly in front of and below the centre of the monitor. Video mode was 800x600 pixels with a 120 Hz refresh rate and viewing distance was approximately 57cm (controlled using a chin rest). A small white fixation point marked the centre of the display. Subject responses were collected using the arrow keys on a standard computer keyboard. Experimental procedures and stimuli were programmed using Psychtoolbox for Matlab.
Stimuli for each main task closely followed the methods described in the originating studies (Lovelace et al., 2003; Saenz & Koch, 2008). For the Sequence
sound pressure level, frequency 360Hz. ‘Short’ and ‘Long’ events were presented for periods of either 75ms or 300ms respectively, during which stimulation amplitude immediately decayed linearly from maximum to zero amplitude.
For the Auditory Detection task (Figure 1b), auditory stimuli were white noise bursts of 300ms duration with amplitude modulated by a Tukey window with 150ms rise and fall time. This was presented on a continuous white noise background of 45dBA sound pressure level. The visual stimulus was a grey-level radial grating, of maximum luminance 72cdm-2, diameter 4deg, and frequency of four cycles per revolution, with the grating phase incremented at two cycles per second giving the appearance of a rotating windmill. This animated stimulus was chosen with the aim of amplifying any auditory sensations induced by visual motion. Interval marker digits and response prompts were displayed in white 18pt Helvetica. In the visual
dominance task (Figure 1c), visual stimuli were circular white discs of luminance 48cdm-2 and diameter 4.5deg, presented centrally on a black background. Auditory stimuli were white noise bursts of 60dBA sound pressure level. All stimuli were presented for 50ms.
2.3.Design
In the sequence discrimination task the independent variable was the modality of the stimuli (either visual or auditory) and the dependent variable was same/different discrimination accuracy. In the auditory detection task the independent variable was also the modality of the stimuli (either auditory or audiovisual) and the dependent variable was auditory target detection accuracy. Results from each paradigm were coded as the proportion of correct detects or correct ‘different’ responses, versus false alarms or incorrect ‘different' matches, for the purpose of analysis based on signal detection theory (Green & Swets, 1966), which allows perceptual detection or discriminability of signals to be measured independently of any cognitive or
2.4.Procedure
In the Sequence Discrimination task, the procedure closely followed Saenz & Koch (2008). On each trial two successive rhythmic sequences of stimuli were presented. In half of the trials the events were all visual, and in the other half all auditory. The modality of each trial was randomized between trials. Within each sequence,
constituent stimuli (events) could be either short (75ms) or long (300ms) with a total of eight events per sequence. Sequences were randomly generated and consisted of a minimum of four and a maximum of five transitions (i.e. a short event followed by a long event, or a long event followed by a short). There was an inter-event interval of 100ms, and an interval of 500ms between the first and second sequence. On half of the trials, the two sequences were identical, and on the other half they differed. In ‘different’ trials, the first two events and the last event were always identical between pairs, while the order of the remaining events was randomly permuted. Immediately following the second sequence, participants were required to indicate whether they thought the two sequences were same or different by pressing either the left or right arrow key on a PC keyboard, respectively. No error feedback was given. The
response initiated the next trial. After the final trial in each block of 20 trials,
participants could take a break and the next block would begin when they pressed the spacebar. There was a total of 100 trials per session.
or right arrow keys respectively. Participants heard a single click if their response was correct, and two clicks if incorrect. On each trial, target intensity was chosen depending on responses to the previous trials, using the Quest algorithm (Watson & Pelli, 1983). Each block contained 40 trials, and there were 6 blocks in total. After each block the algorithm calculated the auditory thresholds, which were then
averaged to achieve a final threshold estimate. This was used to set the amplitude of the target for the main auditory detection task, which then remained fixed.
The main auditory detection task consisted of single-interval trials in which a target was either present or absent. Participants had to indicate whether the target was present or absent, using left or right arrow keys respectively, and received error feedback. The target timing and stimulus characteristics were the same as described before. Prior to each trial a central fixation dot was presented for 500ms, which then disappeared at the onset of the 500ms stimulation interval. The end of the stimulus interval was marked by the appearance of a response prompt, instructing
participants to press the left or right arrow to indicate whether they thought the target was present or absent, respectively. On half of the trials the interval contained no visual stimuli (auditory-only trial), while the other half contained a white rotating radial grating which was presented throughout the 500ms interval (audiovisual trials). Because it filled the entire stimulation interval, the visual stimulus provided no more temporally predictive information than the fixation offsets and onsets that already flanked the stimulation interval. Participants were told that the visual stimulus could be ignored because it provided no information. Auditory and audiovisual trials were blocked and the order of blocks was randomly permuted for each participant. Each block contained 40 trials and there were 6 blocks in total (three for each condition).
After participants had completed both tasks they were asked a short series of questions:
• What strategy were you using when you saw flashes in the visual sequencing experiment?
• Were you aware of using the flashes as if they were sounds, e.g. “flash, flash-flash” = “beep, beep-beep”
• In everyday life, are you ever aware of hearing sounds when you see flashing lights or movement, e.g. shop displays, car indicators, or people walking?
• Do you ever experience colours associated with letters, or with music, or tastes or smells associated with sounds?
• Have you ever been diagnosed as a synaesthete or do you suspect you might be one?
In a later session we administered the test of sensory dominance (Colavita, 1974) to 24 of our original participants who were still available. We presented participants with 10 blocks of 100 randomised trials, where 20% of trials were bimodal and the
3. Results
3.1.Subjective results
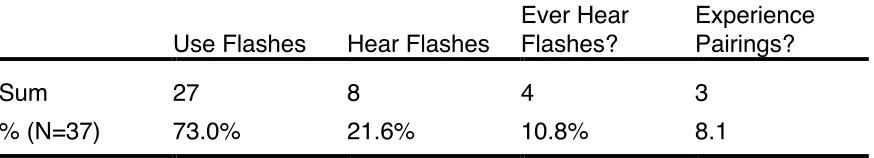
Subjective data were collected by asking a series of questions at the end of the experimental tasks. When initially asked to talk about strategies used in the sequence discrimination task, without prompting 22 out of 37 participants (59%) reported deliberately converting visual sequences to internal sounds (i.e. they ‘mentally replayed’ them as auditory sequences), while 17 (46%) said they tried counting and remembering the temporal positions of long vs. short flashes. Some reported attempting both strategies. When asked ‘In the sequence discrimination task were you aware of using the flashes as if they were sounds’, 27 answered ‘yes’ (73%, Table 1). When then asked ‘In the sequence discrimination task did you actually hear faint sounds when you saw flashes?’, eight participants answered ‘yes’ (22%). Responses were conservatively interpreted, so if participants were unsure about whether or not they heard any auditory sensation on seeing the flashes, this was coded as a negative response. We then asked whether they were ‘ever aware of hearing sounds when you see flashing lights or movement, e.g. shop displays, car
indicators, or people walking?’, to which four answered in the affirmative, though only one of these had answered ‘yes’ to the previous question. None said they had been previously diagnosed as synaesthetes, though three did report that they sometimes experienced pairings between different senses.
3.2.Objective group statistics
For between group comparisons we analysed sequence discrimination in a mixed ANOVA, with auditory/visual task and Yes/No-Hear groups as the two factors, after first confirming that there were no significant violations of homogeneity of variances [Levene’s F(1,35)=0.76, p=0.39]. As found in Saenz & Koch (2008), performance was significantly better in the auditory modality [Visual Mean d’ (SE): 1.74 (3.14); Auditory: 3.14 (1.22); F(1,35)=41.8, p<.00001], however performance overall was significantly better for participants who answered ‘Yes’ to the question [Yes-Hear Mean d' (SE): 3.02 (0.29); No-Hear: 2.27 (0.15); F(1,35)=5.17, p=.029] (Figure 2a). The interaction was not significant [F(1,35)=.90, ns]. Bonferroni-corrected
comparisons showed that only the visual task benefited significantly in participants confirming awareness of auditory sensations compared to those who did not [Visual: t(35)=2.43, p=0.02; Auditory t(35)=1.64, p=0.11] (see bar chart of means in Figure 2a). Because of possible concerns about unequal sample sizes, we performed an alternative bootstrapping analysis in which we compared performance in the eight ‘Yes’ participants with 1000 samples of eight participants randomly selected with replacement from the ‘No’ group. This showed a similar pattern, where only performance in the visual ‘Yes’ group condition was outside the 95% confidence interval of the bootstrapped ‘No’ distribution [visual z=2.79, p=0.005; auditory z=1.92, p=0.055]. Comparison of visual-minus-auditory performance across groups
(equivalent to the interaction term in the above ANOVA) was however still not significant using this method. An ANOVA analysis for the question of whether participants were ‘aware of using the flashes as if they were sounds’ showed no significant main effect of group [F(1,35)=.48, ns]. There was a significant interaction with task modality [F(1,35)=5.96, p=.02], where those who answered ‘Yes’ had higher auditory d’s than the others [Yes-Use Mean d’ (SE): 3.32 (0.23); No-Use: 2.63 (0.38)], however post-hoc comparisons showed no significant differences.
3.3.Correlation between tasks
According to Saenz and Koch (2008), their ‘hearing-motion’ synaesthetes differed less across modalities in their sequence discrimination ability compared to control subjects, as if they were using similar resources to perform the task in different modalities. We hypothesised that participants showing this pattern of behaviour would have lower auditory detection sensitivity in the presence of visual stimulation, compared to without. To assess this, we first subtracted the auditory d’ from the visual d’ for sequence discrimination (SEQd’V-A). Higher values (less negative)
indicate more similar performance for both modalities. Our second measure of the visual influence on auditory detection was computed by subtracting d’ in the auditory-only condition from d’ in the audiovisual condition (DETd’AV-A). Negative values would
be consistent with an effect of visual stimulation interfering with auditory detection. There was a significant negative correlation between scores on these two measures [Pearson’s r(35) = -0.43, p<0.0037]: the closer visual sequence discriminability was to auditory, the more visual stimulation impaired auditory detection, or the less it benefited (Figure 2d). This result is consistent with the notion that internal auditory noise evoked by the visual stimulus can actually interfere with an
externally-originating signal. We also found a significant positive correlation between DETd’AV-A
and auditory sequence discrimination [r(35)=0.40, p=0.01], but not visual sequence discrimination [r(35)=0.03, p=0.85; all three above analyses used
Bonferonni-adjusted alpha]. There was no significant correlation of sequence discrimination with the absolute threshold for auditory signal detection measured prior to the main task, that could account for individual differences in performance. Visual stimulation may thus interfere with auditory detection more in individuals whose auditory modality is less adept at sequence discrimination. A similar analysis using criterion scores instead of d’ for the detection task revealed no significant correlations with the sequence discrimination conditions.
The above negative correlation between d’ difference scores (Figure 2b) might arise if each task’s absolute d’ measurements were actually positively correlated, but each subject to ceiling versus floor effects respectively. However there was no significant positive correlation between absolute measures (averaged across visual and
3.4.Sensory Dominance Task
One explanation for the negative correlation above could be that people who are naturally biased to attend more to visual events can benefit when such events are relevant (resulting in better visual sequence discrimination) but are more distracted when they are irrelevant (resulting in poorer auditory detection in the context of visual stimulation). To assess this, we subsequently obtained a measure of visual dominance over audition following Colavita (1974) from 24 of our original
participants, including 6 who had answered ‘Yes’ to the question about hearing the flashes. This subsample had similar descriptive statistics and showed a very similar pattern of significant and non-significant results as reported above. We successfully replicated the ‘Colavita Effect’, finding that when participants were presented with an audiovisual stimulus, they tended on average to erroneously report seeing only a visual stimulus about twice as frequently than reporting only an auditory stimulus [Visual error rate: M=10.8%, SE=1.9; Auditory: Mean 5.1%, SE .11; t(23)=3.46, p =.002, Cohen's D = 0.75]. Such visual bias did not correlate significantly with our difference measures of detection or sequence discrimination [DETd’AV-A: r(22)=-0.34,
p=0.10; SEQd’V-A: r(22)=0.05, p=0.81]. In a multiple regression analysis, we further
confirmed that the critical relationship (i.e. shown in Figure 2d) between sequence discrimination and auditory signal detection (SEQd’V-A vs. DETd’AV-A) was still reliable
4. Discussion
The present combination of subjective and objective results provides the first estimate of the prevalence of visual-induced auditory sensations, and a test of the perceptual reality of such sensations. 22% of our normal participants reported hearing sounds accompanying visual flashes. These participants performed significantly better in a visual sequence discrimination task, supporting previous suggestions that the ability to recode visual events as sounds may influence visual discrimination of rhythmic sequences (Guttman et al., 2006; Saenz & Koch, 2008). Furthermore, our study is the first to suggest that such auditory-recoding of visual events not only indirectly affects visual performance but directly affect auditory signal detection. This kind of visually-evoked auditory response (V-EAR) is thus apparently not only quite common but it can impact on detection of real sounds.
In Saenz & Koch’s (2008) study, ‘hearing-motion’ synaesthetes who reported routinely hearing visually-evoked sounds were almost as good at discriminating visual flash sequences as they were discriminating auditory tone sequences, while in non-synaesthetes sequence discrimination was significantly poorer for flashes than for tones. It was inferred from this that the synaesthetes were uniquely able to recode the flashes as sounds and thus benefit from the better auditory temporal acuity of the auditory modality (Glenberg et al., 1989; Guttman et al., 2006). However, this ability to recode flashes into the auditory modality might not be restricted to synaesthetes. Testing normal participants, Guttman et al (2006) found that visual sequence discrimination was disrupted more by irrelevant auditory
accompanied by irrelevant visual flashes. This association was found despite the difference between task and stimuli, which were chosen to closely replicate the methods of the originating studies.
The influence of the visual modality on audition is presumably involuntary rather than a result of a deliberate strategy, as it did not benefit detection performance. It might occur due to masking of the auditory signal by increased internal noise, though this does not easily explain why auditory detection benefited from visual stimulation in some participants. Alternatively poorer sensitivity might reflect an attempt in some participants to actively discount internally-originating sensations from externally-originating signals (Sinke et al., 2014), while others integrate or ignore them;
conversely it has been proposed that people with poorer audiovisual integration may develop compensatory synaesthetic tendencies (Sinke et al., 2014). Interestingly, we found that greater visual interference in the auditory detection task was significantly associated with poorer auditory sequence discrimination. This supports the idea that an ability to recode visual information as sounds might compensate for a poorer ability to discriminate pure auditory sequences. This interpretation has some neurophysiological support from evidence of increased visual evoked potentials in temporal auditory areas in hearing-impaired subjects (Campbell & Sharma, 2014).
In addition to the association with objective auditory detection performance, our subjective data supports the assumption that performance on the sequence discrimination task reflects an ability to recode flashes as sounds. On debriefing, 22% of participants answered ‘Yes’ to the surprise question of whether they had been aware of faint sounds accompanying the flashes in the sequence discrimination task. In agreement with Saenz & Koch (2008), these ‘Yes-Hear’ participants
performed significantly better on the visual sequence discrimination tasks compared to those who did not report such sounds. Given that our participants reported no established history of synaesthesia, the proportion of ‘Yes-Hear’ participants is surprisingly high. This proportion might have been inflated if participants had
‘No-Hear’ responders, while the many more participants who admitted using a strategy of actively imagining the flashes as sounds did not perform significantly differently to others on the visual measure. This suggests that the phenomenon of interest is not merely based on imagery, but on auditory sensations.
Though the subjective data predict some aspects of objective performance, the objective signs of visually-evoked auditory sensations could also occur
independently of awareness. For example, some ‘No-Hear’ participants showed high visual sequence discriminability; furthermore, the effect of flashes on auditory
detection was also not dependent on reporting awareness of hearing flashes. Two methodological differences from the original study might account for the
predominance of such patterns here. Firstly, we sampled randomly while the original study presumably contrasted self-selected participants who did versus did not report synaesthesia for hearing visual events. It is therefore possible that Saenz & Koch’s control group might have underrepresented any normally-occurring tendencies to hear flashes. Conversely, our variant of their paradigm, with slightly longer events and shorter retention delays between the two comparison intervals, may have been more sensitive to latent tendencies found in normal participants. A similar
dissociation between subjective and objective measures has been found in studies that have attempted to induce synaesthesia-like associations by training and have found robust objective effects on information processing but weak evidence of subjective concurrents (reviewed in Deroy & Spence, 2013). In the present case, reporting a subjective experience may depend on first explicitly noticing the auditory sensations, which might be easily ignored due to the highly predictable natural association of auditory and visual events (see below).
detection. However, our measure of the Colavita effect (Colavita, 1974; Koppen et al., 2009) helps to discount this possibility. Though we successfully replicated the Colavita effect, this did not predict performance in either task, thus there is no
evidence that the present results can be accounted for by general differences in bias towards the visual modality.
The above indications of prevalence are consistent with our original hypothesis that some forms of synaesthesia might occur more frequently if the inducing and
concurrent sensations are more frequently associated in nature. This might be expected on the basis of evidence that some synaesthetic associations can be reinforced by exposure to consistent sensory pairings (Bor et al., 2014; Witthoft et al., 2015). While artificial correspondences such as consistent grapheme/colour associations are extremely rare in nature, visual and auditory events are highly predictive of each other in nature: whenever we see two objects colliding, or a person’s lips moving to speak, this is usually accompanied by a sudden onset of sound. Consequently, if an individual has any predisposition towards synaesthetic perceptions, they should be more likely to have formed audiovisual associations than other less frequently occurring kinds.
The very predictability of visual-to-auditory correspondences might also
counterintuitively explain why there have been so few reports of visually-evoked auditory concurrents (Baron-Cohen et al., 1996; Goller et al., 2009; Saenz & Koch, 2008). When a faint auditory sensation accompanies a visual event we might easily ignore it because it would not seem surprising or unusual. We might even assume it was real, and think we are actually hearing the footfalls of somebody walking ahead of us. In contrast, experiencing a visually-evoked taste instead would be more
become aware of latent synaesthesias in adulthood through introspective attention (Tyler, 2005). In tentative support of this, some of our lab assistants and author (CF) informally reported that they started to hear flash-evoked sounds after repeated exposure to the visual sequence discrimination paradigm.
In terms of brain mechanisms, it is currently debated to what extent synaesthesias reflect genotypically unusual cross-wiring between sensory areas (Brang et al., 2012; Tomson et al., 2011), versus physiological disinhibition of normally-occurring
connections (Cohen Kadosh et al., 2009; Cohen Kadosh & Walsh, 2006; Grossenbacher & Lovelace, 2001; Neufeld et al., 2012). This debate might be informed by whether the behavioural measures have a discontinuous or continuous distribution (Cohen Kadosh, 2013; Deroy & Spence, 2015; Martino & Marks, 2001; Simner, 2012). Although we did not test participants with a history of synaesthesia, we can distinguish a subgroup that reports visually-evoked sounds; however such subjective awareness seems to be the only dichotomous variable, for even though on average ‘Yes-Hear’ participants were significantly better at visual discrimination, the distribution of our objective measures appears smooth rather than discontinuous. This apparent behavioural continuity seems more likely to reflect normal
mechanisms linking auditory and visual neural representations, either directly or via subcortical or multimodal areas (Ward et al., 2006), rather than unusual patterns of neural cross-wiring present only in a few individuals. Indeed, neurons responding to visual stimulation have been found in auditory cortex which may receive stimulation from higher areas or from subcortical regions via interconnections found in normal anatomy (Ghazanfar & Schroeder, 2006; Schroeder & Foxe, 2005). Such
This study has provided the first evidence that a surprisingly high proportion of randomly-sampled neurotypical individuals can sometimes report auditory
sensations evoked by visual flashes. These internal sounds seem to be perceptually real enough to interfere with the detection of externally-generated sounds, as well as benefiting visual sequence discrimination, even if they not always subjectively
5. References
Baron-Cohen, S., Burt, L., Smith-Laittan, F., Harrison, J., & Bolton, P. (1996). Synaesthesia: Prevalence and familiality. Perception, 25(9), 1073–1079. http://doi.org/10.1068/p251073
Bor, D., Rothen, N., Schwartzman, D. J., Clayton, S., & Seth, A. K. (2014). Adults can be trained to acquire synesthetic experiences. Scientific Reports, 4, 7089. http://doi.org/10.1038/srep07089
Brang, D., Williams, L. E., & Ramachandran, V. S. (2012). Grapheme-color synesthetes show enhanced crossmodal processing between auditory and visual modalities. Cortex; a Journal Devoted to the Study of the Nervous System and Behavior, 48(5), 630–7. http://doi.org/10.1016/j.cortex.2011.06.008
Campbell, J., & Sharma, A. (2014). Cross-modal re-organization in adults with early stage hearing loss. PloS One, 9(2), e90594.
http://doi.org/10.1371/journal.pone.0090594
Cohen, J. (2013). Synesthetic perception as continuous with ordinary perception, or: We’re all synesthetes now. In Sensory blending: New essays on synaesthesia
(pp. 1–32). inproceedings, Oxford University Press.
Cohen Kadosh, R. (2013). Using transcranial electrical stimulation to enhance cognitive functions in the typical and atypical brain. Translational Neuroscience,
4(1), 20–33. http://doi.org/10.2478/s13380-013-0104-7
Cohen Kadosh, R., Henik, A., Catena, A., Walsh, V., & Fuentes, L. J. (2009). Induced cross-modal synaesthetic experience without abnormal neuronal connections. Psychological Science, 20(2), 258–65.
http://doi.org/10.1111/j.1467-9280.2009.02286.x
Cohen Kadosh, R., & Walsh, V. (2006). Cognitive Neuroscience: Rewired or Crosswired Brains? Current Biology, 16(22), R962-3.
Colavita, F. B. (1974). Human Sensory Dominance. Perception & Psychophysics,
16(2), 409–412. http://doi.org/10.3758/BF03203962
Cytowic, R. E. (2003). The man who tasted shapes. book, Imprint Academic.
Deroy, O., & Spence, C. (2013). Training, hypnosis, and drugs: artificial
synaesthesia, or artificial paradises? Frontiers in Psychology, 4(October), 1–15. http://doi.org/10.3389/fpsyg.2013.00660
Deroy, O., & Spence, C. (2015). Lessons of synaesthesia for consciousness: Learning from the exception, rather than the general. Neuropsychologia, 1–9. http://doi.org/10.1016/j.neuropsychologia.2015.08.005
Ghazanfar, A. A., & Schroeder, C. E. (2006). Is neocortex essentially multisensory?
Trends in Cognitive Sciences, 10(6), 278–285. http://doi.org/10.1016/j.tics.2006.04.008
Glenberg, A. M., Mann, S., Altman, L., Forman, T., & Procise, S. (1989). Modality effects in the coding and reproduction of rhythms. Memory & Cognition, 17(4), 373–383. http://doi.org/10.3758/BF03202611
Goller, A. I., Otten, L. J., & Ward, J. (2009). Seeing sounds and hearing colors: an event-related potential study of auditory-visual synesthesia. Journal of Cognitive Neuroscience, 21(10), 1869–81. http://doi.org/10.1162/jocn.2009.21134
Green, D. M., & Swets, J. A. (1966). Signal Detection Theory and Psychophysics.
New York: Wiley.
Grossenbacher, P. G., & Lovelace, C. T. (2001). Mechanisms of synesthesia: cognitive and physiological constraints. Trends in Cognitive Sciences, 5(1), 36– 41. http://doi.org/10.1016/S1364-6613(00)01571-0
Guttman, S. E., Gilroy, L. A., & Blake, R. (2006). Hearing what the eyes see.
Psychological Science, 16(3), 228–235. article. http://doi.org/10.1111/j.0956-7976.2005.00808.x.Hearing
Colavita visual dominance effect. Experimental Brain Research, 196(3), 353–60. http://doi.org/10.1007/s00221-009-1853-y
Lovelace, C. T., Stein, B. E., & Wallace, M. T. (2003). An irrelevant light enhances auditory detection in humans: a psychophysical analysis of multisensory integration in stimulus detection. Cognitive Brain Research, 17(2), 447–453. Retrieved from
http://www.sciencedirect.com/science/article/pii/S0926641003001605
Martino, G., & Marks, L. E. (2001). Synesthesia: Strong and Weak. Current
Directions in Psychological Science, 10(2), 61–65. http://doi.org/10.1111/1467-8721.00116
Neufeld, J., Sinke, C., Zedler, M., Dillo, W., Emrich, H. M., Bleich, S., & Szycik, G. R. (2012). Disinhibited feedback as a cause of synesthesia: evidence from a
functional connectivity study on auditory-visual synesthetes. Neuropsychologia,
50(7), 1471–7. http://doi.org/10.1016/j.neuropsychologia.2012.02.032
Ramachandran, S., & Hubbard, E. M. (2001). Perception, thought and language.
Journal of Consciousness Studies, 8(12), 3–34.
Rouw, R., & Scholte, H. S. (2007). Increased structural connectivity in grapheme-color synesthesia. Nature Neuroscience, 10(6), 792–797.
http://doi.org/10.1038/nn1906
Saenz, M., & Koch, C. (2008). The sound of change: visually-induced auditory synesthesia. Current Biology, 18(15), 650–651. Retrieved from
http://www.sciencedirect.com/science/article/pii/S0960982208007343
Schroeder, C. E., & Foxe, J. (2005). Multisensory contributions to low-level, “unisensory” processing. Current Opinion in Neurobiology, 15(4), 454–8. http://doi.org/10.1016/j.conb.2005.06.008
Simner, J., Mulvenna, C., Sagiv, N., Tsakanikos, E., Witherby, S. A., Fraser, C., … Ward, J. (2006). Synaesthesia: the prevalence of atypical cross-modal
experiences. Perception, 35(8), 1024–1033.
Sinke, C., Neufeld, J., Zedler, M., Emrich, H. M., Bleich, S., Münte, T. F., & Szycik, G. R. (2014). Reduced audiovisual integration in synesthesia--evidence from bimodal speech perception. Journal of Neuropsychology, 8(1), 94–106. http://doi.org/10.1111/jnp.12006
Stevenson, R. J., & Tomiczek, C. (2007). Olfactory-induced synesthesias: a review and model. Psychological Bulletin, 133(2), 294–309.
http://doi.org/10.1037/0033-2909.133.2.294
Tomson, S. N., Avidan, N., Lee, K., Sarma, A. K., Tushe, R., Milewicz, D. M., … Eagleman, D. M. (2011). The genetics of colored sequence synesthesia: suggestive evidence of linkage to 16q and genetic heterogeneity for the condition. Behav Brain Res, 223(1), 48–52. article.
http://doi.org/10.1016/j.bbr.2011.03.071
Tyler, C. W. (2005). Varieties of synesthetic experience. Synesthesia: Perspectives from Cognitive Neuroscience, 34–44. article.
van Campen, C. (2008). The Hidden Sense : Synesthesia in art and science. Cambridge, Mass.: MIT Press.
Ward, J. (2013). Synesthesia. Annual Review of Psychology, 64, 49–75. http://doi.org/10.1146/annurev-psych-113011-143840
Ward, J., Huckstep, B., & Tsakanikos, E. (2006). Sound-colour synaesthesia: To what extent does it use cross-modal mechanisms common to us all? Cortex,
42(2), 264–280. http://doi.org/10.1016/S0010-9452(08)70352-6
Watson, A. B., & Pelli, D. G. (1983). QUEST: A Bayesian adaptive psychometric method. Perception & Psychophysics, 33(2), 113–120. article.
Grapheme-Color Pairings in a Large Online Sample of Synesthetes. PLoS One,
Table 1
Results for debrief questionnaire
Use Flashes Hear Flashes
Ever Hear Flashes?
Experience Pairings?
Sum 27 8 4 3
Figure legends
Figure 1
Illustrative stimuli and display sequences for (a) sequence discrimination task, showing part of a typical trial presented either in the visual or auditory modality; sample ‘Morse code’ sequences are shown below for typical ‘same’ versus ‘different’ trials; (b) auditory signal detection task: two audiovisual trials are illustrated with the auditory target present then absent, then an auditory-only trial; (c) sensory
dominance (Colavita) task: unimodal auditory, bimodal, and unimodal visual trials are illustrated.
Figure 2
Experimental results. (a) mean d’ sensitivity for discriminating sequences of visual (V) and auditory (A) sequences, grouped by responses to the question ‘Did you hear faint sounds when you saw flashes?’ (Yes: Yellow; No: Blue). Brackets indicate statistically significant differences [p<.05, see Results]; (b) Sequence discriminability d’ for individual participants; same colour scheme as above. (c) d’ for auditory signal detection, in the context of an irrelevant visual stimulus (AV) or alone (A); (d)
75ms 100ms 300ms
a
Sequence discrimination
Interval 1 Interval 2 Interval 1 Interval 2
Same
Diff
+
+
+
+
500ms
150ms 350ms 500ms
Y N Y
b
Auditory detection
Y < > N Y < > N Y < > N
+
+
+
50ms 1300-1700ms A
A V V
c
Sensory dominance
-1 -0.5 0 0.5 1 1.5
Aud. det. d' AV-A Visual benefit
!
d
r(37) = -0.42, p< 0.0075
0 0.5 1 1.5 2 2.5 3 d' Auditory detection
c
V A 0 1 2 3 4 5 d' Sequence discriminationb
V A 0 1 2 3 4 5Seq. discr. d'
Heard faint sounds?