R E S E A R C H A R T I C L E
Open Access
Influenza: a scientometric and density-equalizing
analysis
Ralph Fricke, Stefanie Uibel, Doris Klingelhoefer
*and David A Groneberg
Abstract
Background:Novel influenza in 2009 caused by H1N1, as well as the seasonal influenza, still are a challenge for the public health sectors worldwide. An increasing number of publications referring to this infectious disease make it difficult to distinguish relevant research output. The current study used scientometric indices for a detailed investigation on influenza related research activity and the method of density equalizing mapping to make the differences of the overall research worldwide obvious. The aim of the study was to compare scientific effort over the time as well as geographical distribution including the cooperation on national and international level.
Methods:Therefore, publication data was retrieved fromWeb of Science(WoS) of Thomson Scientific. Subsequently the data was analysed in order to show geographical distributions and the development of the research output over the time.
The query retrieved 51,418 publications that are listed in WoS for the time interval from 1900 to 2009. There is a continuous increase in research output and general citation activity especially since 1990.
Results:The identified all in all 51,418 publications were published by researchers from 151 different countries. Scientists from the USA participate in more than 37 percent of all publications, followed by researchers from the UK and Germany with more than five percent. In addition, the USA is in the focus of international cooperation.
In terms of number of publications on influenza, theJournal of Virologyranks first, followed byVaccineandVirology. The highest impact factor (IF 2009) in this selection can be established forThe Lancet(30.75).Robert Websterseems to be the most prolific author contributing the most publications in the field of influenza.
Conclusions:This study reveals an increasing and wide research interest in influenza. Nevertheless, citation based-declaration of scientific quality should be considered critically due to distortion by self-citation and co-authorship.
Background
Zoonotic emergence of human infectious diseases leads to a global risk to public health. The Spanish flu in 1918/19, most probably originated in birds, caused approx. 50 million deaths worldwide [1]. The experience of H5N1, with a case fatality rate of at least 50 percent in 2003, the outbreak of the“novel influenza”(H1N1) in 2009 caused concerns of a global spread of this pan-demic with millions of deaths estimated. Fortunately, the H1N1 pandemic was less severe compared to earlier pandemics. Nevertheless, seasonal influenza is still a challenge to local public health sectors all over the world [2,3]. In recent years, enormous efforts have been
made to improve diagnostic and therapeutic methods. However, problems in prevention and control of influ-enza persisted due to rising urbanization and mobility [4,5]. The global threat of an influenza pandemic is also a challenge for international and interdisciplinary co-operation. Since the first available publications at the end of the 19thcentury, the amount of publication dea-ling with influenza is substantially and continuously in-creasing. The vast amount of publications referring to influenza and the difficulties in handling disease once it emerged, illustrates the need of a sound evaluation of the scientific output. Therefore, the present study in-vestigates research accomplishments and their distribution using scientometrics and density equalizing mapping in combination.
* Correspondence:[email protected]
Institute of Occupational Medicine, Social Medicine and Environmental Medicine, Goethe-University, Frankfurt, Germany
Methods
Data sources
Data was retrieved from the database Web of Science (WoS) by Thomson Scientific and, for further specific analyses, in the Medline database (PubMed) by the U.S. National Library of Medicine. Additional data was inter-rogated from OECD Statistics (Gross domestic product (GDP), spending for research and development (R&D), number of researchers as full-time equivalent per thousand people employed) [6].
Search strategy
“Influenza”,“Flu”and“Grippe”was entered in the search field and combined with the Boolean operator “OR” to retrieve the overall number of items. Further investigations used the “Analyze Results” function and the “Citation Report”provided by the WoS database.
Timeframe
The timeframe covers the years from 1900 to 2009. Re-sults from 2010 to 2012 were not considered due to incomplete data acquisition at the time of data query.
Data analysis
Items retrieved from the data query in WoS were ana-lysed by publication date, country of origin, source title, author and institution. Findings were transferred to Excel charts and pictured in diagrams. Furthermore, all published items were analysed with the function “ cita-tion report”. For all publications referring to influenza, the total number of citations and the average citation per item (citation rate) were calculated. In this regard, the number of publications can be seen as an indicator of quantity of the research productivity. Citation analysis is used as an indicator for the impact of publications for the scientific community, and, in consideration of me-thodical limitations, for research quality. Country related data were presented by using density equalizing mapping procedures based on Gastner’s and Newman’s algorithm [7]. These were used as described in previous studies [8]. Using this approach, the size of territories (e.g. countries) was aligned in correspondence to the pecu-liarity of selected variables (e.g. the number of publica-tions, the number of citations and the average citation per country). The resulting maps are thus distorted de-pending on the chosen parameter. Finally, cooperation between countries and institutions was investigated. A journal contribution published by at least two authors coming from different countries or institutions is de-fined as cooperation. Using a specially developed soft-ware module, the values for the cooperation of each pair of countries were visualized as vectors. The thickness and colour of a vector elucidates the number of inter-national and institutional cooperation, respectively [9].
To ensure legibility, a minimum threshold of ten co-operative activities was defined.
Results
Amount of published items and citation behaviour The query in the WoS database results in 51,418 publi-cations with a reference to influenza. In the research timeframe, a continuous and accelerating increase of publications in this subject area can be determined, es-pecially in the last decade. A first remarkable increase in influenza related research output in WoS can be no-ticed in 1918 to 1921. Almost half of all publications (48.7 percent) were published in the last ten years of the examined period (2000–2009). The most citations were found in 1998. A citation rate (CR) of more than 30 can be shown in 1942 and 1944 as well as 1991 to 2000.
Analysis of research origin and cooperation
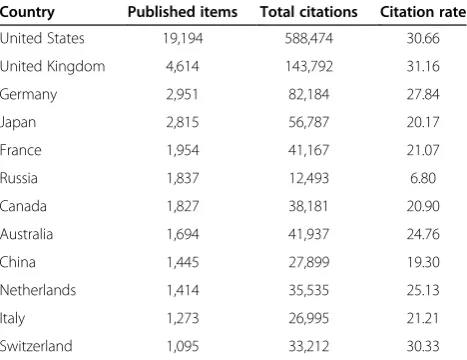
[image:2.595.305.539.552.732.2]The 51,418 articles were published by 151 different countries. Researchers from the United States of America (USA) participated in more than 37 percent of all publica-tions referring to influenza (19,194) followed by scientists from the United Kingdom (UK) (4,614), Germany (2,951) and Japan (2,815). Furthermore, there are eight countries with more than 1,000 published items (Table 1). Accor-dingly, these countries dominate the cartogram, illustra-ting the research output by territory (Figure 1A). In contrast, major parts of South America, Africa and Asia are minimized. As expected, the publications from the USA receive most citations of all (588,474), followed by the publications from the UK, Germany and Japan. While Vietnam and Indonesia only published 98 and 59 articles respectively, they appear in a leading position when con-sidering the average citation rate per country (Vietnam 49, Indonesia 35) (Figure 1B). Those articles, focusing on HPAI/H5N1, were mainly published between 2004 and
Table 1 Publications, citations and citation rates sorted by countries
Country Published items Total citations Citation rate
United States 19,194 588,474 30.66
United Kingdom 4,614 143,792 31.16
Germany 2,951 82,184 27.84
Japan 2,815 56,787 20.17
France 1,954 41,167 21.07
Russia 1,837 12,493 6.80
Canada 1,827 38,181 20.90
Australia 1,694 41,937 24.76
China 1,445 27,899 19.30
Netherlands 1,414 35,535 25.13
Italy 1,273 26,995 21.21
Switzerland 1,095 33,212 30.33
Frickeet al. BMC Infectious Diseases2013,13:454 Page 2 of 7
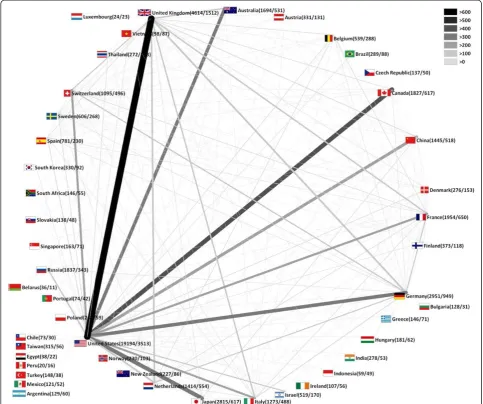
2009. Looking at the analysis of cooperation, most efforts are located in the USA with the most productive coope-ration between the USA and the UK (646), the USA and Canada (421), the USA and Japan (385), the USA and Germany (350) and between the USA and Australia (324) (Figure 2).
Institutional analysis and cooperation
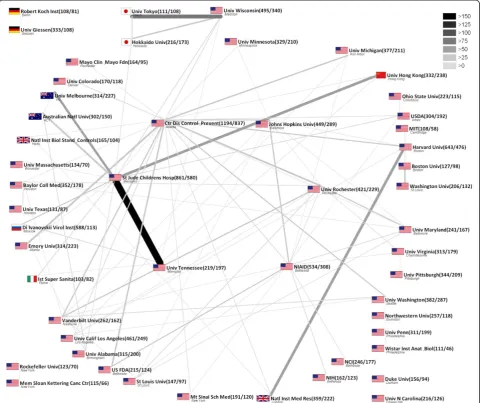
A total number of 24,709 institutions participated in publications dealing with influenza in the given research timeframe. The majority of institutions originate from the USA (5,218) analogous to the USA being also the most productive country. UK (1,959), Japan (1,919), France (1,918) and Germany (1,848) also provide a high frequency of scientific institutions. Overall, the Centers for Disease Control and Prevention (CDC) ranks first (1,194) followed by theSt. Jude Children’s Hospital(861) andHarvard University(643). The centre of institutional
cooperation is the USA as most of cooperating insti-tutions originate there. The most intense cooperation takes place between theUniversity of Tennessee and the St. Jude Children’s Hospital with 165 articles published in cooperation. Leading international cooperation exists between theUniversity of WisconsinandTokyo University (97 common articles) (Figure 3).
Research infrastructure in selected countries
[image:3.595.56.539.89.460.2]Research infrastructure plays an important role in con-trolling infectious diseases. Identification and spread of Influenza virus and development of suitable vaccine are examples for the need of sufficient research networking. In this study we choose the USA and the European Union as comparable economic areas on the one hand. On the other hand China and Russia were also included in the analysis.
The USA spends 2.64 percent of its Gross Domestic Product (GDP) for research and development (R&D), followed by the European Union (EU-27) with 1.75 per-cent, China (1.19 percent) and Russia (1.13 percent). Considering the GDP itself, the USA spends the most funds for R&D by far. Looking at the number of re-searchers (per thousand employees), the USA ranks first as well followed by the EU. Russia ranks last with eco-nomic efforts for R&D and annual number of published items (Table 2). Looking at the data in more detail, an increasing expenditure on R&D for the USA, the EU-27 and in particular China can be shown. China has almost tripled its GDP during 2000–2008 and additionally the expenditure on R&D rises from 0.9 to 1.4 percent of GDP. In contrast, for Russia, decreasing spending for R&D can be shown for the last four years.
Journal analysis
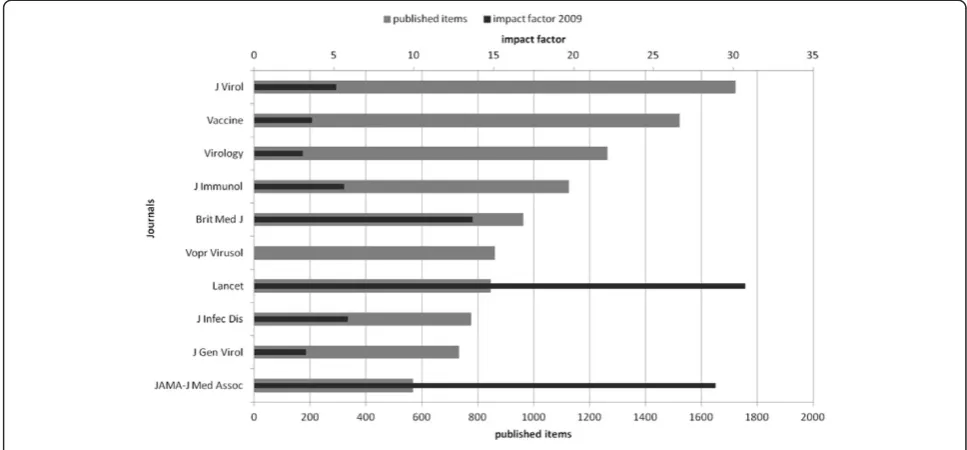
The most productive journal is the Journal of Virology with 1,722 influenza related articles in the above men-tioned timeframe. The journal’s impact factor for 2009 is 5.15. Vaccine (impact factor 3.61,) Virology (impact fac-tor 3.04) and the Journal of Immunology (impact factor 5.64) contribute more than 1,000 influenza related arti-cles. Looking at the ten journals with the highest output on influenza related articles The Lancet has the highest impact factor (IF 30.75) (Figure 4). The most productive veterinary journal isAvian Diseasecontributing 390 arti-cles (impact factor 2.00).
Discussion
[image:4.595.56.540.90.494.2]In regard to the pandemics of the last century, the in-fluenza has a strong historical relevance in medicine. Figure 2Country network analysis.Threshold excludes cooperation with less than 10 items, numbers in brackets: number of publications/ cooperation articles, width and colour of beams: frequency of cooperation.
Frickeet al. BMC Infectious Diseases2013,13:454 Page 4 of 7
The seasonal appearances every year as well as the ap-pearance of H5N1 and H1N1 in the last ten years shows the challenges this infectious disease brings to the world community. Although the indisposition is known and the virus with its characteristics is identified since long,
there are many open questions within the scientific com-munity. Especially events like H5N1 and H1N1 out-breaks illustrate the need of further investigation in this field.
The objective of this study was to analyse the influenza research output quantitatively and qualitatively by using bibliometric tools and density equalizing procedures.
[image:5.595.58.542.90.493.2]WoS was selected for all queries due to the availability of complete bibliographic data. To minimize the data-base bias while looking at research output in the field of influenza over the time. Major events in influenza outbreak like the Spanish flu in 1918/1919 seem to have an impact on influenza related scientific output. Besides, there are also other mechanisms to be con-sidered when judging the overall increasing publica-tion amount. Since the beginning of the 1990ies, the Figure 3Institution network analysis.Threshold > 100 publications, > 10 cooperation, numbers in brackets: number of publications/cooperation articles, width and colour of beams: frequency of cooperation.
Table 2 GDP (in Bill. $-Dollar), R&D in percent of GDP, Researcher (full-time equivalent per thousand people employed) and published items; average 2000-2008
GDP R&D Researchers Published items
2000–2008 2000–2008 2000–2008 2000–2008
USA 11991.17 2.64 9.69 1000.11
EU-27 12808.28 1.75 5.89 752.44
China 5043.44 1.19 1.30 104.67
[image:5.595.57.290.651.733.2]digitalised communication like the World Wide Web is increasingly gaining importance. Public access to databases and digital networks build the basis for an easier information exchange and an improved coope-ration between scientists. As a consequence, we find a much faster and increasing publication activity. Also, since 1991, the WoS database searches also the abstracts and the keywords of the publications. Thus, successful search strategies are much more likely and therefore the number of retrieved publications increasing. Examining the citation behaviour gives insights into the resonance of an article within the scientific community and thus can serve as an indicator for the qualitative ap-preciation of this particular work. Also here, analogous to the publication rate, the most citations can be found in
the last 20 years. However, also during the 1930ies and 1940ies, above average citation rates can be shown. Du-ring this time, the influenza virus was discovered and the virology developed. Until the 1960ies, the influenza virus was kind of a prototype of a virus and was subject of intense fundamental research on the area of virology (Figure 5) [10].
[image:6.595.55.539.90.315.2]Looking at the geographical distribution of the publi-cation efforts, the USA takes a predominant role. With the highest agglomeration of research institutions, the USA offers an infrastructure, that does not only lead to the highest publication rate, but also to the most numer-ous and intense cooperation on national and international level. Several publications suggest the dominance of the USA within the scientific community [11-13]. Analogous Figure 4Journal analysis.Raking of most productive journals and impact factor 2009.
Figure 5Proportion of the five most prolific subject areas in specific nine year time intervals.
Frickeet al. BMC Infectious Diseases2013,13:454 Page 6 of 7
[image:6.595.57.538.537.711.2]to the amount of papers published, the US-American publications were also cited most often. However, when looking at the average citations per publication, other countries seem to dominate. Vietnam and Indonesia, for example, deliver the highest citation rate per publication. Content-wise, 80 percent of these articles deal with H5N1. Both countries have been particularly affected by the outbreak of this disease. In the years 2004 and 2005, 290 people of the 520 deaths worldwide, died in one of these two countries. Here, the case fatality rate was above 50 percent [14]. The research from these countries seems to have had a special influence on the scientific community. The examination of the citation rate (CR) cannot lead to a distinct scientific evaluation of the publication effort of a country or an author. The smaller the amount of publications used for the calculation, the larger is the impact of a few articles that have been cited often. Thus, in this research, we used a threshold of 30 publications for the calculation of the CR in order to get valid out-puts. Further, inaccurate citations and self-citations also distort parameters like the CR or the impact factor that are used to measure the quality of the scientific work.
Conclusion
The current study represents a first detailed sciento-metric analysis and visualization of scientific output in the field of influenza. Established scientometric tools and the method of density equalizing mapping were used. The majority of scientific output originates from the USA. The UK, Germany and Japan follow with con-siderable distance. The highest CR is found for Vietnam and Indonesia. Considering the quantitative scientific output and citation analysis, an increasing interest in the field of influenza must be recognized. However, scien-tometric tools e.g. citation rate, impact factor and h-index must also be seen critically due to distortion by self-citation and co-authorship. Further investigations are needed to improve the assessment of the scientific productivity.
Abbreviations
CR:Citation rate; GDP: Gross domestic product; IF: Impact factor; OECD: Organization for economic co-operation and development; R&D: Research and development; WoS: Web of science.
Competing interests
The authors declare that they have no competing interests.
Authors’contributions
RF, SU, DK, DAG have made substantial contributions to the conception and design of the review, acquisition of the review data and have been involved in drafting and revising the manuscript. All authors have read and approved the final manuscript.
Acknowledgement
We thank C. Scutaru for expert technical help.
Received: 5 November 2012 Accepted: 26 September 2013 Published: 30 September 2013
References
1. Johnson NP, Mueller J:Updating the accounts: global mortality of the 1918–1920“Spanish”influenza pandemic.Bull Hist Med2002, 76(1):105–115.
2. Monto AS:The risk of seasonal and pandemic influenza: prospects for control.Clin Infect Dis2009,48(Suppl 1):S20–25.
3. Carrillo-Santisteve P, Ciancio BC, Nicoll A, Lopalco PL:The importance of influenza prevention for public health.Hum Vaccin Immunother2012, 8(1):89–95.
4. Moore M, Gould P, Keary BS:Global urbanization and impact on health. Int J Hyg Environ Health2003,206(4–5):269–278.
5. Colizza V, Barrat A, Barthelemy M, Valleron AJ, Vespignani A:Modeling the worldwide spread of pandemic influenza: baseline case and containment interventions.PLoS Med2007,4(1):e13.
6. OECD, Stat. Office of the EU:OECD Statistics on International Trade in Services, Volume I - Detailed Tables by Service Category, 2002-2008. OECD Publishing; 2010.
7. Gastner MT, Newman ME:From the cover: diffusion-based method for producing density-equalizing maps.Proc Natl Acad Sci USA2004, 101(20):7499–7504.
8. Groneberg-Kloft B, Scutaru C, Kreiter C, Kolzow S, Fischer A, Quarcoo D: Institutional operating figures in basic and applied sciences: scientometric analysis of quantitative output benchmarking.Health Res Policy Syst2008,6:6.
9. Scutaru C, Quarcoo D, Sakr M, Shami A, Al-Mutawakel K, Vitzthum K, Fischer TC, Zuberbier T, Groneberg-Kloft B:Density-equalizing mapping and scientometric benchmarking of European allergy research.J Occup Med Toxicol2010,5:2.
10. Eyler JM:De Kruif’s boast: vaccine trials and the construction of a virus. Bull Hist Med2006,80(3):409–438.
11. Groneberg DA, Schilling U, Scutaru C, Uibel S, Zitnik S, Mueller D, Klingelhoefer D, Kloft B:Drowning - a scientometric analysis and data acquisition of a constant global problem employing density equalizing mapping and scientometric benchmarking procedures.Int J Health Geogr 2011,10:55.
12. Schoffel N, Mache S, Quarcoo D, Scutaru C, Vitzthum K, Groneberg DA, Spallek M:Rheumatoid arthritis: scientific development from a critical point of view.Rheumatol Int2009,30(4):505–513.
13. Vogelzang BH, Scutaru C, Mache S, Vitzthum K, Quarcoo D, Groneberg DA: Depression and suicide publication analysis, using density equalizing mapping and output benchmarking.Indian J Psychol Med2011,33(1):59–65. 14. Cumulative Number of Confirmed Human Cases of Avian Influenza A/(H5N1)
Reported to WHO.http://www.who.int/csr/disease/avian_influenza/country/ cases_table_2011_04_11/en/index.html.
doi:10.1186/1471-2334-13-454
Cite this article as:Frickeet al.:Influenza: a scientometric and density-equalizing analysis.BMC Infectious Diseases201313:454.
Submit your next manuscript to BioMed Central and take full advantage of:
• Convenient online submission
• Thorough peer review
• No space constraints or color figure charges
• Immediate publication on acceptance
• Inclusion in PubMed, CAS, Scopus and Google Scholar
• Research which is freely available for redistribution