Probing model interstellar grain surfaces with small molecules
M. P. Collings,
1V.L. Frankland,
1,2J. Lasne,
1,3D. Marchione,
1A. Rosu-Finsen
1‹and M. R. S. McCoustra
11Institute of Chemical Sciences, Heriot-Watt University, Edinburgh EH14 4AS, UK 2Department of Chemistry, University of Leeds, Leeds LS2 9JT, UK
3Laboratoire Interuniversitaire des Syst`emes Atmosph´eriques (LISA), CNRS UMR 7583, Universit´e Paris-Est Cr´eteil, Universit´e Paris Diderot, Facult´e des
Sciences et Technologie, 61 avenue du G´en´eral de Gaulle, F-94010 Cr´eteil Cedex, France
Accepted 2015 February 24. Received 2015 February 24; in original form 2014 December 05
A B S T R A C T
Temperature-programmed desorption and reflection-absorption infrared spectroscopy have been used to explore the interaction of oxygen (O2), nitrogen (N2), carbon monoxide (CO) and water (H2O) with an amorphous silica film as a demonstration of the detailed characterization of the silicate surfaces that might be present in the interstellar medium. The simple diatomic adsorbates are found to wet the silica surface and exhibit first-order desorption kinetics in the regime up to monolayer coverage. Beyond that, they exhibit zero-order kinetics as might be expected for sublimation of bulk solids. Water, in contrast, does not wet the silica surface and exhibits zero-order desorption kinetics at all coverages consistent with the formation of an islanded structure. Kinetic parameters for use in astrophysical modelling were obtained by inversion of the experimental data at sub-monolayer coverages and by comparison with models in the multilayer regime. Spectroscopic studies in the sub-monolayer regime show that the C–O stretching mode is at around 2137 cm−1(5.43μm), a position consistent with a linear surface–CO interaction, and is inhomogenously broadened as resulting from the heterogeneity of the surface. These studies also reveal, for the first time, direct evidence for the thermal activation of diffusion, and hence de-wetting, of H2O on the silica surface. Astrophysical implications of these findings could account for a part of the missing oxygen budget in dense interstellar clouds, and suggest that studies of the sub-monolayer adsorption of these simple molecules might be a useful probe of surface chemistry on more complex silicate materials.
Key words: molecular data – molecular processes – methods: laboratory: molecular – dust, extinction.
1 I N T R O D U C T I O N
The gas–grain interaction is increasingly recognized as central to the physics and chemistry of the interstellar medium (ISM; Williams & Taylor1996; Garrod et al.2006; Dulieu et al.2013). Such heteroge-neous interactions rest upon fundamental aspects of the gas–solid interaction such as the nature of surface binding sites, binding en-ergies in those sites and rates of surface diffusion. The composition of the interstellar gas is well described (Tielens2013), but the na-ture of the grain surface is less well understood. We know from depletion studies that both solid carbonaceous and silicaceous ma-terials are likely to exist (Tielens2005), with evidence from mid-(Tielens2005) and far-IR (Onaka & Okada2003) spectroscopic observations pointing towards the silicate materials coming from the iron-magnesium silicate family and exhibiting both amorphous
E-mail:[email protected]
and crystalline morphologies. The recent recovery of interstellar grains by the Stardust Mission tentatively confirms this hypothesis (Westphal et al.2014). In this work, amorphous silica is used as a simple model for the more complex silicate materials to demon-strate the potential for utilizing simple gases to learn more of the nature of the gas–grain interaction.
As to the gas itself and the choice of probe species, atomic oxy-gen and nitrooxy-gen are among the most abundant elements observed in the ISM, with respective abundances of 3×10⁻⁴and 7.5 ×
10−5 relative to H measured in diffuse clouds (Meyer, Cardelli
& Sophia1997; Meyer, Jura & Cardelli1998). Despite these ap-parently low concentrations, a range of O and N bearing species have been observed in the ISM. Among them, molecular oxygen (O2), carbon monoxide (CO) and molecular nitrogen (N2) are
pre-dicted to be among the most abundant small molecules in dense cores, suggesting that these species contain a considerable propor-tion of the O, C and N budgets; while water (H2O) is the most
abundant ice component in such environments (Ehrenfreund &
2015 The Authors
at University of Leeds on March 27, 2015
http://mnras.oxfordjournals.org/
Charnley 2000). Although the observed concentrations of most species, such as CO, agree well with the values predicted by gas-phase chemistry, the models are unable to explain the formation and abundance of several essential molecules, including O2, N2and
H2O.
CO has been detected in dense molecular clouds both in the gas phase and in the icy mantles coating interstellar dust grains (Chiar et al.1998; Pontoppidan et al.2003; Thi et al.2010) with abundances of up to 10−4(see e.g. Chiar et al.1998; Pontoppidan
et al.2003; Pontoppidan, van Dishoeck & Dartois2004), and also in diffuse clouds (Liszt2007). Since N2is infrared inactive and radio
quiet, its abundance has been inferred through the detection of the gaseous N2H+ ion, which is formed by the H3+ proton transfer
reaction with N2. The calculated gas-phase abundance of N2from
N2H+can reach a few times 10−5in diffuse clouds (van Dishoeck
et al.1992; Bergin et al.2002), whilst in the cold and dense cores, it decreases by at least a factor of 2 (Belloche & Andre 2004). The results from the Odin and the submillimeter wave astronomy satellite missions placed an upper limit on the gaseous O2abundance
in dense clouds as 3–10×10−8(Goldsmith et al.2000; Larsson
et al.2007; Sandqvist et al.2008; Liseau et al.2012). As a dense cloud forms from the gravitational collapse of a diffuse cloud, the origin of the apparent reduction of the total O budget observed (from [O]=3×10⁻⁴in diffuse clouds to [O
2]=3–10×10−8in dense
cores) is unclear. Moreover, the observed O2concentration is several
orders of magnitude lower than predicted from gas-phase chemistry models (Hollenbach et al.2009; Liseau et al.2012). The main theory about this missing oxygen relates to the gas-phase reactions, and particularly the formation of CO; however, the observed cumulated abundance of all O-bearing species does not match the initial atomic abundance (Whittet2010). Another suggestion is that the missing oxygen is carried by O-bearing carbonaceous molecules present in the icy mantle of the dust grains. Recent gas–grain chemical models have demonstrated that the low abundance of O2can be obtained in
dark cloud environments (Hincelin et al.2011) based on the fresh insights into elemental oxygen depletion (Jenkins2009; Whittet
2010). This indicates that the chemical models need to include adsorption and desorption processes on interstellar dust grains to match the observed molecular abundances.
Interstellar H2O has been studied extensively (Gillet & Forrest
1973; Bar-Nun et al. 1985; O’Neill & Williams 1999; Collings et al.2003band2004; Tielens2013and references therein), which is mainly detected in the solid state on the 3.07μm O–H stretching absorption band. When H2O is deposited onto a dust grain at low
temperatures, about 10 K, it is believed to do so by ballistic depo-sition. The incoming H2O molecules ‘hit and stick’ to the surface
leading to a microporous, amorphous H2O ice (Stevens et al.1999).
Warming of the H2O ice at 38–68 K leads to the collapse of the
pores to form high density, non-porous amorphous H2O; this phase
change is not apparent in infrared spectroscopy, but can be detected through various other analytical techniques (Narten, Venkatesh & Rice1976; Jenniskens & Blake1994; Lu et al.2001). Further an-nealing leads to the formation of the cubic crystalline phase above 140 K (Jenniskens et al.1995; Smith et al.1997).
With the goal of developing our understanding of the gas–grain interaction, we will focus our efforts on the interactions of the diatomic species (CO, N2and O2) and H2O with our model silicate
surface. Temperature-programmed desorption (TPD) will be used to characterize the binding energies of molecules with the model silicate surface, while reflection-absorption infrared spectroscopy (RAIRS) will be used to explore their binding sites and surface diffusion.
2 E X P E R I M E N TA L M E T H O D S
The experiments were performed in an ultrahigh vacuum apparatus described in detail elsewhere (Fraser, Collings & McCoustra2002). Briefly, the central chamber is evacuated with a diffusion pump to a base pressure of 2×10⁻¹⁰mbar. The sample, an oxygen free high
conductivity copper block coated with amorphous silica deposited by electron-beam evaporation of fused quartz silica (Thrower et al.
2009a), is mounted onto the end of a closed-cycle helium cooled cold finger. The silica substrate can be heated using a cartridge heater (Heatwave Labs, Inc.) situated behind the sample; the sur-face temperature is monitored by a KP-type (Au-Chromel) thermo-couple. The chamber is equipped with a line-of-sight quadrupole mass spectrometer (QMS, Hiden Analytical Ltd, HAL301) for TPD and FTIR spectrometer (Varian 670-IR) and associated optics for RAIRS.
The films are deposited by background dosing of ultrapure gases onto the amorphous silica substrate held at 18 K. Exposures of the sample to the gas are expressed in monolayer (ML). TPD is per-formed by applying a heating ramp of 0.1–0.5 K s−1to a suitable
final surface temperature. The desorbing species are detected us-ing the QMS. RAIRS is performed by co-addition of 512 scans recorded with a 75ograzing incidence to the normal of the surface
and then collected by an mercury cadmium telluride detector cooled with liquid nitrogen. These experiments were conducted with a res-olution of 1 cm−1. All spectra were taken at a base temperature
after annealing the film to the temperatures stated in the relevant figures.
3 R E S U LT S A N D D I S C U S S I O N
Figs1(A–H) present the raw TPD profiles of background dosed O2, CO, N2and H2O desorbing from amorphous silica; the
left-hand panel focuses on high coverages, and the right-left-hand panel shows low coverages. At low coverage, the TPD traces of O2, CO,
N2exhibit coincident trailing edges; at high coverage, they have
coincident leading edges. For these species, the TPD profiles of the intermediate coverages exhibit both coincident leading and trailing edges; this implies that desorption occurs from three-dimensional multilayer islands formed before the completion of a monolayer. As these transition stages between sub-ML and multilayer coverages are likely to follow a variable fractional kinetic order, they are not analysed in this study. Because the desorption behaviour changes with coverage, the results are presented in two distinct sets dedicated to the multilayer and sub-ML regimes. For the H2O TPD profiles in
Figs1(G–H), a different behaviour is observed. Both low-coverage and high-coverage data show only evidence of zero-order desorption and are consistent with previous data on multilayers of H2O even
down to the characteristic feature arising from the amorphous to crystalline phase transition (Fraser et al.2001; Smith et al.2014). However, this observation is inconsistent with the work of Bolina, Wolff & Brown (2005), though the inconsistency may simply be due to differences in the substrates and experimental systems.
3.1 Multilayer desorption from amorphous silica
The experimental TPD profiles of high coverages of O2, CO,
N2 and H2O on amorphous silica are displayed in Figs 2(A)–
(D), respectively, with open symbols. O2 desorption starts at
25.4 K, and the maximum rate is reached between 28.1 K and 29.8 K, depending on the coverage. CO desorption occurs at lower temperature: it starts at 25.0 K, and peaks between 27.1 and
at University of Leeds on March 27, 2015
http://mnras.oxfordjournals.org/
Figure 1. TPD profiles of (A-B) O2, (C-D) CO, (E-F) N2and (G-H) H2O on amorphous silica for high coverages on the left and low coverages on the right.
28.8 K. N2begins to desorb at 22.0 K, with a peak between 24.2 and
25.6 K. H2O desorption occurs at much higher temperature starting
around 144 K, presenting the well-known feature due to crystalliza-tion at 150–155 K before reaching a maximum rate between 159 and 178 K. For each species, the profiles exhibit coincident leading
Figure 2. TPD profiles of (A) O2, (B) CO, (C) N2and (D) H2O multilayer desorption from amorphous silica (open symbols) and CKS fits (full lines) of the data.
edges, which is typical of zero-order desorption. This implies that the molecules are desorbing from the multilayer, where the lateral adsorbate–adsorbate interactions dominate.
To determine kinetic parameters for the multilayer desorp-tion, leading edge analysis (King1975) is combined with kinetic
at University of Leeds on March 27, 2015
http://mnras.oxfordjournals.org/
[image:3.595.333.514.56.635.2]Figure 3. Leading edge analysis of the kinetic order of O2 multilayer desorption from amorphous silica.
modelling using the Chemical Kinetic Simulator (CKS)1package.
This approach has successfully been used to study the desorption ki-netics of CO multilayers from water ice (Collings et al.2003a) and C6H6multilayers from amorphous silica (Thrower et al. 2009a).
Leading edge analysis is based on the Polanyi–Wigner equation (1), which expresses the desorption raterdesas function ofN(t)the
surface concentration of the adsorbed species at timet:
rdes= −
dN
dt =νN(t) nexp
−Edes
kBT
, (1)
whereν is the pre-exponential factor, nand Edes the desorption
order and energy,kB the Boltzmann constant andT the surface
temperature. To determine N(t), the initial concentration on the surface (Ntot) is assumed to be equal to the rate of bombardment
(ZW) multiplied by the dose time (τ)(equation (2)):
Ntot=ZWτ=
P Sτ √
2πmkBT
, (2)
wherePis the pressure (in Pascal),Sthe sticking coefficient andm the mass of one of the molecules considered. IfSis unity, then at the low surface temperatures employed in this study the desorption flux is negligible and all molecules are assumed to stick to the surface. The values ofN(t)are obtained by subtracting the total gas-phase concentration at the previous time step to the initial surface concentration (Ntot).
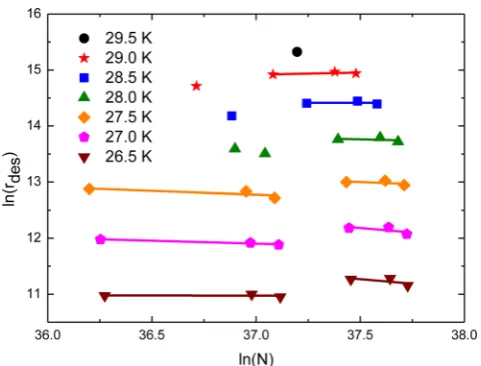
The procedure for calculating the kinetic order of desorption (n)has been described elsewhere (Green et al.2009). Briefly, the natural logarithm is applied to a rearranged version of the Polanyi– Wigner equation (1), giving, for fixedT, a linear relationship be-tweenln(rdes)andln(N), where the gradient equalsn. Using this
procedure leads to kinetic orders ofn=0.03±0.06 for CO and n=0.06±0.06 for N2. These are not inconsistent with the
ex-pected zero-order kinetics given the error limits derived from our analysis. Fig.3shows the relevant plot ofln(rdes)againstln(N)for
the 1 to 6 ML O2TPD experiments. Here a cursory analysis might
1Chemical Kinetics Simulator (CKS), Version 1.0, IBM, IBM Al-maden Research Centre, 650 Harry Road, Mailstop ZWX1D1, San Jose, CA, USA. Further information may be obtained from http://www.almaden.ibm.com/st/computational_science/ck/?cks
suggest a non-zero order of around 0.23±0.11. However, on care-ful review of the data and a deeper investigation of the behaviour of O2, we are led to the conclusion that the data in Fig.3present
two regions of zero-order behaviour offset in terms of exhibiting different desorption rates and reflecting theα→βphase transition in solid O2reported by Cairns & Pimentel (1965) and Freiman &
Jodl (2004) and references therein at around 24 K. As theα→β
phase transition occurs, a monoclinic distortion in the crystal struc-ture happens. However, a consensus about exactly what takes place at this transition has so far not been reached (Freiman & Jodl2004
and references therein). Fortuitously, the experimental conditions of this work allows for the observation of this phase change through the different zero-order desorption regions. The same cannot be said for N2and CO. In these systems, theα→βphase change is found
to occur at higher temperatures, about 36 and 61 K, respectively, for N2and CO, and hence only observed at higher pressures (Gill
& Morrison1966; Freiman & Jodl2004).
CKS is a stochastic integration program which integrates a raw law equation for each step in a reaction mechanism. A simple mech-anism is used for the desorbing species (hereafter denoted asD):
Dads→Dgas (3)
Dgas→Dpump, (4)
whereDads indicates a molecule adsorbed on the surface,Dgasin
the gas phase andDpump a molecule removed from the system by
pumping. In the simulations, the initial surface concentration is taken asNtotand the values ofνandEdesfor (3) are those obtained
from leading edge analysis. The pumping step shown in (4) is assumed to be temperature independent and its rate coefficient (k) is obtained by comparing the experimental and simulated trailing edges for each dose. The resulting CKS fits are displayed with full lines in Figs2(A–D) and describe the experimental data (open symbols) well. The average values of the kinetic parameters are presented in Table1, these values are consistent with those found by other multilayer studies done on these molecules (Fraser et al.
2001; Haq, Harnett & Hodgson2002; Collings et al.2003a; ¨Oberg et al.2005; Bisschop et al.2006; Fuchs et al.2006; Acharyya et al.
2007; Noble et al.2012). In the case of O2, it is necessary to consider
theα→βphase transition and parallel desorption from the two phases. However, CKS modelling suggest a negligible effect of the phase transition on the empirically observed TPD profiles.
Although our analysis is consistent with the literature, there is some evidence for small deviations from zero-order behaviour as the rate of desorption approaches its maximum. This kind of behaviour has been investigated numerically in recent studies of methanol, ethanol and water desorption from graphene (Smith et al.2014). Deviations from zero order as small as 0.05 have an impact on the shape of the TPD curve at its maximum. Our small deviation from zero and realistic 2σ error limits suggest that the three species are indeed expressing zero-order desorption. The small deviations may then reflect the impact of the surface heterogeneity in the final stages of multilayer desorption.
3.2 Sub-monolayer desorption from amorphous silica
The experimental TPD profiles of O2, CO, N2and H2O in the
sub-ML regime on bare silica are presented in Figs1(B), (D), (F) and (H), respectively, with full symbols. From this figure, the diatomic molecules present distinctively different behaviour to that of H2O
in this coverage range.
at University of Leeds on March 27, 2015
http://mnras.oxfordjournals.org/
Table 1. Average kinetic parameters for multilayer coverages of O2, CO, N2and H2O desorbing from amorphous silica. [1]=Acharyya et al. (2007); [2]=Fuchs et al. (2006); [3]=Fraser et al. (2001).
Species n ν/ molecules cm−2s−1 E
des/kJ mol−1(K) Edes/ kJ mol−1
(this work) (this work) (literature)
O2 −0.07±0.07 1028 7.5± 0.2 (902±24) 7.6±0.2 (914±24) [1,2]
−0.13±0.24
CO 0.03±0.6 1026 7.3± 0.3 (878±36) 7.1±0.2 (854±24) [1,2] N2 0.06±0.06 1027 6.9± 0.3 (830±36) 6.6±0.2 (794±24) [2]
H2O 1028 49.3± 2 (5930±240) 48±0.5 (5770±60) [3]
In the case of O2, CO and N2, the TPD traces exhibit coincident
trailing edges, which is usually typical of second-order recombina-tive desorption. However, these species do not dissociate on silica at low temperature. Instead, the amorphous silica surface presents a range of binding sites with different binding energies for adsorp-tion (Thrower et al.2009a). The alignment of the trailing edges indicates that the molecules are mobile enough to find the deepest, energetically most favourable binding sites on the amorphous silica surface. As a consequence, the molecules situated in the weaker binding sites desorb first, resulting in desorption peak broadening.
Since the assumption of a single value forEdesis no longer valid,
leading edge analysis cannot be applied to the sub-ML coverages desorbing from amorphous silica. Instead, direct inversion of the Polanyi–Wigner equation (5) givesEdesas function of the surface
concentration at timet,N(t):
Edes= −kBTln
dNdt νN(t)n
(5)
This technique was first reported by Tait et al. (2005) and has since been adapted to describe small molecule desorption from similar heterogeneous surfaces (Thrower et al.2009b). The values ofdN/dtare calculated as in the multilayer case, andnandν are assumed as 1 and 1×10¹²s−1, respectively. The latter is typical
of the pre-exponential factor for desorption of a van der Waals bound adsorbate. The values ofN(t)are determined fromNtotusing
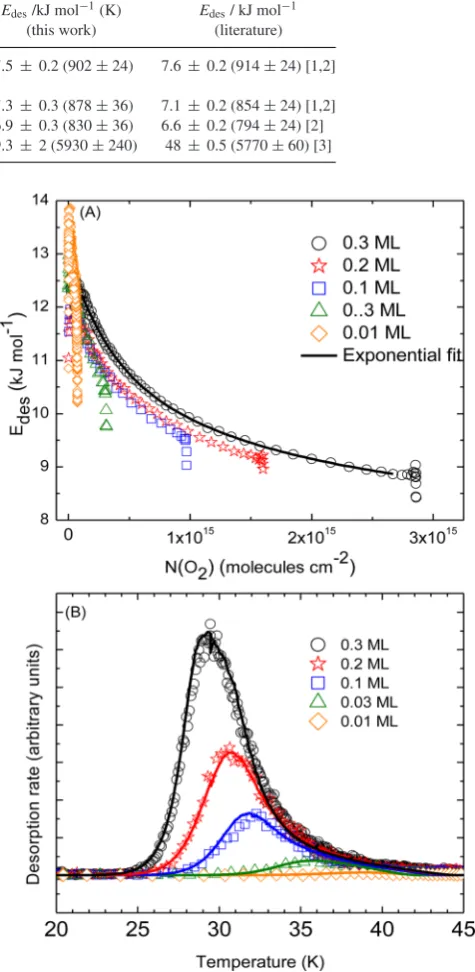
the same procedure as discussed for the leading edge analysis. Plots ofEdesagainstN(t)are constructed for each O2sub-ML dose
(Fig.4(A)). Similar plots have been constructed for CO and N2but
are not presented here. An exponential fit is then made to the data to obtain theEdes(Nads) function (an example is shown in Fig.4(A) for
the 0.3 ML dose). The kinetic modelling technique used is based on theFORTRAN90 program developed to model C6H6desorption peaks
in the work of Thrower et al. (2009c). The experimental time and surface temperatures are taken as an input and the program coding altered for eachEdesfunction (the exponentials extracted from the
fits mentioned above) to calculate the desorption rate through the Polanyi–Wigner equation (1). The output data contain the calculated desorption rate and value ofEdesat each simulated time point. The
simulations are displayed in Fig.4(B) with full lines and agree well with the experimental data, indicating that the desorption of the O2,
CO and N2sub-MLs from silica follows first-order kinetics with
a range of desorption energies; the calculated values of which are displayed in Table2.
For the H2O data, the leading edge coincidence and the
consis-tency throughout the sub-ML to multilayer TPD data suggest that even at the lowest coverages H2O is found on the surface as clusters
or islands. The low-coverage phase therefore exists as an equilib-rium between a gas and a condensed phase. Under such conditions, zero-order desorption is expected and is observed. This arises sim-ply as a consequence of the balance of intermolecular forces at play.
Figure 4. The top figure is the plots ofEdesas function ofNthe surface concentration of adsorbed O2for background dosed O2sub-MLs. The ex-ponential fit of theEdesdistribution is shown for the 0.3 ML background deposition with a full line. The bottom figure is the TPD profiles of sub-ML coverages of O2(open symbols) on amorphous silica with the simulated curves (full lines).
H2O molecules interact more strongly with each other than with the
underlying silica, favouring the growth of islands when mobility on the silica is possible; H2O de-wets from the silica (Kaya et al.
2007; Smith et al.2014). In contrast, with the diatomic species, the interaction between the silica and O2, CO, and N2is stronger than
that between O2molecules; between CO molecules; and between
N2molecules (Table2). These species therefore wet the silica.
at University of Leeds on March 27, 2015
http://mnras.oxfordjournals.org/
Table 2. Edes range for sub-monolayer coverages of O2, CO and N2 and H2O on amorphous silica as compared to the multilayer coverage data at the bottom of the table.
Coverage / ML Edes/ kJ mol−1(K)
Sub-monolayer O2 CO N2 H2O
0.01 11.0–11.9 (1320–1431) – – –
0.03 10.0–11.4 (1200–1371) 10.7–12.2 (1287–1467) 11.8–13.4 (1419–1612) –
0.06 – 9.9–11.7 (1191–1407) 10.9–12.2 (1311–1467) –
0.1 9.0–11.2 (1100–1347) – – –
0.2 8.4–11.2 (1010–1347) – – 38.5–41.5 (4630–4991)
0.3 8.0–11.6 (960–1395) 8.2–10.8 (986–1299) 8.8–11.2 (1058–1347) –
0.4 – – – 34–36 (4090–4330)
Multilayer O2 CO N2 H2O
≥1 7.5±0.2 (902±24) 7.3±0.2 (878±36) 6.9±0.3 (830±36) 49.3±2 (5930±240)
3.3 Vibrational spectroscopy in the sub-monolayer regime
Figs5and6present the RAIR spectra of the C–O stretching and O–H stretching regions for sub-ML quantities of CO and H2O,
[image:6.595.46.287.498.659.2]respectively, on amorphous silica at 20 K. The CO spectra, with
Figure 5. Temperature-programmed RAIRS of 0.6 ML CO on silica indi-cates no difference in the feature as the temperature is increased signifying that CO is free to diffuse above 20 K to sample the most favourable binding sites on the surface.
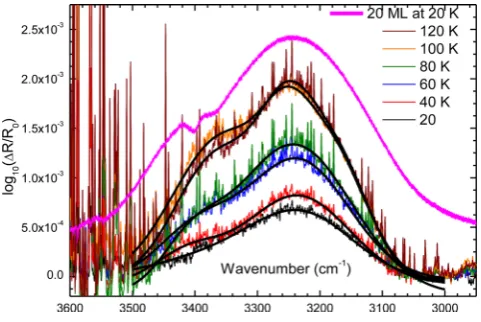
Figure 6. Temperature-programmed RAIRS of H2O showing the diffusion of H2O starting at about 40 K and reaching a plateau at 100 K. The dashed lines are the experimental spectra while the solid lines are a result of Gaussian fittings, meant as a guide to the eye. The 20 ML trace is scaled by a factor of 1/20 so as to compare the annealed spectra with bulk H2O. The sharp features in the spectra are due to gas-phase H2O present in the optics purge gas.
the C–O stretch at 2137 cm−1(5.34
μm), show no change upon annealing the substrate from 20 to 22 and 24 K. At 26 K, CO has started to desorb and the spectrum has therefore not been included in Fig.5. In contrast in the H2O spectra, the O–H stretch, initially
quite weak at 3239 cm−1(8.10
μm), shifts and strengthens as the surface temperature is increased above 40 K until it reaches a steady state, positioned at 3252 cm−1(8.13
μm), at around 100 K, with no further changes in position and intensity until H2O desorbs from
137 K.
C–O stretching in solid CO has been extensively studied. How-ever, as far as we are aware, the only RAIR spectra of CO on surfaces of astrophysical relevance are those reported by Collings and co-workers on water and other molecular solid surfaces (Collings et al.
2003a,b; Collings, Dever & McCoustra2014) and Fraser and co-workers on a zeolite (Fraser et al.2005). The position of the C–O stretch in the present data can be readily compared with the data of Collings et al. (2014). A C–O stretching feature at 2137 cm−1(5.34
μm) shifted from the molecular wavenumber of 2143 cm−1(5.36
μm) is entirely consistent with CO being physisorbed to the silica surfaceviaits C atom in what Collings et al. describe as aσ geome-try (Collings, Dever & McCoustra2014). Pontoppidan et al. (2003) reported three features of solid CO; 2143.7 cm−1(5.36
μm), 2139.9 cm−1(5.35
μm) and 2136.5 cm−1(5.34
μm), the first two features were ascribed to bulk CO in the ISM. The feature at 2136.5 cm−1
(5.34μm) is stated as being inconsistent with what was previously thought to be a CO–H2O interaction. The 2136.5 cm−1(5.34μm)
band has also been assigned to CO mixed in methanol (CH3OH)
which is the final hydrogenation product of CO (Cuppen et al.2011). Given the experimental uncertainties, Fig.5suggests an alternative assignment of CO being directly bound to the silica surface. This figure supports the assignment that the feature at 2136.5 cm−1(5.34
μm) is not due to a CO–H2O interaction. However, it is worth noting
that the presence of iron and magnesium ions in the silica matrix may subtly shift this position due to modifications of the silica–CO interaction (Collings, Dever & McCoustra2014). The invariance of the CO feature in Fig.5with temperature is, of course, consistent with the CO being able to readily diffuse over the silica surface to eventually sample the most energetically favourable binding sites.
The RAIR spectra of H2O ice adsorbed on silica are less well
known (Kaya et al.2007). Indeed these data represent, to the best of our knowledge, the first measurements of H2O sub-MLs adsorbed
on silica at cryogenic temperatures. At the deposition temperature (20 K), the O–H stretch can be identified in Fig.6as a weak feature at 3232 cm−1(8.08
μm). As we anneal, diffusion is activated at around 40 K, corresponding to a barrier height for H2O diffusion
on the silica surface ofca.10–15 kJ mol−1(1200–1800 K), and
at University of Leeds on March 27, 2015
http://mnras.oxfordjournals.org/
island growth commences. The O–H stretch grows and shifts in intensity, from 3232 cm−1(8.08
μm) to 3250 cm−1(8.12
μm). In addition a new shoulder is observed to grow at 3353 cm−1(8.38
μm). When the ice is annealed to 100 K and 120 K, the band resem-bles the RAIR spectra of 20 ML H2O, i.e. a complete amorphous
solid water film, deposited under similar conditions as shown in Fig.6. This similarity between the annealed spectra and the bulk O–H stretching modes reflects the formation of hydrogen-bonded H2O islands. Such behaviour is consistent with the observation that
as annealing in this temperature range does not result in loss of H2O
from the surface (i.e. the number of O–H oscillators remain con-stant) then the intensity increase can only be due to an increase in oscillator strength. This is only known to happen with O–H stretch-ing modes in H2O when moving from isolated H2O molecules to
fully hydrogen-bonded H2O molecules in bulk solid or liquid H2O
(Xantheas & Dunning1993; Ceponkus, Uvdal & Nelander2008). This behaviour is entirely consistent with the observed thermal des-orption behaviour of H2O on the amorphous silica surface.
4 A S T R O P H Y S I C A L I M P L I C AT I O N S
In the sub-ML regime, the higher energy end of the binding energy distribution in the case of all the diatomic molecules means that these molecules will have a significantly enhanced surface lifetime and so allowing them to explore the grain surface more fully. Con-sidering a dust grain temperature of 15 K (Greenberg1971) and increasing the binding energy of sub-ML coverages from 8.0 kJ mol−1to 11.9 kJ mol−1(960 to 1431 K), the range we report for
the binding energy on the amorphous silica for O2, will increase
the lifetime on the surface from 23×106to above 1020yr.
Sili-cate minerals in astrophysical environments are subject to radiation weathering with the consequence that in iron–magnesium silicates such as olivine, segregation of iron atoms and nanoparticles is ob-served (Toppani et al.2006). A long lifetime for O2on such surfaces
(even ignoring the likely depth of any chemisorption sites on the iron atoms and nanoparticles) will give O2sufficient time to explore the
grain surface, find an iron atom or nanoparticle and likely undergo dissociative adsorption. Chemisorption of O2on iron is well known
(Ertl & Huber1980) and binding energies are typically 550 kJ mol−1
(66 150 K). Lifetimes of O atoms in such sites would therefore be measured on timescales of>1020 yr at ISM temperatures. The O
atoms would also be invisible to gas-phase spectroscopy, to mid-IR spectroscopy of the solid state and would be hard to distinguish from any Fe–O signatures from the mineral in the far-IR/THz. This might provide an additional sink for O in the solid state that could contribute to addressing the issue of O absence.
Water adsorbed at low temperature on silica starts diffusing around 40 K, corresponding to an activation energy ofca.10–15 kJ mol−1(1200–1800 K) consistent with the energy of one
hydrogen-bond between H2O and the substrate. Hence, water formed on a
grain at typical dense cloud temperatures (10–15 K) would not be able to diffuse on the surface until the temperature of the dust grain is raised above 40 K by an external heat source. At the low temper-atures of dense clouds, the surface of the water ice layer covering the grains is therefore static, and all water molecules formed in this environment or impinging the grains surface would freeze in their initial position, confirming the view of a ballistic deposition. A common ‘rule of thumb’ states that the diffusion barrier is roughly 10 per cent of the desorption energy. However, the diffusion of H2O
into islands, which desorb with zero-order kinetics and exhibit a binding energy of 35–40 kJ mol−1(4210–4810 K) (consistent with
two hydrogen-bonds to the H2O surface), suggests that the binding
energy of H2O to silica would be lower. This would mean that the
rule of thumb is not obeyed in this instance. The diffusion barrier of 10–15 kJ mol−1(1200–1800 K) inferred in this work is much
higher than what is expected from the ‘rule of thumb’, which would give an estimated barrier of 4 kJ mol−1(480 K). The reason for the
deviation in barrier energy could be that the ‘rule of thumb’ is more effective when considering simple van der Waals interactions as opposed to hydrogen bonding. The 15 kJ mol−1(1800 K) diffusion
barrier suggests that water molecules, forming at low temperatures with two hydrogen-bonds to the silica surface, have one of their hydrogen-bonds broken above 40 K. This allows diffusion, which could be pictured as a penguin-like random walk between adsorp-tion sites, until the water molecule finds a more stable adsorpadsorp-tion site by islanding with other water molecules. In this configuration, water molecules form on average three hydrogen-bonds, as sug-gested by the desorption energy of H2O multilayers ofca.50 kJ
mol−1(6010 K).
5 C O N C L U S I O N
The key outcomes of this work can be summarized in a few points.
(1) Desorption of multilayer films of O2, CO, N2and H2O from
the amorphous silica surface is zero order and consistent with that previously reported in the literature. The only notable exception, which is likely to have accrued from our use of line-of-sight des-orption methods, is the observation of a low-temperature phase change in solid O2at around 25.5 K as a change of the rate of
des-orption. This is not unlike the behaviour observed when amorphous H2O ice crystallizes.
(2) In the sub-ML regime, distinctly contrasting behaviour is seen from the diatomic molecules and H2O. The diatomic species
explore the range of binding sites on the amorphous silica surface, finding the energetically most favourable sites and consequently desorbing with first-order kinetics. O2, N2and CO clearly wet the
silica surface. Binding energy data are presented which support this assertion. In the case of H2O, the H2O–H2O interactions dominate
over the H2O–silica interactions and even at the lowest of coverages
studied, H2O film growth follows an island growth model and
zero-order desorption kinetics. H2O therefore de-wets from the silica
surface at temperatures significantly below the desorption temper-ature.
(3) CO RAIR spectra in the sub-ML regime are consistent with adsorption in a geometry where CO interacts with the silica surface viaits C atom in what Collings et al. (2014) describe as aσ ge-ometry. The shift in frequency from gaseous CO is consistent with the strength of interaction in the sub-ML regime extracted from inversion of the relevant TPD data.
(4) H2O RAIR spectra for sub-ML coverages on amorphous
sil-ica at temperatures below 30 K confirm the ballistic deposition mechanism that many have postulated for growth in this tempera-ture regime (Zondlo et al.1997; Kimmel et al.2001). At tempera-tures above 40 K, the weak O–H stretching spectra strengthen in a manner consistent with increasing ease of diffusion and growth of H2O cluster and islands. This we believe is the first observation of
such and suggests that H2O diffusion is thermally activated above
40 K.
Our results have astrophysical implications for gas–grain ex-changes in the dense and diffuse ISM clouds. The morphology of the dust grains surface seems to exert a non-negligible influence on desorption of adsorbed species by offering binding sites with a range of binding energies. Higher desorption energies in the sub-ML
at University of Leeds on March 27, 2015
http://mnras.oxfordjournals.org/
regime mean a higher lifetime for the molecules adsorbed on bare silica at the edge of the molecular clouds and proto-planetary discs. They could be more efficiently processed by UV and higher energy photons or by reactive radicals and give rise to a specific chemistry for the molecular species in this low H2O concentration. The
mul-tilayer studies of O2might also suggest that a part of the apparent
‘oxygen budget reduction’ could be due to the underestimation of the solid O2abundance on ices.
More importantly we have established that sub-ML TPD and RAIRS studies, especially on CO and H2O, will allow us to probe
the physicochemical nature of more realistic silicate surface mod-els containing iron and magnesium; especially under conditions where metallic segregation may be promoted by ionizing radiation exposure.
AC K N OW L E D G E M E N T S
The authors acknowledge the support of the UK Engineering and Physical Science Research Council (EPSRC, EP/D506158/1) and the European Community FP7-ITN Marie-Curie Programme (LASSIE project, grant agreement #238258). VLF thanks EPSRC for a DTA Studentship; Ryan Nish (Heriot-Watt University chem-istry undergraduate project student), Ellen Kendrick and Sandy Watt (Nuffield Foundation project students) for their assistance in the ex-periments. ARF thanks HWU for a James Watt Scholarship. JL and DM acknowledge funding from the European Community FP7-ITN Marie-Curie Programme (LASSIE project, grant agreement #238258). The authors also acknowledge Dr. Ali G. M. Abdulgalil for his valuable experimental assistance.
R E F E R E N C E S
Acharyya K., Fuchs G. W., Fraser H. J., van Dishoeck E. F., Linnartz H., 2007, A&A, 466, 1005
Bar-Nun A., Herman G., Laufer D., Rappaport M. L., 1985, Icarus, 63, 317 Belloche A., Andre P., 2004, A&A, 419, L35
Bergin E. A., Alves J., Huard T., Lada C. J., 2002, ApJ, 570, L101 Bisschop S. E., Fraser H. J., ¨Oberg K. I., van Dishoeck E. F., Schlemmer S.,
2006, A&A, 449, 1297
Bolina A. S., Wolff A. J., Brown W. A., 2005, J. Phys. Chem. B, 109, 16836 Cairns B. R., Pimentel G. C., 1965, J. Chem. Phys., 43, 3432
Ceponkus J., Uvdal P., Nelander B., 2008, J. Phys. Chem. A, 112, 3921 Chiar J. E., Gerakines P. A., Whittet D. C. B., Pendleton Y. J., Tielens A. G.
G. M., Adamson A. J., Boogert A. C. A., 1998, ApJ, 498, 716 Collings M. P., Dever J. W., Fraser H. J., McCoustra M. R. S., 2003a,
Ap&SS, 285, 633
Collings M. P., Dever J. W., Fraser H. J., McCoustra M. R. S., Williams D. A., 2003b, ApJ, 583, 1058
Collings M. P., Anderson M. A., Chen R., Dever J. W., Viti S., Williams D. A., McCoustra M. R. S., 2004, MNRAS, 354, 1133
Collings M. P., Dever J. W., McCoustra M. R. S., 2014, Phys. Chem. Chem. Phys., 16, 3479
Cuppen H. M., Penteado E. M., Isokoski K., van der Marel N., Linnartz H., 2011, MNRAS, 417, 2809
Dulieu F., Congiu E., Noble J., Baouche S., Chaabouni H., Moudens A., Minisalle M., Cazaux S., 2013, Sci. Rep., 3, 1338
Ehrenfreund P., Charnley S. B., 2000, ARA&A, 38, 427 Ertl G., Huber M., 1980, Z. Phys. Chem., 119, 97
Fraser H. J., Collings M. P., McCoustra M. R. S., Williams D. A., 2001, MNRAS, 327, 1165
Fraser H. J., Collings M. P., McCoustra M. R. S., 2002, Rev. Sci. Instrum., 73, 2161
Fraser H. J., Bisschop S. E., Pontoppidan K. M., Tielens A. G. G. M., van Dishoeck E. F., 2005, MNRAS, 356, 1283
Freiman Y. A., Jodl H. J., 2004, Phys. Rep., 401, 1
Fuchs G. W. et al., 2006, Faraday Discussion, 133, 331
Garrod R., Park I. H., Caselli P., Herbst E., 2006, Faraday Discuss., 133, 51 Gill E. K., Morrison J. A., 1966, J. Chem. Phys., 45, 1585
Gillet F. C., Forrest W. J., 1973, ApJ, 483 Goldsmith P. F. et al., 2000, ApJ, 539, L123
Green S. D., Chen R., Collings M. P., Brown W. A., McCoustra M. R. S., 2009, MNRAS, 398, 357
Greenberg J. M., 1971, A&A, 12, 240
Haq S., Harnett J., Hodgson A., 2002, Surf. Sci., 505, 171
Hincelin U., Wakelam V., Hersant F., Guilloteau S., Loison J. C., Honvault P., Troe J., 2011, A&A, 530, A61
Hollenbach D., Kaufman M. J., Bergin E. A., Melnick G. J., 2009, ApJ, 690, 1497
Jenkins E. B., 2009, ApJ, 700, 1299
Jenniskens P., Blake D. F., 1994, Science, 265, 753
Jenniskens P., Blake D. F., Wilson M. A., Pohorille A., 1995, ApJ, 455, 389 Kaya S., Weissenrieder J., Stacchiola D., Shaikhutdinov S., Freund H. -J.,
2007, J. Phys. Chem. C, 111, 759
Kimmel G. A., Dohn´alek Z., Stevenson K. P., Smith R. S., Kay B. D., 2001, J. Chem. Phys., 114, 5295
King D. A., 1975, Surf. Sci., 47, 384 Larsson B. et al., 2007, A&A, 466, 999 Liseau R. et al., 2012, A&A, 541, A73 Liszt H. S., 2007, A&A, 476, 291
Lu Q.-B., Madey T. U., Parenteau L., Weik F., Sanche L., 2001, Chem. Phys. Lett., 342, 1
Meyer D. M., Cardelli J. A., Sophia U. J., 1997, ApJ, 490, L103 Meyer D. M., Jura M., Cardelli J. A., 1998, ApJ, 493, 222
Narten A. H., Venkatesh C. G., Rice S. A., 1976, J. Chem. Phys., 64, 1106 Noble J. A., Congiu E., Dulieu F., Fraser H. J., 2012, MNRAS, 4, 768
¨
Oberg K. I., van Broekhuizen F., Fraser H. J., Bisschop S. E., van Dishoeck E. F., Schlemmer S., 2005, ApJ, 621, L33
Onaka T., Okada Y., 2003, ApJ, 585, 872
O’Neill P. T., Williams D. A., 1999, Ap&SS, 266, 539 Pontoppidan K. M. et al., 2003, A&A, 408, 981
Pontoppidan K. M., van Dishoeck E. F., Dartois E., 2004, A&A, 426, 925 Sandqvist Aa. et al., 2008, A&A, 482, 849
Smith R. S., Huang C., Wong E. K. L., Kay B. D., 1997, Phys. Rev. Lett., 79, 909
Smith R. S., Scott R., Matthiesen J., Kay B. D., 2014, J. Phys. Chem. A, 118, 8242
Stevens K. P., Kimmel G. A., Donhalek Z., Smith R. S., Kay B. D., 1999, Science, 283, 1505
Tait S. L., Dohnalek Z., Campbell C. T., Kay B. D., 2005, J. Chem. Phys., 122, 164707
Thi W. -F., van Dishoeck E. F., Pontoppidan K. M., Dartois E., 2010, MN-RAS, 406, 1409
Thrower J. D., Collings M. P., Rutten F. J. M., McCoustra M. R. S., 2009a, J. Chem. Phys., 131, 244711
Thrower J. D., Collings M. P., Rutten F. J. M., McCoustra M. R. S., 2009b, MNRAS, 394, 1510
Thrower J. D., 2009c, PhD thesis, Heriot-Watt University
Tielens A. G. G. M., 2005, The Physics and Chemistry of the Interstellar Medium, Cambridge Univ. Press, Cambridge
Tielens A. G. G. M., 2013, Rev. Mod. Phys., 85, 1021
Toppani A., Dukes C., Baragiola R., Bradley J. P., 2006, Lunar Planet. Sci., 37, 2056
van Dishoeck E. F., Phillips T. G., Keene J., Blake G. A., 1992, A&A, 261, L13
Westphal A. J. et al., 2014, Science, 345, 786 Whittet D. C. B., 2010, ApJ, 710, 1009
Williams D. A., Taylor S. D., 1996, Q. J. R. Astron. Soc., 37, 565 Xantheas S. S., Dunning T. H., Jr, 1993, J. Chem. Phys., 99, 8774 Zondlo M. A., Onasch T. B., Warshawsky M. S., Tolbert M. A., Mallick G.,
Arentz P., Robinson M. S., 1997, J. Phys. Chem. B, 101, 1088
This paper has been typeset from a TEX/LATEX file prepared by the author.
at University of Leeds on March 27, 2015
http://mnras.oxfordjournals.org/