www.electrochemsci.org
A Simple and Selective Flow-Injection Potentiometric Method
for Determination of Iodide Based on a Coated Glassy Carbon
Electrode Sensor
Saeed S. Beheshti, Mohammad K. Amini*
Department of Chemistry, University of Isfahan, Isfahan, 81746−73441, I. R. Iran
*E-mail: [email protected]
Received: 5 August 2007 / Accepted: 18 August 2007 / Published: 1 October 2007
A flow-injection (FI) method is reported for the determination of iodide based on potentiometric detection, using a membrane electrode containing bis(4-chlorothiophenolato)mercury(II) [Hg(CTP)2]
as the active component. The response of the system was evaluated with regard to the parameters of the membrane electrode and the FI system. The calibration curve for iodide at the optimized conditions including 0.01 M sodium sulfate (pH 6.0) carrier solution with a flow rate of 1 mL min-1 and an injection volume of 100 µL was linear over the range 1.0×10⁻⁶-7.6×10⁻² M with a Nernstian slope of -59.4 mV per decade of iodide activity. The influence of several common inorganic and organic anions on the response of the FI system was investigated and selectivity coefficients were evaluated. The sensor shows high selectivity towards iodide, which can be related to the selective interaction of iodide as a soft anion with mercury atom in Hg(CTP)2 as a soft metal center. This is certified by the very low
tendency of the sensor towards chloride, bromide, and the highly lipophilic anions such as perchlorate, salicylate, nitrate, nitrite, and thiocyanate. The system exhibited a fast response time of less than 5 s (in the batch mode), a detection limit of 5.0×10⁻⁷ M and a relative standard deviation of 0.6% at 0.1 mM
iodide. The sampling frequency was between 40-120 h-1 depending on the concentration of iodide in the measuring solution. The proposed system was applied to the determination of iodide in a pharmaceutical preparation and the results were compared with a standard potentiometric method based on silver indicator electrode.
Keywords: Iodide; Flow-injection analysis; Bis(4-chlorothiophenolato)mercury(II); Membrane electrode; Potentiometry
1. INTRODUCTION
normal diet, iodine supplements are administered. Iodine compounds are also used in preparation of some pharmaceutical products used to compensate iodine deficiency or used as antiseptic and disinfectant agents. Therefore, the determination of iodine and its related compounds is important in a variety of samples such as food [2,3], fodder [4], waters [4], clinical and biological samples [4,5], pharmaceutical preparations [6,7] and environmental samples [8,9].
A survey of literature reveals that iodide and/or iodine may be determined by various methods, including chromatography [10,11], capillary electrophoresis [12], gas chromatography-mass spectrometry (MS) [13], inductively coupled plasma (ICP)-MS [14], ICP atomic emission spectrometry [15], diffuse reflectance spectroscopy [16], radiochemical neutron activation analysis [17], chemiluminescence [5,7], UV-Vis spectrophotometry [18-20], catalytic spectrophotometric methods [21-23], and atomic absorption spectrometry [24,25]. Most of these techniques either involve several manipulation steps or are very expensive to be used for routine analysis.
Electrochemical detection methods such as amperometry [3,4], biamperometry [20], stripping voltammetry [26], and potentiometry [27-29] have also been reported but have not been as widely used as the spectroscopic methods. Among these methods, potentiometric detection is fundamentally the simplest of all, as the response is directly in the electronic domain and no excitation signal has to be applied [30]. Potentiometric sensors based on ion-selective electrodes (ISEs) offer much better selectivity and wider dynamic range than either spectroscopy or amperometry because of the logarithmic response of ISEs, and simpler instrumentation. These sensors are widely applied owing to their simplicity, low cost and applicability to samples of various nature [31,32]. The remarkable progress in the application of ISEs can be attributed mainly to their widespread use as flow-through detectors in automatic analyzers, continuous monitoring systems and flow-injection potentiometry (FIP) [33-35]. Potentiometric measurement in the FI mode is generally more advantageous than the steady state mode, in terms of fast sample throughput rate, use of small sample volumes, continuous washing of the detector, high precision and the possibility of system automation [36]. The FIP is also known to possess several other advantages including rapid response, simple instrumentation, low cost, high selectivity and sensitivity. Further, the transient nature of the signal in FIP may help to overcome the effect of interfering ions if their response is slower than the analyte [37,38].
The present work describes a FI method for the determination of iodide based on a potentiometric sensor. The sensor was prepared by coating a glassy carbon electrode with plasticized PVC membrane containing Hg(CTP)2 as the active ingredient. The performance characteristics of the
FIP system and the influence of several operating parameters on its response properties were investigated. The proposed method was used in an assay to determine iodine in a pharmaceutical product.
2. EXPERIMENTAL PART
2.1. Reagents and chemicals
and were used as received. The salts used for preparation of standard solutions including potassium salts of iodide, thiocyanate, chloride, bromide, and sodium salts of sulfate, nitrate, nitrite, perchlorate, acetate, oxalate, salicylate and fluoride, were analytical reagent grade received from Merck. Deionized-distilled water was used throughout all experiments. The Hg(CTP)2 carrier was prepared
according to a previously reported procedure [39].
2.2. Sample preparation
The iodide sample was prepared from a pharmaceutical preparation (Meglumine Compound Injection from Daro-Paksh Pharmaceutical Co.). To 1.0 g of the preparation was added 12.5 mL 5.0 M sodium hydroxide solution, 25 mL water and 2.0 g zinc powder and the mixture was refluxed for 30 min [40]. After cooling, the mixture was filtered, washed with ∼50 mL water, acidified to pH 6.0 with sulfuric acid and diluted to a final volume of 1 L. The iodide content of the resulting sample was determined by the proposed method using the standard addition method.
2.3. Preparation of the iodide sensor
Glassy carbon disk electrode (3 mm2) was polished with alumina (0.05 µm) then rinsed
thoroughly with water and finally with THF. The formation of membrane film on the glassy carbon disk surface was obtained by immersing the electrode tip into the membrane solution and keeping it upward to dry. The coated electrode was allowed to set overnight. The coated electrode was rinsed with water and conditioned for ∼18 h in 0.05 M potassium iodide solution. The general procedure to prepare the membrane solution has been described previously [41]. Briefly, 31.0 mg powdered PVC, 61.7 mg DBP, 5.0 mg Hg(CTP)2 and 2.3 mg MTOAC were dissolved in 2 mL THF. The coating
solution is stable for several weeks if it is kept in refrigerator and can be used for construction of new electrodes.
2.4. Flow- injection system
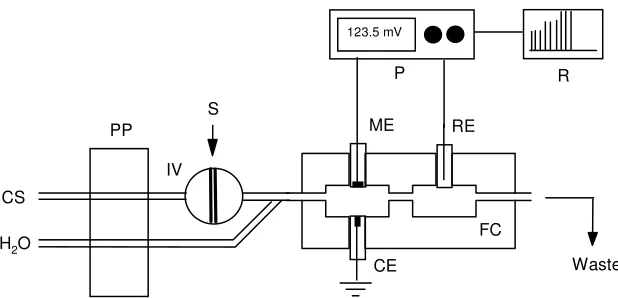
The FIP system (Fig. 1) utilized a carrier solution, CS, (0.01 M Na2SO4, pH 6.0) conducted by
the cell where a transient voltage is recorded as a peak with height proportional to the iodide concentration in the sample. The type, concentration, flow rate and pH of the carrier solution, and sample (loop) volume were adjusted in order to optimize the system response.
123.5 mV
PP S
Waste RE
ME
CE
P R
CS
H2O
FC IV
Figure 1. Flow-injection manifold for the determination of iodide. CS, carrier solution (0.01 M Na2SO4, pH 6); PP, peristaltic pump; IV, injection valve; S, sample; FC, flow-through cell; ME,
membrane electrode; CE, counter electrode; RE, reference electrode (Ag/AgCl double junction); P, potentiometer; R, x-y recorder
3. RESULTS AND DISCUSSION
Ion sensors with high selectivity, high sensitivity, wide dynamic range and fast response are highly desirable for flow-injection analysis applications. One approach toward simple, cheap and reliable detector for this purpose is to prepare the potentiometric sensors. Our previous investigation on the use of mercury complexes for construction of ion selective sensors [41] indicated the suitability of these complexes for iodide detection. Mercury complexes such as Hg(CTP)2 demonstrated high
selectivity towards iodide. High selectivity is characteristic of recognition element in metal-ligand interactions. Therefore, we were prompted to use Hg(CTP)2 for the preparation of a solid sensor in FIP
determination of iodide ion.
3.1. Effect of type and concentration of the carrier solution
Several electrolytes were examined as the carrier solution, including potassium chloride, potassium nitrate, sodium acetate, sodium citrate, potassium dihydrogen phosphate and sodium sulfate. Among these, sodium sulfate was found to provide the best analytical performance with respect to linear dynamic range, detection limit, reproducibility and response time of the FIP sensor.
[image:4.612.167.476.131.280.2]The effect of concentration of Na2SO4 carrier solution on the potentiometric response of the
FIP system was investigated in the range 5×10⁻³-1×10⁻¹ M. Three different concentrations of iodide
were injected for each carrier concentration and the FIP responses recorded. Maximum sensitivity and lowest response time was observed with 1.0×10⁻² M Na
2SO4 solution. Therefore, this was used for
further investigations.
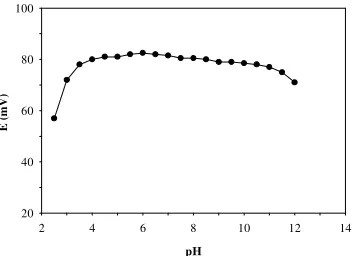
3.2. Effect of pH
The pH dependence of the FIP response was tested by injecting 100 µL of 1.0×10⁻⁴ M iodide
into the carrier solution with different pH in the range 2.5-12 (Fig. 2). The pH of 0.01 M Na2SO4
solution was adjusted by addition of dilute sulfuric acid or sodium hydroxide solution as appropriate. The response profile does not show a considerable difference in the observed potential over the pH range 3.5-11, which makes the proposed FIP system applicable to a wide variety of samples.
pH
2 4 6 8 10 12 14
E
(m
V
)
20 40 60 80 100
Figure 2. The influence of pH of the carrier solution on the FIP response obtained by injecting 100 µL of 1×10⁻⁴ M potassium iodide solution.
3.3. Effect of flow rate
An increase in peak height as well as a decrease in peak width was observed when the flow rate of the carrier, 0.01 M Na2SO4 solution of pH 6.0, was increased from 0.25 to 1.0 mL min-1. The peak
height is decreased and the reproducibility of the signal is deteriorated beyond carrier flow rates of 1.0 mL min−1. A flow rate of 1.0 mL min-1 was chosen for further experiments, which allows analysis of 40 to 120 samples h-1 depending on the iodide concentration.
3.4. Injection volume study
[image:5.612.218.395.290.418.2]3.5. Selectivity of the electrode in FIP system
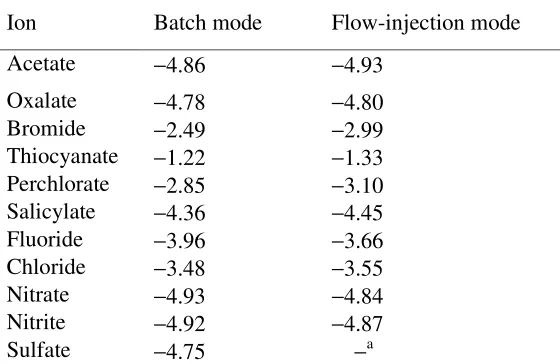
The selectivity coefficients of the sensor system in the FIP mode were obtained by the separate solution method using 1.0×10⁻³ M iodide and the interfering ions. The selectivity coefficients obtained in the FIP mode are presented in Table 1, together with values obtained in the batch mode. The results indicate that the measuring system is highly selective towards iodide with respect to several anions that may be found together with iodide in real samples, such as acetate, oxalate, bromide, perchlorate, salicyalte, fluoride, chloride, nitrate and nitrite. Thiocyanate, log pot
SCN I−, −
K = -1.33, may show some interference in the determination if it is present at high concentration relative to iodide. The selectivities in the FIP mode are comparable to and in some instances better than those in the batch mode. This may be related in part to the transient nature of the signal in the FIP mode; i.e., the selectivities depend also on the relative response time of the electrode for different anions [37,38].
Table 1. Potentiometric selectivity coefficients, log pot J , I
-K , for iodide in batch and flow-injection modes obtained by the separate solution method using 1×10⁻³ M iodide and interfering anions.
Flow-injection mode Batch mode Ion −4.93 −4.86 Acetate −4.80 −4.78 Oxalate −2.99 −2.49 Bromide −1.33 −1.22 Thiocyanate −3.10 −2.85 Perchlorate −4.45 −4.36 Salicylate −3.66 −3.96 Fluoride −3.55 −3.48 Chloride −4.84 −4.93 Nitrate −4.87 −4.92 Nitrite −a −4.75 Sulfate
a Sulfate was the carrier solution in the flow-injection mode
High selectivity of the sensor toward iodide can be related to the selective interaction of this anion with mercury atom in the Hg(CTP)2 complex. This is certified by the very low tendency of the
sensor towards chloride, bromide, and highly lipophilic anions such as perchlorate, salicylate, nitrate, and nitrite, and to some extent thiocyanate. In other words, high selectivity toward iodide with respect to these anions (logKIpot−,J−= -3.55, chloride; -2.99, bromide; -3.10, perchlorate; -4.45, salicylate; -4.84,
nitrate; -4.87, nitrite; -1.33, thiocyanate;) is indicative of the relatively strong and selective interaction of iodide as a soft anion and mercury in the complex as a soft metal center.
3.6. Analytical characteristics
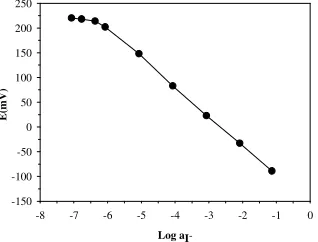
[image:6.612.166.446.323.505.2]proven from the calibration plot obtained under the optimized conditions presented in Table 2. The calibration plot was linear over the concentration range 1.0×10⁻⁶-1.0×10⁻¹ M with a slope of -58.2±0.8
per decade of iodide concentration and a correlation coefficient, r, of 0.9995 (n=6), Fig. 4. The linear range in terms of iodide activity was 1.0×10⁻⁶-7.6×10⁻² M with a slope of 59.4±0.8 and r of 0.9996.
[image:7.612.223.354.158.349.2]The detection limit of the sensor in the FIP system was ∼5×10⁻⁷ M iodide.
Figure 3. Recorder trace of FIP responses obtained at the optimum conditions by injecting 100 µL of iodide into the carrier solution at pH 6 and flow rate of 1 mL min-1; (a) 1.0×10⁻⁶, (b) 1.0×10⁻⁵, (c)
1.0×10⁻⁴, (d) 1.0×10⁻³, (e) 1.0×10⁻² and (f) 1.0×10⁻¹ M I-.
Log aI
--8 -7 -6 -5 -4 -3 -2 -1 0
E
(m
V
)
-150 -100 -50 0 50 100 150 200 250
Figure 4. Calibration plot of FIP response vs. iodide activity. Conditions are given in Table 2.
The reproducibility of the measurement was obtained from ten repeated injections of 1.0×10⁻⁵ M and 1.0×10⁻⁴ M iodide solutions. The relative standard deviations were calculated to be 0.8% and 0.6%, respectively. The response time of the sensor in the batch mode is ≤ 5 s. The transient (baseline to baseline) time of the FIP signal, is 30 to 90 s, depending on the concentration of iodide in solution. The electrode is highly stable and no significant change in its response characteristics was observed during 1 month of continuous use. This can be in part related to insolubility of the carrier in aqueous solutions.
[image:7.612.227.386.420.541.2]sample was determined by the proposed FIP method using standard addition method and the results were compared with those obtained by potentiometric titration of the sample with standard silver nitrate solution using silver indicator electrode in conjunction with a double junction Ag/AgCl reference electrode. The results obtained by the FIP method, (4.0 ± 0.3) × 10-3 M, were in close
agreement with the potentiometric titration results (3.8 ± 0.2) × 10-3 M (t
calc = 1.38, n = 5, t0.05,4 =
2.78).
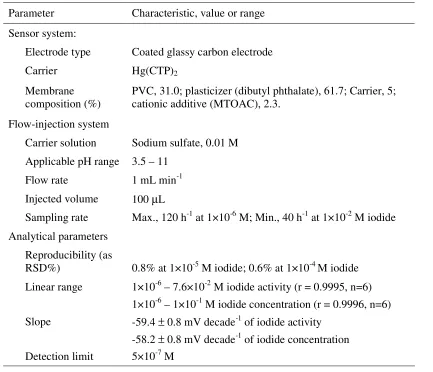
Table 2. Characteristics and response properties of the FIP system used for the determination of iodide ion.
Characteristic, value or range Parameter
Sensor system:
Coated glassy carbon electrode Electrode type
Hg(CTP)2
Carrier
PVC, 31.0; plasticizer (dibutyl phthalate), 61.7; Carrier, 5; cationic additive (MTOAC), 2.3.
Membrane composition (%) Flow-injection system
Sodium sulfate, 0.01 M Carrier solution
3.5 – 11 Applicable pH range
1 mL min-1 Flow rate
100 µL Injected volume
Max., 120 h-1 at 1×10⁻⁶ M; Min., 40 h-1 at 1×10⁻² M iodide Sampling rate
Analytical parameters
0.8% at 1×10⁻⁵ M iodide; 0.6% at 1×10⁻⁴ M iodide Reproducibility (as
RSD%)
1×10⁻⁶ – 7.6×10⁻² M iodide activity (r = 0.9995, n=6) Linear range
1×10⁻⁶ – 1×10⁻¹ M iodide concentration (r = 0.9996, n=6) -59.4 ± 0.8 mV decade-1 of iodide activity
Slope
-58.2 ± 0.8 mV decade-1 of iodide concentration 5×10⁻⁷ M
Detection limit
4. CONCLUSIONS
The results of this study demonstrate suitability of the iodide selective sensor based on Hg(CTP)2 carrier for the flow-injection potentiometric detection of iodide. The proposed system
[image:8.612.97.530.212.584.2]throughput rate and ease of operation and maintenance of the FI method make the proposed FIP system promising for the analysis of iodide in a wide variety of samples and allow very fast and cheap methods to be developed.
ACKNOWLEDGEMENT
The authors gratefully acknowledge the support of this work by the Center of Excellence of Chemistry (Catalyst and Fuel Cell Division) and Office of Graduate Studies of the University of Isfahan.
References
1. N. N. Greenwood, and A. Eamshaw, “Chemistry of the Elements”, Pergamon Press, Oxford, (1984).
2. Z. Xie, and J. Zhao, Talanta, 63 (2004) 339
3. L. Tian, L. Liu, L. Chen, N. Lu, and H. Xu, Talanta, 66 (2005) 130
4. S. D. Nikolic, J. J. Mutic, A. D. Lolic, and D. D. Manojlovic, Anal. Sci., 21 (2005) 525 5. T. Fujiwara, I. U. Mohammadzai, H. Inoue, and T. Kumamaru, Analyst, 125 (2000) 759
6. D. Nacapricha, K. Ratanawimarnwong, and K. Grudpan, Anal. Bioanal. Chem., 378 (2004) 816 7. N. Ratanawimarnwong, N. Amornthammarong, N. Choengchan, P. Chaisuwan, M. Amatatongchai,
P. Wilairat, I. D. McKelvie, and D. Nacapricha, Talanta, 65 (2005) 756 8. O. Haase, and J. A. C. Broekaert, Spectrochim. Acta B, 57 (2002) 157 9. A. Kamavisdar, and R. M. Patel, Microchim. Acta, 140 (2002) 119 10.H. B. Li, F. Chen, and X. R. Xu, J. Chromatogr. A 918 (2001) 335
11.W. Hu, P. J. Yang, K. Hasebe, P. R. Haddad, and K. Tanaka, J. Chromatogr. A, 956 (2002) 103 12.K. Ito, T. Ichihara, H. Zhuo, K. Kumamoto, A. R. Timerbaev, and T. Hirokawa, Anal. Chim. Acta,
497 (2003) 67
13.H. S. Shin, Y. S. Oh-shin, J. H. Kim, and J. K. Ryu, J. Chromatogr. A, 732 (1996) 327 14.L. F. Sanchez, and J. Szpunar, J. Anal. At. Spectrom., 14 (1999) 1697
15.K. Krengel-Rothensee, U. Richter, and P. Heitland, J. Anal. At. Spectrom., 14 (1999) 699 16.M. P. Arena, M. D. Porter, and J. S. Fritz, Anal. Chem., 74 (2002) 185
17.X. Hou, H. Dahlgaard, B. Rietz, U. Jacobsen, S. P. Nielsen, and A. Aarkrog, Anal. Chem., 71 (1999) 2745
18.T. Yoshinaga, T. Shirakata, H. Dohtsu, H. Hiratsuka, M. Hasegawa, M. Kobayashi, and T. Hoshi, Anal. Sci., 17 (2001) 333
19.N. Choengchan, K. Uraisin, K. Choden, W. Veerasai, K. Grudpan, and D. Nacapricha, Talanta, 58 (2002) 1195
20.L. J. Li, H. Cheng, W. Y. Huang, H. X. Kong , J. L. Wu, J. P. Lu, W. Gao, and J. F. Song, Chinese Chem. Lett., 16 (2005) 1629
21.G. A. Milovanovic, F. T. Pastor, G. M. Petkovic, and M. Todorovic, Microchim. Acta, 144 (2004) 51
22.N. Choengchan, K. Lukkanakul, N. Ratanawimarnwong, W. Waiyawat, P. Wilairat, and D. Nacapricha, Anal. Chim. Acta, 499 (2003) 115
23.T. Tomiyasy, M. Nonaka, M. Uchikado, K. Anazawa, and H. Sakamoto, Anal. Sci., 20 (2004) 391 24.M. C. Yebra, and R. M. Cespón, Fresenius J. Anal. Chem., 367 (2000) 24
25.M. C. Yebra, and R. M. Cespon, Anal. Chim. Acta, 405 (2000) 191 26.Q. He, J. Fei, and S. Hu, Anal. Sci., 19 (2003) 681
27.F. M. Najib, and S. Othman, Talanta, 39 (1992) 1259
29.D. E. Davey, D. E. Mulcahy, and G. R. O'Connell, Analyst, 117 (1992) 761 30.P. Schnierle, T. Kappes, and P. C. Hauser, Anal. Chem., 70 (1998) 3585 31.D. E. Davey, D. E. Mulcahy, and G. R. O' Connell, Talanta, 37 (1990) 313
32.C. Sanchez-Pedreno, J. A. Ortuno, and M. C. Lopez, Anal. Chim. Acta, 315 (1995) 63 33.S. S. Badawy, A. F. Youssef, and A. A. Mutair, Anal. Chim. Acta, 511 (2004) 207
34.Y. M. Issa, M. T. Abdel-Ghani, A. F. Shoukry, and H. M. Ahmed, Anal. Sci., 21 (2005) 1037 35.H. Karami, M. F. Mousavi, and M. Shamsipur, Talanta, 60 (2003) 775
36.L. T. Dimitrakopoulos, and T. Dimitrakopoulos, Electroanalysis, 13 (2001) 161 37.K. Cammann, Fresenius J. Anal. Chem., 329 (1988) 691
38.P. W. Alexander, T. Dimitrakopoulos, and D. B. Hibbert, Electroanalysis, 10 (1998) 707
39.N. Ueyama, K. Taniuchi, T. Okamura, A. Nakamura, H. Maeda, and S. Emura, Inorg. Chem., 35 (1996) 1945
40.M. Ying, R. Yuan, X. M. Zhang, Y. Q. Song, Z. Q. Li, G. L. Shen, and R. Q. Yu, Analyst, 122 (1997) 1143
41.M. K. Amini, M. Ghaedi, A. Rafi, M. H. Habibi, and M. M. Zohory, Sensors, 3 (2003) 509
42.U. Lemke, K. Cammann, C. Kotter, C. Sundermeier, and M. Knoll, Sensors and Actuators B, 7 (1992) 488
43.J. Slanina, W. A. Lingerak, and F. Bakker, Anal. Chim. Acta, 117 (1980) 91