R E S E A R C H A R T I C L E
Open Access
Effect of positional dependence and
alignment strategy on modeling transcription
factor binding sites
Saad Quader and Chun-Hsi Huang
*Abstract
Background: Many consensus-based and Position Weight Matrix-based methods for recognizingtranscription factor binding sites(TFBS) are not well suited to the variability in the lengths of binding sites. Besides, many methods discard known binding sites while building the model. Moreover, the impact ofInformation Content(IC) and the positional dependence of nucleotides within an aligned set of TFBS has not been well researched for modeling variable-length binding sites. In this paper, we proposeML-Consensus(Mixed-Length Consensus): a consensus model for
variable-length TFBS which does not exclude any reported binding sites.
Methods: We considerPairwise Score(PS) as a measure of positional dependence of nucleotides within an alignment of TFBS. We investigate how the prediction accuracy of ML-Consensus is affected by the incorporation of IC and PS with a particular binding site alignment strategy. We perform cross-validations for datasets of six species from the TRANSFAC public database, and analyze the results using ROC curves and the Wilcoxon matched-pair signed-ranks test.
Results: We observe that the incorporation of IC and PS in ML-Consensus results in statistically significant improvement in the prediction accuracy of the model. Moreover, the existence of a core region among the known binding sites (of any length) is witnessed by the pairwise coexistence of nucleotides within the core length. Conclusions: These observations suggest the possibility of an efficient multiple sequence alignment algorithm for aligning TFBS, accommodating known binding sites of any length, for optimal (or near-optimal) TFBS prediction. However, designing such an algorithm is a matter of further investigation.
Background
Transcription factors (TF) are proteins that bind to spe-cific locations of DNA (referred to asbinding sites, BS) and facilitate/repress the transcription process. In many cases binding sites of a transcription factor contain a common nucleotide pattern [1]. DNA motif-finding algo-rithms use various models to represent this pattern [1]. One of these models is theconsensus, a sequence repre-sentation derived from a multiple sequence alignment of binding sites [2,3]. The consensus sequence retains only the most conserved base at any position, resulting in loss of information about other bases at that position. Posi-tion weight matrix (PWM), also known as probabilistic
*Correspondence: [email protected]
Department of Computer Science & Engineering, University of Connecticut, 371 Fairfield Road, Unit 2155, Storrs, Connecticut 06269-2155, USA
sequence model or scoring matrix, is another represen-tation model which records frequency (or probability) of every base at each position of the multiple sequence alignment [1,4,5]. The survey by Das and Dai provides a classification of DNA motif-finding methods based on different representation models [6].
Both basic consensus-based and PWM-based methods need equal-length sequences. Although this is acceptable for cases where there is no variability in lengths of binding sites (e.g., the bacterial dataset described in [7]), there are other datasets where TFBS show remarkable variability in lengths (e.g., datasets described in Section Input, train-ing, and testing). In order to circumvent this variability, variants of these methods apply constraints and assump-tions on the nature of binding sites. For example, only fixed-length sites are considered, or only sites containing
a fixed-length subsequence are considered [8]. It is not confirmed, however, whether the protein-DNA binding mechanism indeed follows such constraints. Therefore it is necessary to modify these models for allowing vari-ability in TFBS lengths. Some studies described such a PWM-based model that allows gaps in the PWM and thus accommodates variable-length binding sites [9].
There are models which can accommodate binding sites of different lengths. A widely used TFBS prediction pro-gram is the PMATCH, which uses Gibbs sampling [10] to align binding sites of different lengths [11]. However, PMATCH excludes some documented binding sites based on constraints on the lengths of the sites, and imposes a constraint on the the core region; it defines the core region as the five most conserved positions within the alignment [11].
Models that involve a matrix representation (PWM/ consensus) must make a multiple sequence alignment from the known binding sites. Therefore, the multiple sequence alignment algorithm associated with such a model will influence its performance because the align-ment (and therefore, the scoring matrix or consensus) generated by different algorithms will be different. An excellent survey of multiple sequence alignment algo-rithms can be found in [12]. On the other hand, the TFBS prediction algorithm SiTaR does not align input sequences at all [13]. By not aligning, SiTaR avoids many uncertainties arising from the generalizations made by multiple sequence alignment.
Basic consensus-based and PWM-based models assume that positions in a binding site are independent. How-ever, some biological studies suggest that positions in a binding site are correlated [14,15]. Several computational models for this correlation have been proposed [16,17]. Some studies describedpairwise score(PS), a method that computes interdependence of any two positions that are located within a fixed distance from one another in a bind-ing site [18]. This distance is called thescopeof PS. It has been shown that the addition of PS to basic consensus-based and PWM-consensus-based models results in statistically sig-nificant improvement in performance [18]. However, pair-wise correlation is not the same as the statistical measure “correlation”; rather, it is a measure of co-occurrence of bases within a given proximity (i.e., scope). The math-ematical definition of pairwise score can be found in Section Scoring function with pairwise score (PS).
Information content(IC) of an alignment of binding sites is a measure of conservation of any base at any given posi-tion in that alignment. It has been shown that the addiposi-tion of IC in basic consensus-based and PWM-based models results in statistically significant improvement in perfor-mance [18]. However, these results regarding PS and IC were demonstrated on a dataset that does not have any variability in the lengths of binding sites for a TF [7].
Our research
In this paper, we define a consensus model (Mixed-length Consensus or ML-Consensus) for recognizing variable-length TFBS. Our model does not exclude any known/ reported binding site while building the model for a set of TFBS. Moreover, ML-Consensus does not make any assumption on the lengths of binding sites or on the length/composition of the core region. However, it assumes that there exists one core region for a set of TFBS, the core region is present, in part or whole, in every bind-ing site. This assumption is used in constructbind-ing the na¨ıve multiple alignment algorithm associated with this model (described later in this section).
Our input data covers six species from the TRANSFAC public database [19]. We study the effect of pairwise cor-relation of nucleotides, information content, and multiple sequence alignment strategy on the prediction accuracy of our model.
If each binding site of any given TF has the same length (e.g., theE. coli dataset in [7]), it is trivial to align them and get the consensus or scoring matrix. Otherwise, one needs to make a multiple sequence alignment from those sequences in order to derive a scoring matrix or a con-sensus. TFBS prediction tools employ various methods for aligning binding sites [6]. All other things remaining the same, effectiveness of two multiple sequence alignment algorithms for aligning TFBS can be evaluated by com-paring the performance of a TFBS prediction model using those two alignment strategies.
produced by these two algorithms from the same input sequences.
Pairwise score (PS) is a measure of the dependence of nucleotides at two positions that are situated within a given distance in an alignment of TFBS. Whereas other studies (e.g., [18]) have discussed effect of PS on consen-sus/matrix-based TFBS models for fixed-length binding sites, we study the effect of PS on ML-Consensus, a model for variable-length binding sites. Specifically, we perform experiments with different PS scopes to find whether there is any regularity with which a change in PS scope affects the performance of ML-Consensus. We consider the following choices for PS: no PS, PS scopes 1–10, and a large scope value that covers the entire overlap between a test sequence and the consensus while scoring that sequence against the consensus.
As mentioned earlier, ML-Consensus has three configu-ration variables: pairwise score, information content, and multiple sequence alignment strategy. We construct one experiment-configuration for each combination of vari-ables (e.g., ClustalW2 alignment using IC and PS scope 2, etc.). We conduct leave-one-out cross-validation scheme for training/testing our model on TFBS data for six species extracted from TRANSFAC public database [19]. We used ROC curves and the Wilcoxon matched-pair signed-ranks test for statistical evaluation of the performance data.
Our results show that the adoption of IC or PS in the scoring function of ML-Consensus results in significant improvement in performance. Moreover, a large PS scope (e.g., the full scope) does not produce the best perfor-mance for a given configuration; perforperfor-mance decreases after PS scope is larger than a certain value. Not only is this observation counterintuitive, but it also provides a way to estimate the core length. Our results also sug-gest that it is possible to design a TFBS-specific multiple sequence alignment algorithm that will perform better than general-purpose algorithms by means of utilizing prior information and assumptions about TFBS. However, we do not present such an algorithm yet since it is subject to further investigation.
[image:3.595.58.291.645.730.2]The main contributions of this paper are the follow-ing: (1) We describe a new model for TFBS prediction
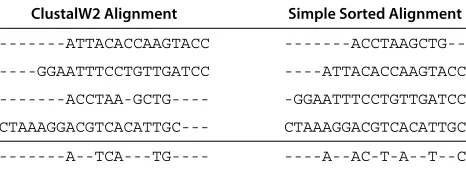
Table 1 Consensus derived from binding sites aligned using ClustalW2 (left) and simple sorted (right) multiple sequence alignment algorithms
ClustalW2 Alignment Simple Sorted Alignment
---ATTACACCAAGTACC
---ACCTAAGCTG---GGAATTTCCTGTTGATCC ----ATTACACCAAGTACC
---ACCTAA-GCTG---- -GGAATTTCCTGTTGATCC
CTAAAGGACGTCACATTGC--- CTAAAGGACGTCACATTGC
---A--TCA---TG---- ----A--AC-T-A--T--C
which accommodates all known binding sites of different lengths. (2) We show that incorporating information con-tent and pairwise correlation into scoring function for this model improves the prediction accuracy. (3) We study the effect of different PS scopes on the prediction accuracy of this model. (4) We show that it is possible to estimate the length of the core region in a set of TFBS, and (5) We show that it is possible to design a multiple sequence align-ment algorithm which will do better than general-purpose algorithms while aligning TFBS.
Results and discussion
In the following discussionAUCrefers to the area under ROC curve. A configuration is an experiment with any particular settings for IC, PS scope, and alignment strat-egy. AUC of a configuration is taken as a measure of its performance (i.e., prediction accuracy). However, when comparing performances of two configurations, the statis-tical significance of difference in performance is consid-ered. If significant, the event is mentioned asconfiguration A performs better than configuration B. Otherwise, it is mentioned asthe two configurations are equivalent. For a given configuration,peak in its AUCdenotes the PS scope value which, among all scopes, produces the highest AUC for that configuration. The phrasesna¨ıve alignment, sim-ple sorting-based alignment andsimple-sorted alignment all refer to our heuristic, sorting-based, multiple sequence alignment algorithm presented in Appendix A: The na¨ıve sorting-based multiple sequence alignment algorithm.
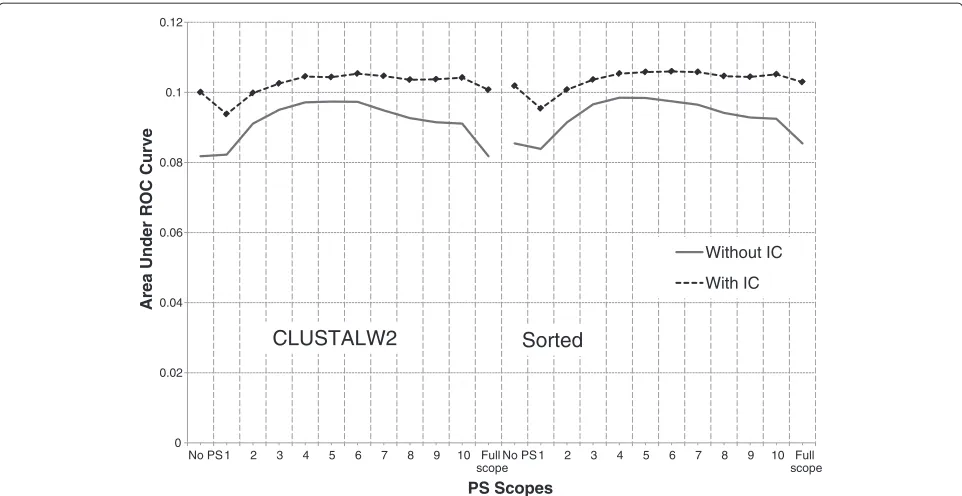
Some adjacent PS scopes produce significantly better performance than other scopes
By definition (see Section Scoring function with pair-wise score (PS)), all information gathered in a smaller PS scope are retained in a larger PS scope. However, Figure 1 and Figure 2 show that the performance of a configura-tion starts to decrease when PS scope grows larger than a certain value. The location of the peak (i.e., the PS scope which produces the highest area under ROC curve) for a configuration varies in different species. Figure 2 depicts whether the change in performance between suc-cessive PS scopes is statistically significant. We observe that there is always a range of PS scopes where per-formance, after initially increasing significantly, does not change significantly with a change in PS scope. After this range, however, performance decreases significantly. We call this range of PS scopes asignificance plateau.
0 0.02 0.04 0.06 0.08 0.1 0.12
No PS 1 2 3 4 5 6 7 8 9 10 Full scope
No PS 1 2 3 4 5 6 7 8 9 10 Full scope
Ar
ea Under
ROC
Cur
v
e
PS Scopes
Without IC
With IC
[image:4.595.57.538.86.334.2]CLUSTALW2 Sorted
Figure 1Effect of IC on alignment and PS (H. sapiens).There are two regions: ClustalW2 (left) and simple sorting-based algorithm (right). In each region, PS scopes are placed in x-axis, from left to right, in the following order: no PS, scopes 1–10, and full scope. Between the two configurations (one using IC, and the other without IC), if one performs significantly better than the other at any PS scope, it is marked with a diamond.
the probability that the known negative example would score higher than the known positive example — produc-ing a false positive. PS scopes larger than a certain value do not capture any new position-pair matches, yet continue picking up noise. This is why we observe a decrease in performance of a configuration with increase in PS scopes beyond a certain value. This scope indicates the maximum distance within which two positions in an aligned set of TFBS are correlated. In an alignment, only positions that form the core region will be correlated. Therefore the core region (for the sites in the alignment) should be at most as long as this scope value. However, this scope value is found by running a given experiment-configuration over all sets of TFBS for a given species, and therefore it is asso-ciated with the overall TFBS dataset for the species and not with any particular set of TFBS. Additionally, different experiment-configurations produce possibly different sig-nificance plateaus for any given species dataset. Therefore, the location of the plateau depends on which experiment-configuration is in use. Our suggestion is that for a given species, we should choose the experiment-configuration that produces highest area under its ROC curves across all PS scopes, thus having the highest discriminatory power.
ClustalW2 does not perform as expected
We perform the Wilcoxon matched-pair signed-ranks test in order to determine whether ClustalW2 performs sig-nificantly better than the na¨ıve alignment algorithm. Since
ClustalW2 is a sophisticated algorithm, the null hypoth-esis is that ClustalW2 should performsignificantly better (withp<=0.05) than simple sorted alignment algorithm in all combinations of other variables. However, if the difference in performance is found insignificant it should be considered as an evidence against the null hypothesis. We divide all configurations into pairs (based on align-ment strategy), and then compute statistical significance of difference in performance of the two configurations in each pair. Table 2 shows the statistical significance of the difference in performance of configurations using different alignment algorithms according to the null hypothesis mentioned above. It can be seen that the null hypothesis does not hold true in four out of six species withp<=0.01. This means ClustalW2 does not perform significantly better than na¨ıve sorting-based alignment strategy in all experiments.
0 0.02 0.04 0.06 0.08 0.1 0.12
No PS 1 2 3 4 5 6 7 8 9 10 Full
scope
A
rea Under
ROC
Cur
v
es
PS Scopes
Sorted alignment, with IC (peak: 7)
ClustalW2, with IC (peak: 7)
Sorted alignment, without IC (peak: 5)
[image:5.595.58.540.85.351.2]ClustalW2, without IC (peak: 6)
Figure 2Performance of all configurations inH. sapiens.If a PS scope produces significantly better performance than that produced by its previous scopeandis followed by a scope where the performance does not change significantly, it is marked with a diamond (the start of the significance plateau). After this point, if the performance does not change significantly in subsequent scopes, data points are still marked with a diamond (continuation of the plateau). A round marker denotes the highest AUC in a configuration. A large diamond indicates that the scope producing this peak in AUC is inside the significance plateau.
made by the na¨ıve alignment algorithm is that there is a core region contained by all binding sites. In addition, an example of prior information about TFBS is the core length suggested by the PS scopes in significance plateau. However, the relationship between the core length and the significance plateau is not known yet.
[image:5.595.58.293.615.731.2]Performance of configurations using the same align-ment algorithm varies across different species. Figure 3 shows that simple sorted alignment performs better than ClustalW2 inM. musculus. On the other hand, Figure 4 shows that ClustalW2 performs better than na¨ıve sorting-based algorithm in R. norvegicus. Although we do not
Table 2 Comparison between ClustalW2 and simple sorted alignment strategies in all configurations
Species ClustalW2 Superior Z p≤
% Cases Alignment
D. melanogaster 0.980 ClustalW2 5.78 0.01
G. gallus 0.000 Simple sorted 6.03 0.01
H. sapiens 0.540 None 0.50 –
M. musculus 0.060 Simple sorted 5.28 0.01
R. norvegicus 1.000 ClustalW2 6.03 0.01
S. cerevisiae 0.125 Simple sorted 4.53 0.01
know why this happens, our hypothesis is that it may be due to the differences in the composition of binding sites (i.e., number and lengths of binding sites, the nature of the core region, etc.) for each species. This observation requires further investigation.
Both IC and PS lead to improved performance
The addition of IC to a configuration without IC always improves its performance. However, the improvement is more prominent for larger scopes which can be seen in Figure 1 and Figure 2. In these figures, AUC of con-figurations without IC drops quickly at large PS scopes. However, curves for configurations with IC tend to be more flat at large PS scopes. Similarly, addition of PS (with appropriate scope value) to configurations without PS results in improved performance. These observations are in accordance with the observations made by [18] regard-ing influence of IC and PS on models for fixed-length binding sites.
Conclusions and future works
Figure 3Effect of alignment on IC and PS (M. musculus).A diamond marker indicates where a configuration performs significantly better than the other in the same PS scope.
site are correlated. However, the statistical correlation of nucleotides in a set of binding sites is out of the scope of this research, and is a matter of future work. We also show that in most cases, configurations that use ClustalW2 as alignment algorithm do not perform significantly better than configurations that use a na¨ıve sorting-based heuris-tic alignment algorithm. It suggests that it is possible to improve the na¨ıve algorithm into a TFBS-specific mul-tiple sequence alignment algorithm (using information/ assumptions about TFBS) which would perform better than general-purpose multiple sequence alignment algo-rithms. However, designing such an algorithm is another direction of future investigation. Lastly, although we use a consensus model, our approach and methods can be extended to a PWM-based model for variable-length binding sites.
Methods
In this section, we start with presenting the mathemati-cal definition of the ML-Consensus model and its various parts. Next we describe how we collected and processed the input data to build training and testing datasets. Then we describe how we made statistical evaluation of the experiments through ROC curves and Wilcoxon matched-pair signed-ranks test.
Model definition
The ML-Consensus model has the following parts: (1) Building a multiple sequence alignment from a given set of binding sites, (2) Generating the consensus sequence from this alignment, (3) A basic scoring function which compares a given DNA sequence with this consensus and tells how close they are; this scoring function can be mod-ified to incorporate information content (IC) and pairwise score (PS).
Building a consensus
LetS be the set ofN binding sites for a particular tran-scription factor. LetAbe a multiple sequence alignment ofSwith width ofM. A gap in alignments inAis denoted by ‘-’.
Letnj(b)be the number of times baseb ∈ {A, C, G, T} appears atj-th position ofA. Letfj(b) = nj(b)/Nbe the corresponding frequency. Similarly, letn(b)be the num-ber of times basebappears overall inA, andf(b)be the overall frequency for basebinA.
0 0.02 0.04 0.06 0.08 0.1 0.12
No PS 1 2 3 4 5 6 7 8 9 10 Full scope
No PS 1 2 3 4 5 6 7 8 9 10 Full scope
Ar
ea Under
ROC
Cur
v
e
PS Scopes
clustalw2 sorted
[image:7.595.59.539.87.339.2]Without IC
With IC
Figure 4Effect of alignment on IC and PS (R. norvegicus).A diamond marker indicates where a configuration performs significantly better than the other in the same PS scope.
Cjis computed as follows. For each positionjofA,
• Iffj(b) >0.5for baseb∈ {A, C, G, T}, setCj=b.
• Otherwise, iffj(b)+fj(d) >0.75for any two bases
b,d∈ {A, C, G, T}, setCj=amb(b,d).
• Otherwise, setCj=‘-’, the gap character.
Table 1 shows how to derive a consensus from two different sequence alignments produced by two different alignment algorithms. Computing fj(b) for all j,b takes O(NM)time.
Scoring function
Lettbe a putative binding site. Lettjbe thej-th base oft. To compute the score oftwith respect to consensusC, we used a sliding window approach wheret is shifted along C, from left to right. At each point of shifting there is an overlap betweentandC. For each overlap wletCw,i be the base in consensus corresponding to thei-th position inw. Definetw,iin similar way. For each overlapwwe com-putedσ (t,C,w), the score oftat that particular overlap;
Table 3 Ambiguity codes used in consensus for a pair of nucleotides
b A A A C C G
d C G T G T T
amb(b,d) I J K L M N
this score is equal to the number of matches betweentand Catw:
σ (t,C,w)= i∈w
Match(w,i), (1)
where
Match(w,i)= ⎧ ⎨ ⎩
1 :Cw,i=tw,i
1 :Cw,i=amb(tw,i,∗) 0 :otherwise
. (2)
ComputingMatch(w,i) takes O(1) time, and comput-ingσ (t,C,w)takesO(M)since size ofwisO(M). Finally, the score of t with respect toC is the maximum score obtained in all overlaps, which takesO(M2) since there can be at mostO(M)overlaps.
σ (t,C)=max
w (σ (t,C,w)) . (3)
Scoring function with information content (IC)
[image:7.595.57.290.685.731.2]that position is small; thus the information content at that position is low. The IC at positionjof the alignment matrixAis defined as:
IC(A,j)=2+ b∈{A,C,G,T}
fj(b)logfj(b), (4)
where the termfj(b)logfj(b)becomes zero wheneverfj(b) becomes zero, thus avoiding evaluation of log 0.IC(A,j) for alljcan be computed inO(M)time. LetA(w,i)be the position inAthat corresponds to thei-th position in w. When IC is used in scoring, the scoring function for the overlap becomes:
σIC(t,C,w)=
i∈w
Match(w,i)·IC(A,A(w,i)). (5)
This takesO(M)time whenIC(A,j)are pre-computed.
Scoring function with pairwise score (PS)
Pairwise score is a measure of interdependence among positions in a binding site with respect to the consensus [18]. Two different positions in an overlapw are corre-lated if there are matches in both positions. In overlapw, let positionsiandi+kbe separated bykpositions. The match-score for this position-pair, MatchPair(w,i,k), is defined as follows:
MatchPair(w,i,k)= ⎧ ⎪ ⎪ ⎨ ⎪ ⎪ ⎩
2 :Match(w,i)=1 and
Match(w,i+k)=1 0 :otherwise
(6)
This takesO(1)time.
Let K be the maximum distance considered between any two positions, and|w|be the length of the overlap.K is called the scope of PS. The pairwise score oftat overlap w,σPS(t,C,w), is defined as the total number of
position-pair matches for all positions situated within the scope of PS.
σPS(t,C,w)=
K
s=1
|w|−s
i=1
s
k=1
MatchPair(w,i,k) (7)
This operation takes O(MK2) time. Score at any PS
scope contains all matches from all smaller scopes along with new matches at the said scope. Thus it does not lose any information about position-matches gathered in previous scopes.
Scoring function with both information content and pairwise score
At any overlap w, let nij(b,d) be the number of times two bases b and d appear together at positions i and
j, respectively. Let fij(b,d) = nij(b,d)/N be the corre-sponding frequency. Then, IC of position-pair(i,j)in the alignment matrixAis defined as follows:
ICpair(A,i,j)=4+
b,d∈{A,C,G,T}
fij(b,d)logfij(b,d) (8)
Computing fij(b,d) for all i,j,b,d takes O(M2) time. After that, computingICpair(A,i,j)for alli,jtakesO(M2)
time.
LetA(w,i)be the position inAthat corresponds to the i-th position in w. Let ICpair(w,i,k) be the information
content of the position-pair(i,i+k)inw, which is defined as follows:
ICpair(w,i,k)=ICpair(A,A(w,i),A(w,i+k)) (9)
Finally, the score oftat overlapwis defined as follows:
σICPS(t,C,w)= K
s=1
|w|−s
i=1
s
k=1
MatchPair(w,i,k)
× ·ICpair(w,i,k). (10)
This takesO(K2M)time because allIC
pair(A,i,j)values
are already computed for alli,j.
Experiment design
We studied the effect of three variables on the perfor-mance of ML-Consensus: multiple sequence alignment strategy, IC, and PS. The alignment algorithm can be either ClustalW2 or simple sorted alignment algorithm. There are two choices for IC: either using IC, or not using IC. However, PS can have twelve possible values: not using PS; PS scopes 1–10; and lastly full PS scope, which means the scope spans the entire overlap between a putative site and the consensus. Therefore, there are 2×2×12=48 possible experiment-configurations, one for each combi-nation of the three variables. Each of these configurations was trained and tested using the same input, training, and testing data.
Input, training, and testing
Table 4 Statistics of input TFBS data
Species TF BS Average Standard
BS length Deviation
D. melanogaster 29 352 12.14 5.83
G. gallus 23 179 7.78 5.47
H. sapiens 179 2493 13.93 7.11
M. musculus 125 1266 10.13 6.01
R. norvegicus 59 795 13.47 6.80
S. cerevisiae 42 385 9.17 5.18
All species 457 5470 11.97 6.43
The Standard Deviation (SD) column is the average of population SD in BS lengths for all TFs.
higher variability (0.3≤ meanSD <0.6). Remaining 11% TFs have extreme variability, and they cover the remaining 11% of BSs.
We conducted leave-one-out cross-validation for all TFs over respective BS data. For each TF, the training data contained all its binding sites except the one left out. The test data contained all known negative examples (binding sites of other TFs of the same species) and one known pos-itive example (the left-out site). In accordance with [18], we removed any site from the set of negative examples for this TF if the site is also a BS of this TF.
Statistical evaluation
If a known negative example scored higher than the only known positive example, it was treated as a false positive. We needed to know which false positive rate corresponds to which true positive rate in order to draw an ROC curve for a configuration. In our case there was only one known positive example. Because several negative sites may score higher than the positive one, our model
must allow these false positives (compromising prediction accuracy) in order to correctly classify the known positive example. We considered allowable false positive rate from 0% to 20%. This range was discretized into several slots (each denoting a smaller range in false positive rate val-ues). For each leave-one-out experiment over a given set of TFBS we computed the true positive rate corresponding to each of these slots. These values were used to generate an ROC curve for this configuration. Details of this con-struction are given in Appendix B: Concon-struction of ROC curves. Area under the ROC curve of a configuration is a measure of its discriminatory power. However, it should be noted that the performance of two configurations can not be compared solely by the areas under respective ROC curves if the two curves intersect at one or more points [22].
We used Wilcoxon matched-pair signed-ranks test to compare performance of any two configurations at p-values 0.05 and 0.01 [23]. This test is well suited to our experiments because the underlying distribution of the data is unknown, yet we know that individual data points are independent. We used the number of false positives for each individual leave-one-out experiment for a TF as the rank of the experiment. Therefore, a high rank indicated poor performance.
Availability of supporting data
The data set, supplementary data, source codes (C#), and figures supporting the results of this article are available in http://biogrid.engr.uconn.edu/mlconsensus/.
Appendix A: The na¨ıve sorting-based multiple sequence alignment algorithm
The assumption behind this algorithm is that the core region is shared by all sites, and therefore on average,
0 0.05 0.1 0.15 0.2 0.25
0.0 0.1 0.2 0.3 0.4 0.5 0.6 0.7 0.8 0.9 1.0
Fraction of
Population
SD/mean ratio
TF
BS
[image:9.595.59.542.529.694.2]positions in short sites are more likely to constitute the core region (than positions in long sites). The steps of the algorithm are as follows:
1. Sort all binding sites from shortest to longest. 2. Take the shortest site that is yet unaligned. If more
than one sites have the smallest length, pick one in
random. This makes up the initial alignment,A.
3. ComputeC, the consensus, from A.
4. Lets be the next shortest, unaligned site.
5. If such ans does not exist, go to step 8. Otherwise,
6. Shifts along C from left to right. Find the alignment
which produces highest score oft with respect to C.
Addt to A at this alignment.
7. Go to step 3
8. Output:A is the complete multiple sequence
alignment ofS.
It can be observed that the order of choosing sites affects the resultant alignment, and a heterogeneous short site is likely to negatively impact the rest of the alignment. However, according to the assumption of the algorithm, if the short site contains the core region then it will not be heterogeneous.
Appendix B: Construction of ROC curves
Let TP, TN, FP and FN denote the number of true pos-itives, true negatives, false pospos-itives, and false negatives, respectively.
False Positive Rate, or FPR, is defined as the fraction of incorrectly classified known negative examples. Similarly, True Positive Rate, or TPR, is defined as the fraction of correctly classified known positive examples.
Let NTF be the number of TFs for the given species.
Let TFibe thei-th TF. LetNBSi be the number of known binding sites for TFi. A leave-one-out cross-validation is conducted for each of theNBSi binding sites. If a known negative example scores more than the known positive example, it is considered as a false positive.
We computed an ROC (Receiver Operating Character-istic) curve for each configuration over each species. FPR and TPR were placed along x-axis and y-axis, respectively, and the curve indicates the TPR obtained at different values for FPR. The computation for each configuration was done in three steps. At first, we computed TPR and FPR for each leave-one-out experiment involving a known binding site. Next, these values were averaged over all BSs for each TF. Lastly, these values were further averaged over all TFs for a given species.
Step One: Individual binding sites. Let BSj,i be the j -th BS of TFi. Let FPRmaxbe the maximum false positive rate considered for drawing the ROC curve. We used FPRmax=0.20, or 20%. Let the range 0≤FPR≤FPRmax
be divided intoMequal slots. Let FPRslotk denote the false positive rate corresponding to thek-th slot.
Let FPj,i be the number of false positives in the leave-one-out run which involves BSj,i as the known positive binding site. Let FPRj,ibe the observed false positive rate. For any given allowable false positive rate, if FPRj,i is greater than the allowable FPR, the given configuration will not be able to identify the known positive exam-ple.Tj(i,k)denotes whether the known positive example could be identified (i.e., occurrence of a true positive) by setting the allowable FPR equal to the false positive rate for thek-th FPR slot.
Tj(i,k)=
1 : FPRj,i≤FPRslotk
0 :otherwise , (11)
for 1≤j≤NBSi , 1≤i≤NTF, 1≤k≤M .
Step Two: Averaging over all BSs for a given TF. For TFi, letTBS(i,k)be the average number of true positives
obtained by setting the allowable FPR equal to the false positive rate for thek-th FPR slot.
TBS(i,k)=
1 NBSi ·
NBSi
j=1
Tj(i,k) (12)
for 1≤i≤NTF, 1≤k≤M .
Step Three: Averaging over all TFs for a species. Let TTF(k)be the average number of true positives obtained
by setting the allowable FPR equal to the false positive rate for thek-th FPR slot across all TFs.
TTF(k)=
1 NTF ·
NTF
i=1
TBS(i,k) (13)
for 1 ≤ k ≤ M. The ROC curve is produced by plotting TTF(k)atk-th FPR slot.
We considered only 0%–20% false positive rate for com-puting the area under an ROC curve. Since the FPR slots are discrete, we used the sum of TPR values in the mentioned FPR range as the area under an ROC curve.
Competing interests Financial competing interests
• In the past five years have you received reimbursements, fees, funding, or salary from an organization that may in any way gain or lose financially from the publication of this manuscript, either now or in the future? Is such an organization financing this manuscript (including the article-processing charge)? If so, please specify.No
• In the past five years have you received reimbursements, fees, funding, or salary from an organization that may in any way gain or lose financially from the publication of this manuscript, either now or in the future? Is such an organization financing this manuscript (including the article-processing charge)? If so, please specify.No
• Do you hold or are you currently applying for any patents relating to the content of the manuscript? Have you received reimbursements, fees, funding, or salary from an organization that holds or has applied for patents relating to the content of the manuscript? If so, please specify.No
• Do you have any other financial competing interests? If so, please specify.No
Non-financial competing interests
• Are there any non-financial competing interests (political, personal, religious, ideological, academic, intellectual, commercial or any other) to declare in relation to this manuscript? If so, please specify.No
Author’s contributions
CHH planned and directed the research, described the model, and proposed the na¨ıve sorting-based multiple sequence alignment algorithm. SQ implemented the model and methodology, carried out experiments, and made statistical evaluation of the outcome. Both authors read and approved the final manuscript.
Acknowledgements
This research is supported in part by the National Science Foundation (US) under the grant CCF-0755373.
Received: 14 April 2012 Accepted: 7 June 2012 Published: 2 July 2012
References
1. Stormo GD:DNA binding sites: representation and discovery.
Bioinformatics2000,16:16–23.
2. Hertz GZ, Hartzell GW, Stormo GD:Identification of consensus patterns in unaligned DNA sequences known to be functionally related.
Computer App biosci : CABIOS1990,6(2):81–92. [http://www.ncbi.nlm.nih. gov/pubmed/2193692]
3. Day WHE, McMorris FR:Critical comparison of consensus methods for molecular sequences.Nucleic Acids Res1992,20(5):1093–1099. 4. Stormo GD, Fields DS:Specificity, Free Energy and Information
Content in Protein-DNA Interactions.Trends Biochem Sci1998,
23:109–113.
5. Schneider TD, Stephens RM:Sequence logos: a new way to display consensus sequences.Nucleic Acids Res1990,18(20):6097–6100. [http:// www.pubmedcentral.nih.gov/articlerender.fcgi?artid=332411&tool= pmcentrez&rendertype=abstract]
6. Das MK, Dai HK:A survey of DNA motif finding algorithms.BMC Bioinformatics2007,8(Suppl 7):S21.
7. Robison K, McGuire AM, Church GM:E. coli DNA-Binding Site Matrices Applied to the Complete E. coli K12 Genome.J Mol Biol1998,
284:241–254. [http://arep.med.harvard.edu/ecoli matrices/]
8. Cartharius K, Frech K, Grote K, Klocke B, Haltmeier M, Klingenhoff A, Frisch M, Bayerlein M, Werner T:MatInspector and beyond: promoter analysis based on transcription factor binding sites.Bioinformatics 2005,21(13):2933–2942.
9. Reid JE, Evans KJ, Dyer N, Wernisch L, Ott S:Variable structure motifs for transcription factor binding sites.BMC genomics2010,11(30):30. [http://www.pubmedcentral.nih.gov/articlerender.fcgi?artid=2824720& amp;tool=pmcentrez&rendertype=abstract]
10. Lawrence CE, Altschul SF, Boguski MS, Liu JS, Neuwald AF, Wootton JC:
Detecting Subtle sequence Signals: A Gibbs Sampling Strategy for Multiple Alignment.Sci, New Ser1993,262(5131):208–214.
11. Chekmenev DS, Haid C, Kel AE:P-Match: transcription factor binding site search by combining patterns and weight matrices.Nucleic Acids Research2005,33(Web Server issue):W432–W437. [http://www.ncbi.nlm. nih.gov/pubmed/15980505]
12. Notredame C:Recent Evolutions of Multiple Sequence Alignment Algorithms.PLoS Comput Biol2007,3(8):4. [http://www.ncbi.nlm.nih. gov/pubmed/17784778]
13. Fazius E, Shelest V, Shelest E:SiTaR: a novel tool for transcription factor binding site prediction.Bioinformatics (Oxford, England)2011,
27(20):2806–2811. [http://www.ncbi.nlm.nih.gov/pubmed/21893518] 14. Badis G, Others:Diversity and Complexity in DNA Recognition by
Transcription Factors.Science2009,324:1720–1723.
15. Bulyk ML, Johnson PLF, Church GM:Nucleotides of transcription factor binding sites exert interdependent effects on the binding affinities of transcription factors.Nucleic Acids Res2002,30(5):1255–1261. 16. Barash Y, Elidan G, Friedman N, Kaplan T:Modeling dependencies in
protein-DNA binding sites.InProceedings Seventh Annu Int Conference Comput Mol Biol - RECOMB ’03. New York, New York USA: ACM Press; 2003:28–37. [http://dl.acm.org/citation.cfm?id=640075.640079] 17. Zhou Q, Liu JS:Modeling within-motif dependence for transcription
factor binding site predictions.Bioinformatics (Oxford, England)2004,
20(6):909–916. [http://bioinformatics.oxfordjournals.org/cgi/content/ abstract/20/6/909]
18. Osada R, Zaslavsky E, Singh M:Comparative analysis of methods for representing and searching for transcription factor binding sites.
Bioinformatics2004,20(18):3516–3525. [http://www.ncbi.nlm.nih.gov/ pubmed/15297295]
19. Wingender E, Chen X, Hehl R, Karas H, Liebich I, Matys V, Meinhardt T, Pruss M, Reuter I, Schacherer F:TRANSFAC: an integrated system for gene expression regulation.Nucleic Acids Res2000,28:316–319. 20. Larkin MA, Others:Clustal W and Clustal X version 2.0.Bioinformatics
2007,23(21):2947–2948.
21. Schneider TD, Stormo GD, Gold L:Information Content of Binding Sites on Nucleotide Sequences.J Mol Biol1986,188:415–431. 22. Sonego P, Kocsor A, Pongor S:ROC analysis: applications to the
classification of biological sequences and 3D structures.Briefings Bioinf2008,9(3):198–209. [http://www.ncbi.nlm.nih.gov/pubmed/ 18192302]
23. Sheskin DJ:Handbook of Parametric and Nonparametric Statistical Procedures. Boca Raton, Florida: Chapman & Hall/CRC; 2000.
doi:10.1186/1756-0500-5-340
Cite this article as:Quader and Huang:Effect of positional dependence and alignment strategy on modeling transcription factor binding sites.BMC Research Notes20125:340.
Submit your next manuscript to BioMed Central and take full advantage of:
• Convenient online submission
• Thorough peer review
• No space constraints or color figure charges
• Immediate publication on acceptance
• Inclusion in PubMed, CAS, Scopus and Google Scholar
• Research which is freely available for redistribution