n
eurostat
Theme 2
Economy and finance
Series Β
Short-term trends
ISSN 1011-0844
ECU-EMS information
7 □ 1989
Monthly
Increasingly active ecu bond market in first half of 1989.
The first half of 1989 saw a considerable increase in activity on the ecu bond market. The half-yearly issuing total
of ecu 5 500 million already exceeds the total for 1983 and 1984, and should the trend continue the volume of issues
will exceed the annual totals for 1986 to 1988.
Also noteworthy is the wide spread of issuers in the private sector. Thus, apart from some ecu 1600 million, the vast
majority of funds were raised by private industry both inside and outside the Community. The renewed attractiveness
of the ecu as a bond medium, even outside the Community, is underlined by the high figure of ecu 2.000 million
raised by the non-Community industrial sector in the first half of 1989.
The average weighted yield on new issues, which stood at approximately 6.2% at the beginning of the year, rose
steeply during the first six months to reach 9.8% in May, before falling back to 7.7%. The variation in issue yield
was therefore significandy greater than that in current yield, which only registered a rise of half a percentage point
during the same period. The differing composition of the list of issuers, clearly corresponding to wide variations in
credit status, is thus reflected in the divergence between issue yield and current yield.
The average term of newly issued ecu securities was in the medium-term range, i.e. approximately 5.5 years. The
variation, however, was very wide, with a number of ten-year issues alongside extremely short-term (one-year)
securities.
Contents
I.
A graph of the bilateral fluctuations of the EMS currencies.
II. Yearly and monthly issues of ecu bonds.
III. Interest rates on ecu deposits and yields on ecu bonds.
IV. Latest month's ecu bond issues.
V. Consumer price indices in national currencies.
VI. Consumer price indices in ecus.
a
eurostat
OFICINA ESTADÍSTICA DE tAS COMUNIDADES EUROPEAS DE EUROPÆISKE FÆLLESSKABERS STATISTISKE KONTOR STATISTISCHES AMT DER EUROPÄISCHEN GEMEINSCHAFTEN ΣΤΑΤΙΣΤΙΚΗ ΥΠΗΡΕΣΙΑ ΤΩΝ ΕΥΡΩΠΑΪΚΩΝ ΚΟΙΝΟΤΗΤΩΝ STATISTICAL OFFICE OF THE EUROPEAN COMMUNITIES OFFICE STATISTIQUE DES COMMUNAUTÉS EUROPÉENNES
ISTITUTO STATISTICO DELLE COMUNITÀ EUROPEE
BUREAU VOOR DE STATISTIEK DER EUROPESE GEMEENSCHAPPEN
SERVIÇO DE ESTATÍSTICA DAS COMUNIDADES EUROPEIAS
L-2920 Luxembourg - Tél. 43011 - Télex: Comeur Lu 3423
B-1049 Bruxelles, bâtiment Berlaymont, rue de la Loi 200 (bureau de liaison) — Tél. 2351111
Note
For ar
tel.
y information on the statistics
4301-2022
4301-3288
4301-4770
D.
G.
S.
Glatzel
Thouvenin
Ansion
¡n this bulletin contact Luxembourg:
ECSC-EEC-EAEC, Brussels · Luxembourg, 1989
Reproduction is authorized, except for commercial purposes, provided the source is acknowledged.
TABLE
I
BILATERAL FLUCTUATIONS OF THE EMS CURRENCIES
3.6 χ
3.2 ·■
2.8··
2 . 4
-2 ■■
1.6-■
1.2-1
0.8
0.4
0
- 0 . 4
- 0 . 8
- 1 . 2
PTA
. . w — ^ v . . ^ . .
JÎKB.
FBL
J2ÎS
I I I I I I I I I I I I I I I I I I I I I
02 05 09 11 16 18 22 24 26 30 01 05 07 09 13 15 19 21 23 27 29
Mai
June
How to read the graph
1. The various curves should be compared in pairs. To find the differential between two currencies, subtract the
(positive or negative) values along the y-axis corresponding to each currency.
2. The graph is drawn with the curve of the strongest currency above that of the weakest. It shows therefore the relative
position of each currency vis-à-vis the other currencies.
3. When two curves intersect or merge over a period of time there is no differential between the two currencies and
their market exchange rate equals their bilateral central rate.
Construction of the graph
1. The graph is drawn within a horizontal band corresponding to the maximum 2,25% margin of fluctuation applying
at any given moment to market exchange rates and the bilateral central rates of the EMS currencies, with the
exception of the LIT and the PTA, which have a maximum authorized fluctuation of 6%. This band is divided
symmetrically by a horizontal axis along which the points would be plotted if all currencies were at their bilateral
central rate and there were therefore no fluctuations.
2. The daily market exchange rates of all currencies are compared with the relevant bilateral central rates and the
differentials between the two calculated.
3. The maximum fluctuation between two currencies (with the exception of the LIT and the PTA) is shown within the
band, symmetrical with the horizontal axis. The fluctuations of the other currencies in relation to either of the two
currencies in question are shown within the maximum permissible fluctuation.
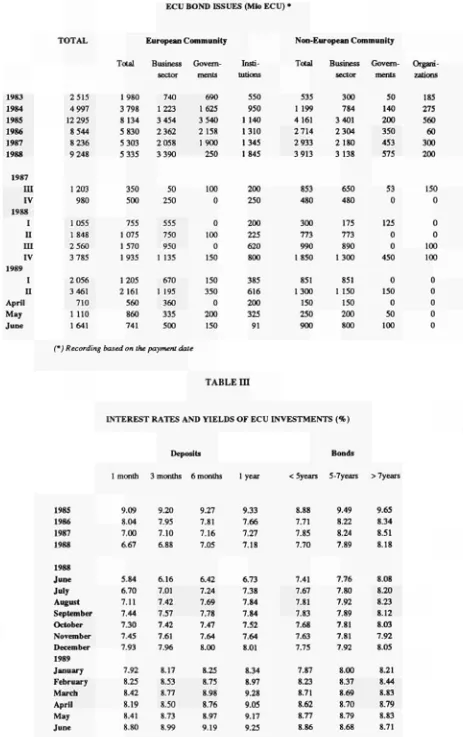
TABLER
ECU BOND ISSUES (Mio ECU) '
TOTAL European Community Non-European Community
1983 1984 1985 1986 1987 1988 1987 ΠΙ IV 1988 I II i n IV 1989 I II April May June 2 515 4 997 12 295 8 544 8 236 9 248 1203 980 1055 1 848 2 560 3 785 2 056 3 461 710 1 110 1641 Total 1980 3 798 8134 5 830 5 303 5 335 350 500 755 1075 1570 1935 1205 2 161 560 860 741 Business sector 740 1223 3 454 2 362 2 058 3 390 50 250 555 750 950 1 135 670 1 195 360 335 500 Govern ments 690 1625 3 540 2 158 1900 250 100 0 0 100 0 150 150 350 0 200 150 Insti tutions 550 950 1 140 1310 1345 1845 200 250 200 225 620 800 385 616 200 325 91 Total 535 1 199 4 161 2 714 2 933 3 913 853 480 300 773 990 1850 851 1300 150 250 900 Business sector 300 784 3 401 2 304 2 1 8 0 3 138 650 480 175 773 890 1 300 851 1 150 150 200 800 Govern ments 50 140 200 350 453 575 53 0 125 0 0 450 0 150 0 50 100 Organi zations 185 275 560 60 300 200 150 0 0 0 100 100 0 0 0 0 0
[image:4.595.89.552.59.796.2](*) Recording based on the payment date
TABLE ΠΙ
INTEREST RATES AND YIELDS OF ECU INVESTMENTS (%)
TABLEIV
LAST MONTH ECU BONDS ISSUES
Issue Payment
Date
Borrower Issued b u e Coapon Term Maturity Yields Lead Listing Notice (coantry) (Mio ECU) Price (year») % Manager
01/06/89 Japan Highway 03/07/89 Public Corp.
(JAPAN)
150 101.650 91/8 7 03/07//96 8.1 Long Term Credit Bank Japan
LN
07/06/89 ARBED 07/07/89 (LUXEMBOURG)
65 100.000 5 1/2 10 07/07/99 5.50 Morgan Stanley LX Convertible Int.
14/06/89 Caisse Nationale 12/07/89 des Autoroutes
(FRANCE)
150 101.750 8 3/4 10 12/07/99 8.27 Paribas LX-PA
23/06/89 Royaume de 11/08/89 BELGIQUE
150 100.000 Var. 10 11/05/99 Paribas LX Swap
23/06/89 Club Meditcmméc 24/07/89 (FRANCE)
40 101.875 15 1 24/07/90 1Z88 Sté Générale LX Swap
26/06/89 E.I.B. 17/07/89 B.E.L
200 99.550 81/2 10 17/07/99 8.57 Caisse des Dépots
LX-PA
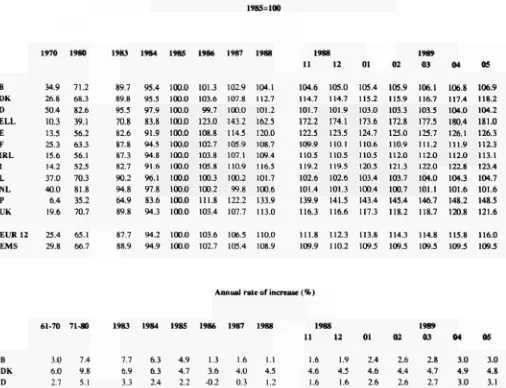
TABLE V
CONSUMER PRICE INDICES IN NATIONAL CURRENCY 1985=100 B DK D ELL E F IRL I L NL Ρ UK
EUR 12
EMS 1970 34.9 26.8 50.4 10.3 13.5 25.3 15.6 14.2 37.0 40.0 6.4 19.6 25.4 29.8 1980 71.2 68.3 82.6 39.1 56.2 63.3 56.1 52.5 70.3 81.8 35.2 70.7 65.1 66.7 1983 89.7 89.8 95.5 70.8 82.6 87.8 87.3 82.7 90.2 94.8 64.9 89.8 87.7 88.9 1984 95.4 95.5 97.9 83.8 91.9 94.5 94.8 91.6 96.1 97.8 83.6 94.3 94.2 94.9 1985 100.0 100.0 100.0 100.0 100.0 100.0 100.0 100.0 100.0 100.0 100.0 100.0 100.0 100.0 1986 101.3 103.6 99.7 123.0 108.8 102.7 103.8 105.8 100.3 100.2 111.8 103.4 103.6 102.7 1987 102.9 107.8 100.0 143.2 114.5 105.9 107.1 110.9 100.2 99.8 122.2 107.7 106.5 105.4 1988 104.1 112.7 101.2 162.5 120.0 108.7 109.4 116.5 101.7 100.6 133.9 113.0 110.0 108.9 1988 11 104.6 114.7 101.7 172.2 122.5 109.9 110.5 119.2 102.6 101.4 139.9 116.3 111.8 109.9 12 105.0 114.7 101.9 174.1 123.5 110.1 110.5 119.5 102.6 101.3 141.5 116.6 112.3 110.2 01 105.4 115.2 103.0 173.6 124.7 110.6 110.5 120.5 103.4 100.4 143.4 117.3 113.8 109.5 02 105.9 115.9 103.3 172.8 125.0 110.9 112.0 121.3 103.7 100.7 145.4 118.2 114.3 109.5 1989 03 106.1 116.7 103.5 177.5 125.7 111.2 112.0 122.0 104.0 101.1 146.7 118.7 114.8 109.5 04 106.8 117.4 104.0 180.4 126.1 111.9 112.0 122.8 104.3 101.6 148.2 120.8 115.8 109.5 05 106.9 118.2 104.2 181.0 126.3 112.3 113.1 123.4 104.7 101.6 148.5 121.6 116.0 109.5
Annual rate of increase (%)
Β DK D ELL E F IRL I L NL Ρ LK
EUR 12
EMS 61-70 3.0 6.0 2.7 2.1 6.1 4.1 4.8 4.0 2.6 4.2 4.5 4.1 3.7 3.3 71-80 7.4 9.8 5.1 14.5 15.4 9.7 13.7 14.1 6.7 7.4 18.7 13.8 9.9 8.4 1983 7.7 6.9 3.3 20.5 12.1 9.6 10.4 14.7 8.6 2.7 25.1 4.6 8.5 8.4 1984 6.3 6.3 2.4 18.3 11.2 7.3 8.6 10.8 6.5 3.2 28.9 5.0 7.4 6.7 1985 4.9 4.7 2.2 19.4 8.9 5.9 5.4 9.2 4.1 2.3 19.6 6.1 6.1 5.4 1986 1.3 3.6 -0.2 23.1 8.8 2.7 3.8 5.8 0.3 0.3 11.8 3.4 3.6 2.7 1987 1.6 4.0 0.3 16.1 5.3 3.0 3.1 4.8 -0.1 -0.2 9.4 4.2 3.2 2.7 1988 1.1 4.5 1.2 13.5 4.8 2.7 1.9 5.1 1.5 0.9 9.7 4.9 3.1 2.8 198 11 1.6 4.6 1.6 14.1 5.4 3.0 2.7 5.3 2.1 1.1 11.9 6.4 4.1 3.2 8 12 1.9 4.5 1.6 14.0 5.9 3.1 2.7 5.4 1.9 1.2 11.7 6.8 4.3 2.1 01 2.4 4.6 2.6 13.8 6.3 3.3 2.7 5.5 2.5 0.9 12.2 7.5 4.8 2.5 02 2.6 4.4 2.6 13.8 6.2 3.4 3.4 5.9 2.7 1.0 12.1 7.8 4.9 2.2 1989 03 2.8 4.7 2.7 13.5 6.0 3.4 3.4 6.1 2.8 0.9 12.4 7.9 5.0 1.9 04 3.0 4.9 3.0 13.0 6.8 3.6 3.4 6.5 3.2 1.1 13.2 8.0 5.3 1.6 05 3.0 4.8 3.1 13.1 7.0 3.7 3.8 6.7 3.5 1.0 13.0 8.3 5.4 1.3
Average deviation around the mean
EUR 12
EMS 0.8 1.0 3.5 4.0 4.2 3.9 3.3 2.8 2.4 2.3 2.7 2.0 1.9 1.7 2.0 1.4 2.1 1.4 2.2 1.4 2.1 1.8 2.2 2.0 2.2 1.8 2.1 1.6 2.1 1.4
Average deviation vis-à-vis the minimum
EUR 12
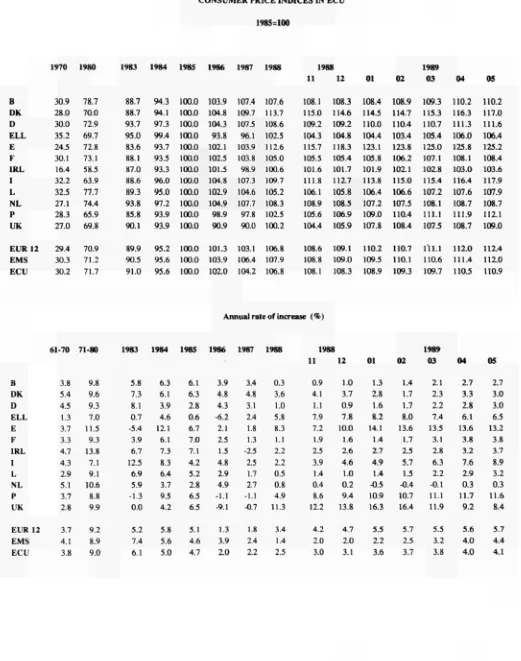
TABLE VI
CONSUMER PRICE INDICES IN ECU
1985=100 Β DK D ELL E F IRL I L NL Ρ UK EUR 12 EMS ECU 1970 30.9 28.0 30.0 35.2 24.5 30.1 16.4 32.2 32.5 27.1 28.3 27.0 29.4 30.3 30.2 1980 78.7 70.0 72.9 69.7 72.8 73.1 58.5 63.9 77.7 74.4 65.9 69.8 70.9 71.2 71.7 1983 88.7 88.7 93.7 95.0 83.6 88.1 87.0 88.6 89.3 93.8 85.8 90.1 89.9 90.5 91.0 1984 94.3 94.1 97.3 99.4 93.7 93.5 93.3 96.0 95.0 97.2 93.9 93.9 95.2 95.6 95.6 1985 100.0 100.0 100.0 100.0 100.0 100.0 100.0 100.0 100.0 100.0 100.0 100.0 100.0 100.0 100.0 1986 103.9 104.8 104.3 93.8 102.1 102.5 101.5 104.8 102.9 104.9 98.9 90.9 101.3 103.9 102.0 1987 107.4 109.7 107.5 96.1 103.9 103.8 98.9 107.3 104.6 107.7 97.8 90.0 103.1 106.4 104.2 1988 107.6 113.7 108.6 102.5 112.6 105.0 100.6 109.7 105.2 108.3 102.5 100.2 106.8 107.9 106.8 1988 11 108.1 115.0 109.2 104.3 115.7 105.5 101.6 111.8 106.1 108.9 105.6 104.4 108.6 108.8 108.1 12 108.3 114.6 109.2 104.8 118.3 105.4 101.7 112.7 105.8 108.5 106.9 105.9 109.1 109.0 108.3 01 108.4 114.5 110.0 104.4 123.1 105.8 101.9 113.8 106.4 107.2 109.0 107.8 110.2 109.5 108.9 02 108.9 114.7 110.4 103.4 123.8 106.2 102.1 115.0 106.6 107.5 110.4 108.4 110.7 110.1 109.3 1989 03 109.3 115.3 110.7 105.4 125.0 107.1 102.8 115.4 107.2 108.1 111.1 107.5 111.1 110.6 109.7 04 110.2 116.3 111.3 106.0 125.8 108.1 103.0 116.4 107.6 108.7 111.9 108.7 112.0 111.4 110.5 05 110.2 117.0 111.6 106.4 125.2 108.4 103.6 117.9 107.9 108.7 112.1 109.0 112.4 112.0 110.9
Annual rate of increase (%)
61-70 71-80 1983 1984 1985 1986 1987 1988 1988
11 12 01 02
1989
03 04 05
Β DK D ELL E F IRL 1 L NL Ρ UK 3.8 5.4 4.5 1.3 3.7 3.3 4.7 4.3 2.9 5.1 3.7 2.8 9.8 9.6 9.3 7.0 11.5 9.3 13.8 7.1 9.1 10.6 8.8 9.9 5.8 7.3 8.1 0.7 -5.4 3.9 6.7 12.5 6.9 5.9 -1.3 0.0 6.3 6.1 3.9 4.6 12.1 6.1 7.3 8.3 6.4 3.7 9.5 4.2 6.1 6.3 2.8 0.6 6.7 7.0 7.1 4.2 5.2 2.8 6.5 3.9 4.8 4.3 -6.2 2.1 2.5 1.5 4.8 2.9 4.9 -1.1 3.4 4.8 3.1 2.4 1.8 1.3 -2.5 2.5 1.7 2.7 -1.1 0.3 3.6 1.0 5.8 8.3 1.1 2.2 2.2 0.5 0.8 4.9
0.9 1.0 1.3 1.4 2.1 4.1 3.7 2.8 1.7 2.3 1.1 0.9 1.6 1.7 2.2 7.9 7.8 8.2 8.0 7.4 7.2 10.0 14.1 13.6 13.5
1.9 1.6 1.4 1.7 3.1 2.5 2.6 2.7 2.5 2.8 3.9 4.6 4.9 5.7 6.3 1.4 1.0 1.4 1.5 2.2 0.4 0.2 -0.5 -0.4 -0.1 8.6 9.4 10.9 10.7 11.1
2.7 3.3 2.8 6.1 13.6 3.8 3.2 7.6 2.9 0.3 11.7 11.6 2.7 3.0 3.0 6.5 13.2 3.8 3.7 8.9 3.2 0.3
6.5 -9.1 -0.7 11.3 12.2 13.8 16.3 16.4 11.9 9.2 8.4
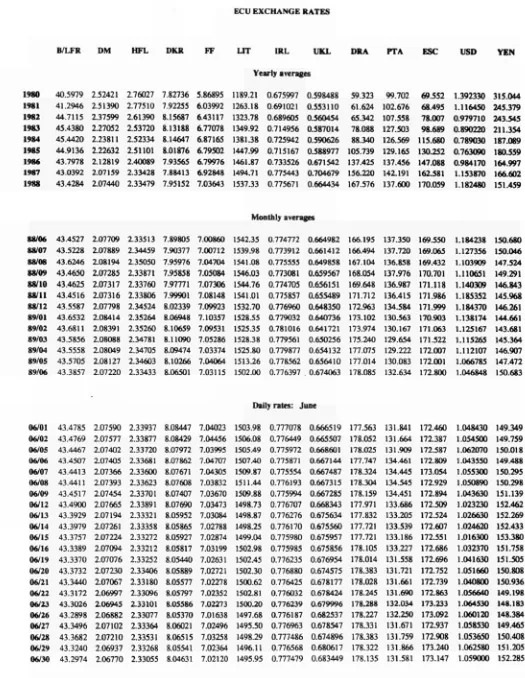
TABLE VII
ECU EXCHANGE RATES
B/LFR DM HFL DKR FT LIT IRL UKI. DRA PTA ESC USD VEN
1980 1981 1982 1983 1984 1985 1986 1987 1988 40.5979 41.2946 44.7115 45.4380 45.4420 44.9136 43.7978 43.0392 43.4284 2.52421 2.51390 2.37599 2.27052 2.23811 2.22632 2.12819 2.07159 2.07440 2.76027 2.77510 2.61390 2.53720 2.52334 2.51101 2.40089 2.33428 2.33479 7.82736 7.92255 8.15687 8.13188 8.14647 8.01876 7.93565 7.88413 7.95152 5.86895 6.03992 6.43117 6.77078 6.87165 6.79502 6.79976 6.92848 7.03643 Yearly averages 1189.21 1263.18 1323.78 1349.92 1381.38 1447.99 1461.87 1494.71 1537.33 0.675997 0.691021 0.689605 0.714956 0.725942 0.715167 0.733526 0.775443 0.775671 0.598488 0.553110 0.560454 0.587014 0.590626 0.588977 0.671542 0.704679 0.664434 59.323 61.624 65.342 78.088 88.340 105.739 137.425 156.220 167.576 99.702 102.676 107.558 127.503 126.569 129.165 137.456 142.191 137.600 69.552 68.495 78.007 98.689 115.680 130.252 147.088 162.581 170.059 1.392330 1.116450 0.979710 0.890220 0.789030 0.763090 0.984170 1.153870 1.182480 315.044 245.379 243.545 211.354 187.089 180.559 164.997 166.602 151.459 Monthly averages 88/06 88/07 88/08 88/09 88/10 88/11 88/12 89/01 89/02 89/03 89/04 89/05 89/06 43.4527 43.5228 43.6246 43.4650 43.4625 43.4516 43.5587 43.6532 43.6811 43.5856 43.5558 43.5705 43.3857 2.07709 2.07889 2.08194 2.07285 2.07317 2.07316 2.07798 2.08414 2.08391 2.08088 2.08049 2.08127 2.07220 2.33513 2.34459 2.35050 2.33871 2.33760 2.33806 2.34524 2.35264 2.35260 2.34781 2.34705 2.34603 2.33433 7.89805 7.90377 7.95976 7.95858 7.97771 7.99901 8.02339 8.06948 8.10659 8.11090 8.09474 8.10266 8.06501 7.00860 7.00712 7.04704 7.05084 7.07306 7.08148 7.09923 7.10357 7.09531 7.05286 7.03374 7.04064 7.03115 1542.35 1539.98 1541.08 1546.03 1544.76 1541.01 1532.70 1528.55 1525.35 1528.38 1525.80 1513.26 1502.00 0.774772 0.773912 0.775555 0.773081 0.774705 0.775857 0.776960 0.779032 0.781016 0.779561 0.779877 0.778562 0.776397 0.664982 0.661412 0.649858 0.659567 0.656151 0.655489 0.648350 0.640736 0.641721 0.650256 0.654132 0.656410 0.674063 166.195 166.494 167.104 168.054 169.648 171.712 172.963 173.102 173.974 175.240 177.075 177.014 178.085 137.350 137.720 136.858 137.976 136.987 136.415 134.584 130.563 130.167 129.654 129.222 130.083 132.634 169.550 169.065 169.432 170.701 171.118 171.986 171.999 170.903 171.063 171.522 172.007 172.001 172.800 1.184238 1.127356 1.103909 1.110651 1.140309 1.185352 1.184370 1.138174 1.125167 1.115265 1.112107 1.066785 1.046848 150.680 150.046 147.524 149.291 146.843 145.968 146.261 144.661 143.681 145.364 146.907 147.472 150.683
Daily rates: June
EXPLANATORY NOTES
Ecu exchange rates.
The exchange rates for the ecu against the national currencies of the Member States of the Community, the United States
(USD) and Japan (YEN) are shown as monthly averages and daily rates for the latest available month.
The ecu basket, dating from 17 September 1984, is currently made up as follows:
DM FF HFL BFR LFR LIT DKR IRL UKL* DRA*
1 ecu =0,719+ 1,31+ 0,256+ 3,71+ 0,14+ 140+ 0,219+ 0,00871+ 0,0878+ 1,15
Ecu central rates since 12 January 1987
DM FF HFL B/LFR LIT DKR IRL UKL* DRA*
2,05853 6,90403 2,31943 42,4582 1483,58 7,85212 0,768411 0,739615 150,792
Weights of currencies in the ecu basket (based on new central rates from 12 January 1987), in %.
DM FF HFL B/LFR LIT DKR IRL UKL* DRA*
100= 34,93 18,97 11,04 9,07 9,44 2,79 1,13 11,87 0,76
* = Does not participate in the exchange rate mechanism
Consumer price indices in national currency
The consumer [Hice indices in the national currency of each country measure changes in the purchasing power of one unit
of national currency spent in the country concerned.
Two composite indices are calculated, covering all the Member States of the Community (EUR 12) and the eight Member
States with currencies participating in the European Monetary System exchange rate mechanism (EMS).
These indices are calculated as weighted arithmetic means (chain indices) of the national indices, the weighting for each
Member State being its relative share in the final consumption of households of the group of countries in question (EUR 12,
EMS), expressed in purchasing power standards, at current prices and purchasing power parities.
At the foot of the table, the average weighted fluctuations around the mean and the minimum are given for the same groups
of countries, with the same weightings. (These are calculated as weighted averages of the absolute fluctuations in relation to
the mean and the minimum respectively). They show the degree to which price movements in the Member States in the
Community converge.
Consumer price indices in ecus
For each country the index of consumer prices in ecus is calculated by dividing the national consumer price index by the
average movement of the national currency in relation to the ecu during the month. It measures the change in the purchasing
power of one ecu in the country concerned.
Three composite indices are calculated, covering all the Member States of the Community (EUR 12), the eight Member
States participating in the European Monetary System exchange rate mechanism (EMS) and the ten Member States whose
currencies go to make up the ecu (ECU). These indices are calculated as weighted arithmetic means (chain indices) of the
consumer price indices expressed in ecus as mentioned above.
The weightings are defined as follows:
• for the EUR 12 and EMS indices, the relative share of each Member State in the final consumption of households for
the group of countries in question (EUR 12 or EMS), expressed in ecus at current prices and exchange rates (annual
weighting).
Ecu bond issues
[image:10.595.50.561.61.215.2]All ecu-denominated bond issues, both national and international, are covered, together with ecu issues offering the option
of conversion into other currencies. Main source: International Financing Review
Table II shows, under the headings:
• Business sector and Governments: national issuers, both private and public.
• Institutions: the European Investment Bank and the Commission of the European Communities (EEC, ECSC,
Euratom).
• Organizations: the specialist institutions of the United Nations, the World Bank, the Council of Europe, etc...
The issues are recorded as at the payment date.
Interest rates and yields on ecu investments
The interest rates for 1, 3 and 6 month and 1 year deposits are calculated on the basis of the Friday London market rates
(source: Financial Times).
The bonds are classified according to three types of terms: under 5 years, from 5 to 7 years and more than 7 years. The
redemption yields of ecu bonds are calculated each Wednesday from a sample of fixed interest bonds, denominated in ecus
and listed on the Luxemburg Stock Exchange. These yields are weighted by amounts in circulation, (source: Luxembourg
Stock Exchange).
The monthly and yearly averages are the arithmetic means of these weekly interest rates and bond yields.
Venta y suscripciones · Salg og abonnement · Verkauf und Abonnement · Πωλήσεις και συνδρομές
Sales and subscriptions · Vente et abonnements · Vendita e abbonamenti
Verkoop en abonnementen · Venda e assinaturas
BELGIQUE / BELGIË FRANCE
M o n i t e u r belge / Belgisch Staatsblad
42, Rue de Louvain / Leuvenseweg 42 1000 Bruxelles / 1000 Brussel Tél. 512 0 0 26
CCP / Postrekening 000-2005502-27
Sous-dépôts / Agentschappen:
Librairie européenne / Europese Boekhandel
Rue de la Loi 244 / Wetstraat 244 1040 Bruxelles / 1040 Brussel
J e a n D e Lannoy
Avenue du Roi 202 /Koningslaan 202 1060 Bruxelles / 1060 Brussel Tel (02) 538 5169
Télex 6 3 2 2 0 UNBOOK Β
CREDOC
Rue de la Montagne 34 / Bergstraat 34 Bte 11 / Bus 11
1000 Bruxelles / 1000 Brussel
DANMARK
J. H. Schultz Information A / S E F- Publikationer
Ottiliavej 18 2 5 0 0 Valby Tlf: 0 1 4 4 23 0 0 Telefax: 0 1 4 4 15 12 Girokonto 6 0 0 08 86
BR DEUTSCHLAND
Bundesanzeiger Verlag
Breite Straße Postfach 10 80 06 5 0 0 0 Köln 1 Tel (02 21) 20 29-0 Fernschreiber
ANZEIGER BONN 8 882 595 Telefax: 2 0 29 278
GREECE
G.C. Eleftheroudakis SA
International Bookstore 4 Nikis Street
105 6 3 Athens Tel.: 322 22 55 Telex: 2 1 9 4 1 0 ELEF Telefax 3254 889
Sub-agent for Northern Greece
M o l h o s Bookstore
The Business Bookshop 10 Tsimiski Street Thessaloniki Tel 2 7 5 2 7 1 Telex 4 1 2 8 8 5 LIMO
ESPANA
Boletín Oficial del Estado
Trafalgar 27 E-28010 M a d r i d Tel. (91) 4 4 6 6 0 0 0
Mundi-Prensa Libros. S.A.
Castellò 37 E-28001 M a d r i d
Tel. (91) 4 3 1 33 99 (Libros)
4 3 1 32 22 (Suscripciones)
4 3 5 36 37 (Dirección) Telex 4 9 3 7 0 - M PLI-E
Telefax: ( 9 1 ) 2 7 5 39 98
Journal officiel
Service des publications des Communautés européennes
26, rue Desaix 75727 Paris Cedex 15 Tel ( 1 ) 4 0 58 75 00 Télécopieur: ( 1 ) 4 0 5 8 7574
IRELAND
Government Publications Sales Office
Sun Alliance House Molesworth Street Dublin 2
Tel. 71 03 09
or by post
Government Stationery Office EEC Section
6th floor Bishop Street Dublin 8 Tel 78 16 66
ITALIA
Licosa Spa
Via Benedetto Fortini. 120/10 Casella postale 552
50 125 Firenze Tel. 64 54 15 Telefax: 64 12 57 Telex 570466 LICOSA I CCP 343 509
Subagenti:
Lfcrena scientifica Lucio de Biasio -AEKXJ
Via Meravigli. 16 20 123 Milano
Tel 80 76 79
Herder Editrice e Libreria
Piazza Montecitorio. 117-120 00 186 Roma
Tel. 67 94 628/67 95 304
Libreria giuridica
Via 12 Ottobre. 172/R 16 121 Genova Tel 59 56 93
GRAND-DUCHÉ DE LUXEMBOURG
Abonnements seulement Subscriptions only Nur fur Abonnements
Messageries Paul Kraus
11. rue Christophe Plantin L-2339 Luxembourg Tél. 4 8 21 31 Télex 2515 CCP 49242-63
NEDERLAND
SDU uitgeverij
Christoffel Plantijnstraat 2 Postbus 20014
2500 EA 's-Gravenhage Tel (070) 78 98 80 (bestellingen) Telefax: (070) 476351
PORTUGAL
Distribuidora Livros Bertrand Lda. Grupo Bertrand, SARL
Rua das Terras dos Vales. 4-A Apart 37
2 7 0 0 Amadora Codex
Tel 4 9 3 90 50 - 494 87 88
Telex 15798 BERDIS
UNITED KINGDOM
H M S O Books (PC 16)
HMSO Publications Centre 51 Nine Elms Lane London SW8 5DR Tel (01) 873 9090 Fax: GP3 8 7 3 8 4 6 3
Sub-agent:
Alan Armstrong Ltd
2 A r k w n g h t Road Reading. Berks RG2 OSQ Tel (0734) 75 17 71 Telex 8 4 9 9 3 7 AAALTD G Fax: (0734) 755164
OSTERREICH
Manz'sche Verlagsbuchhandlung
Kohlmarkt 16 1014 Wien
Tel ( 0 2 2 2 ) 5 3 3 17 81 Telex 11 25 00 BOX A Telefax: (0222) 533 17 81 81
TURKIYE
Dünya super veb of set A. S.
Narhbahçe Sokak No 15 Cagaloglu
Istanbul Tel 512 01 90 Telex: 23822 dsvo-tr
UNITED STATES OF AMERICA
European Community Information Service
2100 M Street. NW Suite 707
Washington. DC 20037 Tel (202) 862 9 5 0 0
CANADA
Renouf Publishing Co.. Ltd
6 1 Sparks Street Ottawa
Ontario K1P 5R1
Tel Toll Free 1 (800) 267 4 1 6 4 Ottawa Region (613) 238 8985-6
Telex 053-4936
JAPAN
Kinokuniya Company Ltd
17-7 Shinjuku 3-Chome Shiniuku-ku
Tokyo 160-91 Tel ( 0 3 ) 3 5 4 0 1 3 1
Journal Department
PO Box 55 Chitóse Tokyo 156 Tel. ( 0 3 ) 4 3 9 0 1 2 4
AUTRES PAYS OTHER COUNTRIES ANDERE LÄNDER
Imprensa Nacional
Casa da Moeda. EP.
Rua D. Francisco Manuel de Melo, 5 1092 Lisboa Codex
Tel. 69 34 14
Office des publications officielles des Communautés européennes
2. rue Mercier L-2985 Luxembourg Tel 49 92 81
Télex PUBOF LU 1324 b
Price (excl. VAT) in Luxembourg: Single copy ECU 5.50 · Subscription ECU 46.50
. · . OFICINA DE PUBLICACIONES OFICIALES DE LAS COMUNIDADES EUROPEAS I S S N 1 0 1 1 " 0 8 4 4
" e S * KONTORET FOR DE EUROPÆISKE FÆLLESSKABERS OFFICIELLE PUBLIKATIONER . = . A M T FÜR AMTLICHE VERÖFFENTLICHUNGEN DER EUROPÄISCHEN GEMEINSCHAFTEN