Abstract: Multistage-overtopping wave energy device is an example of the overtopping concept in extracting energy from the ocean wave. The multistage opening allows the wave to overtop and stored inside the multistage reservoirs and later used for electricity generation. Previously, using concentrated V-shape-ramp on the conventional multi-reservoir Sea Slot-Cone Generator (SSG) has been proven to improve up to 67 percent in hydraulic power at the 3.5 meters of significant wave height and 9.3 meters of wave period. However, the performance begins to drop when operating at smaller wave height consisting of 2.5-meter significant wave height and 7.9 seconds of wave period. Thus, this follow-up paper presents a numerical study to improve device performance, especially at small wave height. Five breakwater-ramp designs were tested consisting of Basis, Design 1 to Design 5. The overtopping device performance was simulated using FLOW-3D CFD software. Results are presented in the form of mean overtopping discharge or potential energy stored and the total energy potential for each propose breakwater-ramp design. The numerical results show that the highest total energy potential represents as the potential power output is recorded by Design 4 and Design 5 with 63.26 and 63.05 kW respectively, compared to basis SSG device with only 29.14 kW at the wave height of 2.8 meters and a wave period of 9.3 seconds.
Index Terms: Ocean Energy, Marine Renewable Energy, Wave Energy Converter, Computational Fluid Dynamic (CFD)
NOMENCLATURE
SSG Sea Slot Cone Generator
WEC Wave Energy Converter 𝑂𝑊𝐶 Oscillating Water Column 𝑂𝑊𝑆𝐶 Oscillating Wave Surge Converter 𝑃𝑃 Power Pyramid
𝐶𝐹𝐷 Computational Fluid Dynamic VOF Volume of Fluid
NS Navier-Stokes Equations
RANS Reynolds Averaging of the Navier-Stokes 𝜂𝐻𝑦𝑑𝑠𝑠 Overtopping Device Efficiency
𝑃𝐻𝑦𝑑 Hydraulic Power or Potential Energy Store in Reservoir
𝑃𝑤𝑎𝑣𝑒 Wave Power 𝜌 Density of Water
𝑔 Gravitational Acceleration
𝐻𝑟𝑚𝑠 ,0 Root Mean Square for Wave Height [𝐶𝑔0]𝑇 Offshore Group Velocity
𝐻𝑆 Significant Wave Height 𝑇𝑒 Harmonic Average Wave Period
Revised Manuscript Received on October 05, 2019.
M. A. Mustapa, Marine Engineering Technology, Universiti Kuala Lumpur/ Malaysian Institute of Marine Engineering Technology, Lumut, Perak.
O. B. Yaakob, Mechanical Engineering, Universiti Teknologi Malaysia/ Marine Technology Center, Skudai, Malaysia.
Yasser M. Ahmed, Faculty of Engineering, Alexandria University, Alexandria, Egypt.
𝜉𝑜𝑝 Breaker Parameter 𝑆𝑜𝑝 Wave Steepness
𝑇𝑝 Wave Period, Peak Period of the Wave Spectrum 𝛼 Slope Angle
𝑄𝑏 Dimensionless Overtopping Discharge for Breaking Waves
𝑄𝑛 Dimensionless Overtopping Discharge for Non-Breaking Waves
𝑞𝑜𝑣 Mean Overtopping Discharge per unit width 𝑅𝑐 Wave Crest Height for Reservoir
𝐻𝑚 0,𝑡 Water Depth at Structure Toe 𝐿0𝑝 Wave Length at Structure Toe 𝑑𝑟 Vertical Ramp Cut
Water Depth
I. INTRODUCTION
Ocean renewable energy is an alternative source to fulfil world electricity demand. The ocean energy present in several forms including ocean waves, tidal barrage, tidal current, thermal and salinity gradient. Among those, energy generated by waves produces significant benefit considering the higher amount of energy density. At present, several wave energy concept such as overtopping, attenuator, point absorber, oscillating water surge converter (OWSC) and oscillating water column (OWC) was developed to extract the untapped sources from the ocean wave. Each developed concept has its own strength and was specifically designed to tackle certain geographical and wave characteristics. Among those, overtopping and oscillating water column (OWC) concept applied for a cost-sharing benefit as the structure was integrated on the breakwater structure [1]. The most common example of the overtopping device is a Sea Slot-Cone Generator (SSG). The entire system was developed based on an integration of the overtopping device and the breakwater structure [2][3]
The integration concept allows cost-sharing benefit in design, construction, installation and maintenance. In addition, it helps to widen the purpose of the conventional breakwater structure not only for wave energy dissipation but also as a wave energy harvester. The breakwater structure helps to provide additional strength and stability to the entire structure of the wave energy device. The integration concept uses an additional reservoir, placed at the back of the breakwater structure. The first stage of harnessing the energy starts as the incoming wave begin to strike at the front area of the breakwater structure.
Due to an excessive energy amount carried by the incoming wave, it will start to climb the breakwater ramp area and later begin to break as shallowing phenomena take
Numerical Simulation of the Breakwater-Ramp
Design for Multistage-Overtopping Wave Energy
place. The breaking wave will start to fill the multi-stage reservoir as it retracts back to the ocean. This helps to reduce reflected waves, which is normally developed in front of the conventional breakwater structure. Thus, it may reduce the percentage of scouring phenomena that cause due to a collision. This happens between an incoming wave and the retracting wave. As a result, it increases the life span of the entire structure.
The SSG device was developed by Kofoed in 2002 [4]. The idea was inspired based on the previous invention called Power Pyramid (PP) [5]. The SSG device is consists of a multistage reservoir where each placed on top of each other at a certain height in staging configuration. This allows energy extraction to take place at different wave height. The trapping water is kept in the potential energy form where later use to drive the turbine in generating electricity. At present, there is still no development of the large-scale SSG prototype. However, extensive studies were recently carried out using experimental work in finding optimum geometry and dimension to further improve, especially the performance of the overtopping device [2]. The performance is measured based on the amount of the mean overtopping discharge stored at each reservoir. It was later followed by a study carried out in finding the influence of wave direction, spreading effect and the horizontal distance between the reservoir to the SSG performance [6]. Next, further study was taking place to find the wave loading impact on the SSG structure [7] and finally a real case study consisting of a geometry optimisation for Hanstholm Port [8]. This paper presents a study carried out to find the most optimum breakwater-ramp design for multi-stage overtopping wave energy device. The focus of this study is to improve the energy extraction amount and thus, the new breakwater-ramp design was proposed. The performance was access using Computational Fluid Dynamic (CFD) software. At the end of this paper, the results will show in total energy potential stored in a reservoir.
II. LITERATUREREVIEW Overtopping Device Performance
The overtopping device efficiency is determined using device efficiency
𝜂
𝐻𝑦𝑑𝑠𝑠 , hydraulic power𝑃
𝐻𝑦𝑑 and wavepower
𝑃
𝑤𝑎𝑣𝑒 functions as defined in Equation 1.𝜂
𝐻𝑦𝑑𝑠𝑠=
𝑃𝐻𝑦𝑑 𝑃𝑤𝑎𝑣𝑒(1)
The Wave Power
The available wave power appear in front of the breakwater structure is calculated using;
𝑃
𝑤𝑎𝑣𝑒=
18
𝜌𝑔𝐻
𝑟𝑚𝑠 ,02
· [𝐶
𝑔0
]
𝑇 (2)where;
𝐻
𝑟𝑚𝑠 ,0 represents as the root mean square for the wave height, and[𝐶
𝑔0]
𝑇 Represents as offshore group velocity which calculated at the mean period of T.[𝐶
𝑔0]
𝑇 ≣𝑇𝑒=
𝑔𝑇𝑒4𝜋 (3)
In Equation 3, the harmonic average wave period
𝑇
𝑒 isemployed for
𝑇
; the latter is about 1.1 the peak period𝑇
𝑝 and is calculated as the ratio between the spectral moment of order −1 and the area of the power spectrum. By noting that the deepwater significant wave height𝐻
𝑠,0 , whetherspectrally or statistically defined, is approximate
2𝐻
𝑟𝑚𝑠 ,0, it will give [2]:𝑃
𝑤𝑎𝑣𝑒=
𝜌𝑔2𝐻𝑠,02 ∙𝑇𝑒64𝜋 (4)
This Equation 4 is used starts from wave begins to propagation until the wave break.
Non-Dimensional Overtopping Discharge
From the previous study conducted by Van der Meer, the equation of non-dimensional overtopping discharge,
𝑄
can be divided into two forms;𝑄
𝑏 is used for breaking waves and𝑄
𝑛 is for non-breaking waves [7]. The wave breaking and non-breaking phenomena can be measured using a breaker parameter,𝜉
𝑜𝑝. For breaking waves,𝜉
𝑜𝑝 is lessthan 2 and for non-breaking waves,
𝜉
𝑜𝑝 is higher than 2. Equation 5 shows the breaker parameter;
𝜉
𝑜𝑝=
𝑡𝑎𝑛𝛼 𝑆𝑜𝑝=
𝑡𝑎𝑛𝛼
2𝜋.𝐻𝑆/(𝑔.𝑇𝑝2)
(5)
where;
𝑆
𝑜𝑝 represents as wave steepness,𝑇
𝑝 represents a wave period, peak period of the wave spectrum,𝛼
represents a slope angle, and𝐻
𝑆 represents a significant wave height.In order to find the wave steepness value, Equation (6) is used;
𝑆
𝑜𝑝=
2𝜋.𝐻𝑠(𝑔.𝑇𝑝2) (6)
For breaking waves condition, the equation for dimensionless overtopping discharge,
𝑄
𝑏 is measured using Equation (7).𝑄
𝑏=
𝑞 𝑔.𝐻𝑠3.
𝑆𝑜𝑝𝑡𝑎𝑛𝛼 (7)
For non-breaking waves condition, the equation for dimensionless overtopping discharge,
𝑄
𝑛 is as follow;𝑄
𝑏=
𝑞 𝑔.𝐻𝑠3(8)
The Hydraulic Power
The total hydraulic power or overtopping power for the overtopping device per unit width is calculated using Equation (9) [2];
𝑃
ℎ𝑦𝑑=
𝑁𝑅𝑒𝑠 .𝜌𝑔𝑞
𝑜𝑣,𝑗𝑅
𝑐,𝑗𝑗 =1 (9)
where;
𝑞
𝑜𝑣,𝑗 Represent as the mean overtopping discharge per unit width, entering the j th-reservoir,𝑅
𝑐,𝑗 Represents a wave crest height for the reservoir, measure vertically from the mean water level to j th-reservoir front peak, refer Figure 1,𝑁
𝑅𝑒𝑠 . Represents the total number of reservoirs in the SSG device.Conventional SSG Device
The numbers of studies carried out on the overtopping device is less compared to other wave energy extraction device. However, there is still a gap for improvement. This can be done by considering these four areas.
Ramp Cut
[image:3.595.53.288.532.669.2]The first aspect is the ramp cut. This ramp cut is defined as a vertical cut takes placed below the mean water level at the breakwater ramp area. It is present as
𝑑
𝑟 inError!
Reference source not found.. The previous study
conducted by Kofoed reveled that applying ramp cut on the overtopping device will cause a reduction in the mean wave overtopping discharge. This happens due to the high reflection effect as the incoming wave will have a high tendency to reflect the incoming wave direction. Thus, it will cause the incoming wave to break earlier before it starts to reach the reservoirs area. The statement was further proved by Kofoed based on the model testing in comparing the effect of both vertical ramp(𝑑
𝑟= 0.375)
ℎ
, and the non-vertical ramp (𝑑
𝑟= 1)
ℎ
, the result shows significant reduction on wave reflection effect for non-vertical ramp [2]. Thus, it improved hydraulic efficiency result by 5 percent.Fig. 1 Scheme of Conventional SSG (Side View) [1] Reservoir Height
The reservoir height is one of the most influential aspects in the mean overtopping discharge
𝑞
𝑜𝑣,𝑗 result. The height of the reservoirs are present in RC,1.,RC,2.,RC,3 as shown in Figure 1.In the year 2005, Kofoed has found out that lowering the reservoir height may produce significant increment in the
overtopping discharge. This happens due to a reduction in the hydraulic head level [2]. The results were proven based on the previous study conducted by Waal and Van der Meer [10] using an experimental approach. Although the test was slightly different where changes were made on water depth at the toe of the SSG structure,
𝐻
𝑚0,𝑡 instead of the reservoir height. However, the concept is still the same. This has been further proved by Kofoed [2] and Margheritini [6], where increasing in𝐻
𝑚0,𝑡 value may produce significant changesin increasing the
𝑞
𝑜𝑣,𝑗 value. The equation of spectral significant wave height at the structure toe is measured using Equation (10):𝑠
0𝑝=
𝐻𝑚 0,𝑡𝐿0𝑝
=
𝐻𝑚 0,𝑡 𝑔𝑇𝑝2
2𝜋
(10)
The
𝐿
0𝑝 is represents as a wavelength at the structure toe, measured in meters. From this equation, the value of𝐻
𝑚0,𝑡 is heavily influenced by a value of the wave steepness as mention in Equation (5) and Equation (6). However, in the real-world condition, the equation is less effective, especially for wave run-up process. This was proved by studies conducted by De Waal [11] and followed by Van der Meer [12] on the overtopping phenomena.Ramp Angle
The ramp angle represented as
𝛼
𝑟 in Figure 1 produces great influence to mean overtopping discharge result. The location of the ramp at the beginning of the wave energy device structure produce a significant effect in determining the wave breaking types. Depending on the ramp structure angle, a wave may break through spilling, collapsing, plunging or surging. Detail study was conducted by Kofoed [2] the most efficient ramp angle for the overtopping device is 19 degree. The selection was made based on three tested ramp angles, consisting of 19, 30 and 35 degrees. The final result shows an increment of 4 percent on the hydraulic efficiency. However, considering to structure survivability, the application of the 19-degree ramp angle may create a plunging wave breaking type. The impact is significant as the ramp structure may expose to heavy slamming effect as the wave break. Thus, the 35-degree angle was suggested by Kofoed to resists and later improves the wave run-up level, suitable for overtopping wave energy device application as mentioned by LeMéhauté [13] and Kofoed [4].Overtopping Front Design
The latest study was carried out by Mustapa [1] on the overtopping front design. Four design was proposed consisting of the V-shape, Bridge V-shape, Concave and Convex as shown in Figure 2, 3, 4 and 5 respectively.
Fig. 2 Isometric view of V-shape (model scale value) [1] The idea was initially triggered from previous flat overtopping front design used by Kofoed [2], Vicinanza [14][15], and Margeratini [16]. The purpose of using this flat overtopping front design is to resist heavy slamming impact acting on the overtopping structure. In addition, it was also triggered by the rough sea condition recorded at the Norwegian Sea which normally at the significant wave height of 1.54 to 3.35 meter with 6.1 to 10.6 second wave period [17]. The proposed designs by Mustapa was targeting to improve the trapping water amount in the multi-stage reservoir for single wave propagation. The idea is to redirect incoming wave toward a narrow channel. In theory, this will help to concentrate the incoming flow and thus may potentially increase the run-up level on the overtopping front. Thus, may potentially increase device performance.
Fig. 3 Isometric view of Bridge V-shape (model scale value) [1]
[image:4.595.275.545.400.831.2]Fig. 4 Isometric view of Concave (model scale value) [1]
Fig. 5 Isometric view of Convex (model scale value) [1]
This theory was proven by the simulation work carried out by Mustapa [1], where the concentrated overtopping front design produces far most efficient compared to previous flat overtopping front design used by the SSG device. For small and moderate wave conditions bellow 3.35 meter, the hydraulic power recorded by the V-shape design has improved to 56.9 kW compared to 34.1 kW as produced by the SSG design, measured at the full-scale value. However, as a wave height exceeding 3.35 meter, the Concave design is recommended.
Breakwater Front Design Overview
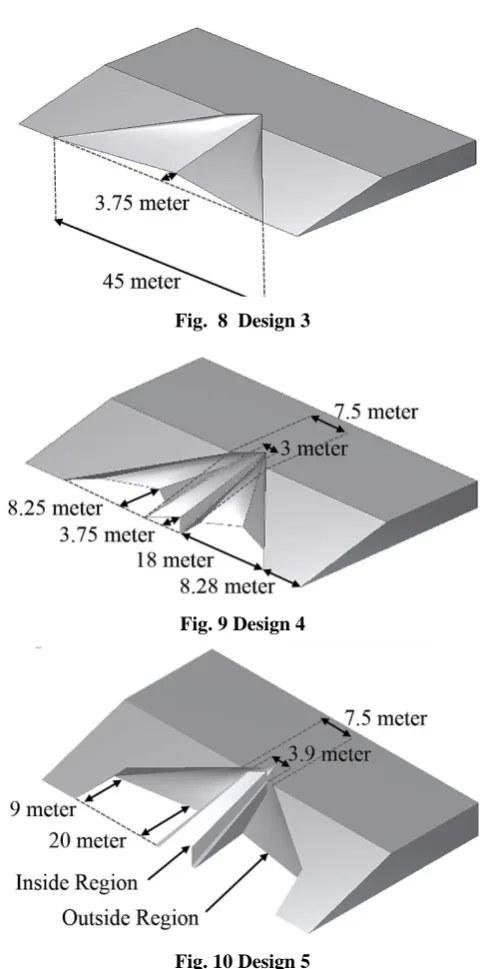
The improvement on the multi-stage overtopping device is continued through modification of the breakwater front design. The study was carried out as a follow-up to previous overtopping front design study, carried out by Mustapa [1]. The objective is to further improve the energy extraction performance for small and moderate wave condition below 3.35 meter. Thus, the V-shape design model shown in Figure 1 was chosen as the overtopping front design. Five different designs were proposed and represent as Design 2, 3, 4 and 5 shown in Figure 7 to Figure 10 respectively, given in full-scale value. The idea is inspired by the basic wave and seabed interaction, which normally occur in the shoreline area. In addition, to further improve device performance, dual run-up concept was proposed and realized by first separating the incoming wave at several channels as implemented in Design 4 and Design 5, shown in Figure 9 and 10 respectively.
Fig. 6 Basis breakwater ramp
Fig. 8 Design 3
[image:5.595.305.545.145.280.2]Fig. 9 Design 4
Fig. 10 Design 5
The basis breakwater ramp design as shown in Figure 6 is used in representing the SSG device and also as a benchmark throughout this study.
III. PURPOSEOFTHEPRESENTWORK
The purpose of the present work is to find an optimum breakwater front design for the multistage overtopping device. The numerical study was carried using a downscale model at 1:15 ratio. The conversion was made using Froude scaling method. The modification work was conducted referring to basis SSG design as proposed by Kofoed [2], including the level of reservoirs height with 0.15 meter, 0.22 meter and 0.31 meter for Rc3, Rc2 and Rc1 respectively, given in 1:15 downscale value and 19 degrees of no-breakwater ramp cut application. The opening width for the reservoir is maintained at 0.5 meters together with the breakwater structure opening at 4 meters. The V-shape design was chosen as the overtopping front design as the performance shown in harvesting small and medium wave height below 3.35 meter as previously studied by Mustapa [1]. In order to mimic the smallest wave height in Malaysia, the
tests were carried out using 2.8 meters of significant wave height and 9.3 seconds of wave period, given in full-scale value. For this study, only one overtopping event was considered to measure the mean overtopping discharge result. The reason is to preliminarily access a result related to overtopping event. The final model arrangement is illustrated in Figure 11.
Fig. 11 Full test arrangement, 1:15 model scale value The arrangement of the test for the entire structure of the
overtopping and breakwater structure is similar to the previous study conducted by Mustapa [1]. The main reason is to mimic an exact optimum dimension as use by Mustapa [1] for final result comparison. The only changes are made on the breakwater front design. Figure 11 shows the integration between the V-shape overtopping front with breakwater Design 3, given in full-scale value. The water deep in simulation work was fixed at 0.4 meters for the entire test.
The 3D CFD simulation was used and the Flow-3D software was chosen for this study. The distance between the breakwater sidewall and the flume sidewall is 1.38 meter, referring to optimum distance as previously studied by Mustapa [1]. The main reason is to avoid unwanted interaction that can cause wave reflection in-front of the test model. The tests were carried out using 2.8 meters of significant wave height and 9.3 second wave period, given in full scale. The arrangement of the full-wave tank is shown in Figure 12.
[image:5.595.310.546.554.690.2]the breakwater foot. In addition, this can avoid collision between reflected wave and the generated a wave in front of the wave paddle. This additional distance allows four-wave to travel simultaneously while the simulation is running. The remaining wave was later absorb using passive slope system placed at the back to the breakwater structure. This help to avoid remaining wave from travelling back to the breakwater structure, creating standing or destructive interference of wave. For this study, only one overtopping event is considered. Final simulation result will be shown in the overtopping rate recorded at the individual reservoir,
𝑞
𝑛.
Next, the potential energy stored in the reservoir is individually calculated based on Equation 4. At the end of this study, the total power is calculated by summing all the potential energy recorded from three reservoirs. The results are later compared with basis breakwater ramp design as shown in Figure 6.IV. CFDSIMULATIONS
The Flow-3D software is chosen in this research to mimic the previous study conducted by Mustapa [1]. The 3D Navier-Stokes (NS) equations are used as a basis to model the conservation of mass and momentum in solving a wave interaction problem. This software uses Reynolds Averaging of the Navier-Stokes (RANS) equation to solve the Navier Stokes Equation. Because this research focusing to solve the free surface problem, the Volume-of-Fluid (VOF) technique is used. This is in order to track the movement of fluid-particle as interaction occurs. This technique defines fluid configuration as F (x,y,z,t).
[image:6.595.366.490.158.351.2]The first step before defining the wave and structure interaction is to set the working boundary. In this study, the fixed structure of the wave flume is first defined. The initial condition of fluid at the entire flume area is set to sit at rest where are no changes in water depth and no development of wave. Second, the boundary condition at each corner of the working boundary is defined. The incoming wave location is set as wave boundary type represents as WV. The sidewall of the flume and the flume floor are set as a wall, represents as W. The end side of the flume is set as an Output, represents as O. The top side of the flume is set as specified pressure, represents as P. Finally, the wave energy device area are set as continuative, represents as C. The final setup for boundary condition is shown in Figure 13.
Fig. 13 Boundary condition for simulation
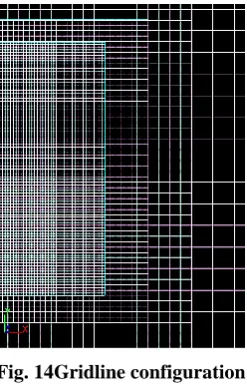
This study uses four different sizes of the grid line. The reason is to control the meshing quality, especially at the wave energy device area. In addition, these four different mesh sizes also help to reduce the time taken for simulation to complete. The configuration of the four different grid line size is shown in Figure 14. In other words, small meshing size will produce a higher mesh element number. Thus, it will cause the simulation to end much longer. However, the result produced is much accurate.
Fig. 14Gridline configuration
For this study, the mesh size value is similar as previously used by Mustapa [1]. The same 5.68 million mesh element was used, presenting an optimum mesh number for the overtopping device.
Next, the incoming wave number will be set to one. The main reason is to avoid unwanted disturbance, creates by the next incoming wave. This is in order to control wave breaking behaviour on the proposed dual run-up concept for the breakwater ramp. The calibration work is carried out by placing a wave probe in front of the breakwater ramp area as the location of interest during the overtopping study is at the breakwater toe area [18]. Finally, the model test is continued for all proposed breakwater front design.
V. RESULTSANDDISCUSSION
The simulation work was carried out by testing all five breakwater ramp design. The optimum mesh element number and the optimum distance between the breakwater and the flume wall were taken referring to previous research conducted by Mustapa [1], which is 7.3 million and 1.38 meter respectively given in 1:15 downscale.
Breakwater Front Design
[image:6.595.51.289.581.744.2]design used by Kofoed [2]. Next, the proposed Design 2 shows significant improvement especially on the amount of trapping water at all three stages of reservoirs.
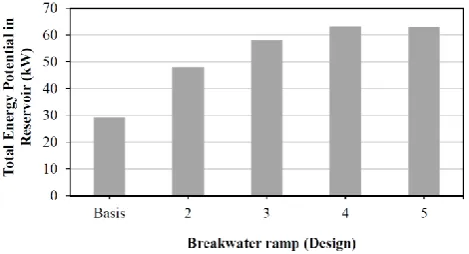
[image:7.595.52.287.392.519.2]Fig. 15 Potential Energy Stored at Each Reservoir Based on Figure 15, the potential energy at the lowest R3 or Rc3, middle R2 or RC2 and highest reservoirs R1 or RC1, shows improvement by 40 percent, 53 percent and 17 times larger respectively. Detail result for each design is shown in Table 1. For lowest reservoir, the result has improved from 2.82 kW/m as recorded on basis breakwater ramp to 4.23 kW/m recorded on Design 2. For the middle reservoir, the potential energy produces significant improvement from 1.05 kW/m to 1.80 kW/m. Finally, the most impressive result was recorded by the highest reservoir as it improved from 0.02 kW/m to 0.36 kW/m. Thus, the final energy has improved from 29.14 kW/m to 47.94 kW/m as shown in Figure 16.
Fig. 16 Total Potential Energy Stored in Reservoir Further improvement of Design 2 has been carried out, represented as Design 3. The main focus is to increase the opening width of the breakwater front from 7.5 meters as used in Design 2 to 45 meters as proposed in Design 3, given in actual scale. From Figure 15, it shows that the lowest reservoir produces significant improvement with 37 percent compared to Design 2. However, reduction on potential energy potential was recorded at the middle and highest reservoir with 14 percent and no overtopping was recorded, respectively. From the fluid and structure interaction, Design 3 has the ability to gather incoming wave and redirect the flow toward the overtopping front area but still lack to produce higher run-up. This brings to the new proposed breakwater ramp of Design 4.
The combination of Design 2 and Design 3, representing Design 4 was proposed to further improve the run-up level. From Figure 15, the improvement at lowest and middle reservoirs are by 9 and 7 percent, respectively compared to
Design 3. Finally, Design 5 was proposed and the idea was taken based on dual run-up concept. First, the incoming waves were gathered in front of the overtopping ramp and later, the next incoming wave will push the gathering wave to allow higher run-up at the overtopping ramp. This can be done by aligning both outside and inside the breakwater region at a certain distance as shown in Figure 10. The result in Figure 15 shows that the improvement was recorded only at the lowest reservoir. The result is expected because the breakwater-outside region was not fully utilized as the incoming wave is not fully directed toward the overtopping ramp as previous experience in Design 4. Considering the total energy potential result, Design 5 produces a small reduction from 63.26 kW as recorded in Design 4 to 63.05 kW. The result given has approved the effectiveness of the dual run-up concept in wave energy application.
Table. 1 Breakwater ramp design result, in full-scale value
[image:7.595.309.548.516.648.2]Based on the dual run-up concept, both structures play a significant role to control the incoming wave speed. This was achieved as a wave start to lose its speeds as it starts to interact with the seafloor. As applied on Design 5, the incoming wave at the inside region will start to lose its speed earlier than the wave at the outside region. This happens as the interaction between incoming waves and the breakwater toe occurs earlier at the inside region compared to the outside region. The result helps to control the wave interaction behaviour on the overtopping ramp. Finally, it proved the dual run-up concept and the ability to first gathered the wave and later the next incoming wave will push the gathering wave up-higher on the overtopping ramp as shown in Figure 17.
Fig. 17 Maximum wave run-up on Breakwater Design 5 VI. CONCLUSION
The final study on the breakwater ramp design has been carried out and the results show positive improvement compared to basis breakwater ramp design used in SSG. The proposed dual run-up concept shows the impressive result in tuning the incoming wave speed. In this study, Design 5 shows significant improvement at almost 73 percent for the total energy potential compared to basis breakwater ramp design. The design 5 has managed to produce 63.05 kW of total energy potential compared to 29.14 kW as produced by the basis breakwater ramp, given in full-scale value. Thus, at the small wave height of 2.8 meters and 9.3 seconds, Design 4 and Design 5 is recommended. Further research can be made by applying the reflector application to further improve the run-up level on the overtopping ramp.
ACKNOWLEDGMENT
Special thanks to Universiti Teknologi Malaysia (UTM) and the Ministry of Education Malaysia for funding this project under Look East Policy Vote No: 4L152
REFERENCES
1. M. A. Mustapa, O. B. Yaakob, Y. M. Ahmed, and K. K. Koh, “Numerical Simulation of the Ramp Design of a Multistage Overtopping Wave Energy Breakwater Hybrid Device,” in International Conference on Ocean, Mechanical and Aerospace for Scientists and Engineers, 2016, pp. 9–18.
2. J. P. Kofoed, “Model Testing of the Wave Energy Converter Seawave Slot-Cone Generator,” Hydraul. Coast. Eng. No .18, 2005.
3. B. J. Larsen and J. P. Kofoed, “Model Test Setup and Program for Experimental Estimation of Surface Loads of the SSG Kvitsøy Pilot Plant from Extreme Wave Conditions,” Civ. Eng., no. phase 4, 2005. 4. J. P. Kofoed, “Wave Overtopping of Marine Structures - Utilization of
Wave Energy,” PhD Thesis, Aalborg University, 2002.
5. J. P. Kofoed, “Model study of overtopping of marine structures for a wide range of geometric parameters,” in The 27th International Conference on Coastal Engineering : ICCE 2000, 2000.
6. L. Margheritini, D. Vicinanza, and P. Frigaard, “Sea Slot Cone Generator Overtopping Performance in 3D Conditions,” in ISOPE-International Offshore and Polar Engineering Conference. Proceedings, 2008, p. 18.
7. M. Buccino, D. Vicinanza, F. Ciardulli, M. Calabrese, and J. Peter, “Wave Pressures and Loads on a Small Scale Model of the Svåheia SSG pilot project,” in 9th European Wave and Tidal Energy Conference, 2011, pp. 1–7.
8. L. Margheritini, V. Stratigaki, and P. Troch, “Geometry Optimization of an Overtopping Wave Energy Device Implemented into the New Breakwater of the Hanstholm Port Expansion,” in International Offshore and Polar Engineering Conference, 2012, pp. 593–600.
9. J. W. Van der Meer and W. Janssen, “Wave run-up and wave overtopping at dikes and revetments,” 1994.
10. J. W. Van der Meer and W. Janssen, Wave run-up and wave overtopping at dikes. Wave Forces on Inclined and Vertical Wall Structures, vol. 485. 2015.
11. J. . de Wall and J. . van der Meer, “Wave runup and overtopping on coastal structures,” in Proceedings of the twenty-third coastal engineering conference, 1992, pp. 1758–1771.
12. J. W. Van der Meer, Wave run-up and overtopping. Dikes and Revetments: Design, Maintenance and Safety Assessment, ed. KW Pilarczyk (AA Balkema, Rotterdam, The Netherlands). A.A. Balkema, 1998.
13. L. Méhauté, R. C. Y. Koh, and L. Hwang, “A Synthesis on Wave Run-Up,” J. Waterw. Harb. Div., vol. 94, no. 1, pp. 77–92, 1968. 14. L. Margheritini, D. Vicinanza, and P. Frigaard, “SSG wave energy
converter: Design, reliability and hydraulic performance of an innovative overtopping device,” Renew. Energy, vol. 34, no. 5, pp. 1371–1380, May 2009.
15. D. Vicinanza, P. Contestabile, Q. H. N. Jørgen, and T. Lykke Andersen, “Innovative rubble mound breakwaters for overtopping wave energy conversion,” Coast. Eng., vol. 88, pp. 154–170, Jun. 2014.
16. L. Margheritini, L. Victor, J. P. Kofoed, and P. Troch, “Geometrical Optimization for Improved Power Capture of Multi-level Overtopping Based Wave Energy Converters,” Isope, vol. 1. International Society of Offshore and Polar Engineers, Osaka, Japan, pp. 339–344, 01-Jul-2009. 17. M. A. Mustapa, “Wave Energy Converter-Breakwater System for Low
Wave Energy Shorlines,” Universiti Teknologi Malaysia, 2018. 18. L. Franco, J. Geeraerts, R. Briganti, M. Willems, G. Bellotti, and J. De
![Fig. 1 Scheme of Conventional SSG (Side View) [1]](https://thumb-us.123doks.com/thumbv2/123dok_us/8172111.252292/3.595.53.288.532.669/fig-scheme-conventional-ssg-side-view.webp)
![Fig. 5 Isometric view of Convex (model scale value) [1]](https://thumb-us.123doks.com/thumbv2/123dok_us/8172111.252292/4.595.275.545.400.831/fig-isometric-view-convex-model-scale-value.webp)