Abstract: This paper proposes Object Based Image Retrieval (OBIR) System with segmenting the objects from the images and then extracting various features from the objects. The objects are the most prominent part of an image which relates more to the human perception. First, the object present in the images is segmented by four different segmentation techniques such as K-means, Active Contours, Edge-Convex hull and Global Thresholding. Later, the color features such as Color Histogram (CH) and Color Coherence Vector (CCV), Texture feature using Local Binary Patterns (LBP) and shape feature using Histogram of Gradients (HOG) are extracted. Finally, with the usage of different segmentation and techniques mentioned above feature are extracted from objects. Results obtained are tabulated and performance study is made.
Keywords: OBIR, Color histogram, Color Coherence Vector and Local Binary Patterns and Histogram of Gradients.
I. INTRODUCTION
The enormous development of Internet contributes to the gigantic album of digital images. This vast gathering of images has lead to development of retrieval and storage systems. In 1970s, the retrieval systems were started with text annotation. Due to the intricacy in image annotation, in the early on 1980s retrieval of images started by the visual content of the images which are termed as content-based image retrieval (CBIR) systems. The majority of CBIR systems paying attention on local and global low level feature extraction methods, most of these considered texture, color, shape and spatial locations as properties of whole image. Blindly extracting the features of whole image will increase the complexity and does not always expose high level concepts (semantics) in the user intelligence. This mismatch between the statistical content of the image and perception of the image termed as semantic gap. In order to address this issue some of the researcher considered features of the objects present in the images for the retrieval. These systems are called as Object based image retrieval (OBIR) systems. The OBIR is processes of retrieving the images based on the properties or features of the segmented objects present in the image.
Revised Manuscript Received on December 12, 2019. Correspondence Author
Laxmidevi Noolvi, CSE, RNSIT, Bangalore, India. Email:
Dr. M V Sudhamani, ISE, RNSIT, Bangalore, India. Email: [email protected]
Plenty of work has been done by the researcher in the field of CBIR and OBIR. Most of the researcher has concentrated on the global features such as texture, shape and color of an entire image as features [7, 17]. In some of the work due to the lack of represent ability of global features they have moved to local features [9]. Where in local properties of the image such as corner points, block level features are used for retrieval [5]. In many of the work researcher have used the combination of the features for content based retrieval of images from huge image database. In [6], provides the image retrieval system based on the objects by the fusion of BEMD edge features with the histogram of gradients (HOG) as features. In [3], edges of the images are detected by BEMD and histogram with 64 bins is calculated as gray features and 32 bin color histogram is captured. Later, the combined feature vector of above feature set for the efficient retrieval of images.
In [2], used Color Coherence Vector (CCV) features and geometric shape features such as mass, center of gravity, bending energy and circularity ratio etc…. In [14], applied the Discrete Wavelet Transform (DWT) on the gray image and got the coefficients matrix. The histogram of gradients (HOG) descriptors for each detailed coefficients are captured on horizontally, vertically and diagonally. These three vectors of features are combined and used for retrieval of images. In [16], work used the spatial color coefficients, shapes description and object detection. Then the condensed and strong feature vector is indexed and retrieved with
bag-of-words concepts. The systems efficiency is
experimented with the 10 benchmark datasets.
In [8], the paper provides novel technique that relies on extraction of Maximally Stable Extreme Regions (MSER) feature descriptors and Speeded up Robust Features (SURF) along with color features such as enhanced Color Coherence
Vector (CCV) and Color Correlogram. These
multidimensional features are feed to Bag-of-features (Bof) technique in order to quantize the feature vector. Later, classifier such as multiclass Support Vector Machine (SVM) used to classify images.
In this paper we provide object based image retrieval system with segmentation of objects from the background then extracting various features. In specific we have used four different segmentation approaches such as K-means, Active Contours, Edge-Convex hull and Global Thresholding [18].
Object based Image Retrieval with Segmentation
and Extraction of Features using various
Methods
Later on, the Features such as Color Histogram (CH), Color Coherence Vector (CCV), Local Binary Patterns (LBP) and Histogram of Gradients (HOG) are extracted. These features are separately extracted from the each segmented objects with all different segmentation methods.
The paper organization is as follows. The segmentation techniques used for segmenting objects are discussed in Section 2. The Feature extraction methods applied are explained in Section 3. The proposed system architecture is discussed in section 4. In section 5 the experimental results are discussed, finally the conclusions and future works given in Section 6.
II. OBJECTSEGMENTATIONTECHNIQUES
In this paper, we use four algorithms for object segmentation which are suitable for object based image retrieval systems which are discussed in our previous paper [18]. In order to provide continuity we discuss the methods briefly here.
A. Global Threshold based object segmentation with region
area filtering
Threshold based segmentation can be global and local, in the former method which uses the single value for isolating objects from background and in the later method multiple threshold values are used to group the pixel values into different regions. In the proposed system we use global thresholding method. The global thresholding general equation is given in (1).
G is original gray image, x and y are coordinates, T is threshold value, B is binary image after applying threshold, where 1 represents object pixels and 0 represents background pixels. The resultant image may contain holes inside object region. In order to get whole object region we have to post process the results to integrate the objects regions to one unit by simple image filling operations where holes in the threshold image are filled with white pixel values. At last in order to localize the object we find the region with maximum area as object of interest because objects have larger number of pixels as compared to small redundant regions in an image.
B. Edge based object segmentation with convex hull
The second algorithm we add novelty to object segmentation by detecting the edges using canny edge detector followed by convex hull formation for edge pixels. This convex hull it forms the compaction around the object and gives the polygon representation of objects in images.
C. K-means Image segmenting with Morphological
operations
The object segmentation is done using the k-means image segmentation and then post processing the results with morphological operations to get the whole object regions of
Where k is number of clusters, is cluster center value and intensity value at location x and y.
In the resultant image object pixels do not corresponds to homogeneous pixel values, it is because the k-means clustering method does not considers spatial information of pixels. It only does clusters based on intensity values of pixels. In other words similar pixel values does not always situated in one place in image they may be scattered but they are having same properties. Finally to get whole object pixels morphological region filling is applied on threshold image. Then maximum connected region is identified and localized as object of interest.
D. Active Contour Snake’s model for object segmentation.
Active contours are the new approach for the image segmentation. The mathematical representation of energy minimization function for active contour snakes is given in equation (3).
Contour is set of points,
Energy function of curve or snake is given in equation (4).
Where E is total energy of contour and is internal energy of contour represents elasticity. External energy of contour represents shape of the contour or stiffness. The detail and simplified formula for total energy function is given in equation (5).
In the equation (5), is relative weight factor and first term of summation corresponds to internal energy and second term is external energy of contour C. The and are gradient image in the x and y directions respectively hence they corresponds to edge information of image. The objective of snakes is to find the minimum value of E using gradient descent in order to iteratively locate final boundary of object present in an image. In this work the automatic initialization of initial boundary by drawing the convex hull around the object is done. Then we have applied the active contour snake method which will iteratively converge to the exact true boundary of object with the help of energy minimization function which is explained in equation (5).
III. FEATUREEXTRACTIONMETHODS
color is feature which is invariant to any transformations of image [3, 7]. An RGB image is having three planes namely red green and blue channels. In our method we have calculated the histogram with 16 bins for each color plane. Then we concatenated the three feature vectors of these color planes and formed the color histogram features vector (CH).
B. Color Coherence Vector (CCV)
Color Coherence Vector (CCV) [4, 7] is an enhancement for Color Histogram. It divides a color image into group of coherent and incoherent pixels. Coherent pixel are part of a large connected component (CC) where as incoherent pixel are part of a tiny connected component. The Figure 1 shows the simple calculation of CCV. Figure 1(a) Color image has 30 distinctive colors. Quantize the color image into n discrete color. Figure 1(b) Shows quantization of the colors into three color ranges as <10 (Between 0 to 9), <20 (Between 10 to 19) and <30 (Between 20 to 29). It is fundamental for grouping similar colors into single color representative. The Figure 1(c) shows the final CCV of features done using below steps.
1. Divide the pixels into coherent and incoherent pixels.
Finding connected components (CC) of Figure
1(b). Setting threshold value for each connected components to became coherent pixel group. (Normally, it is on 1% of image’s size), any connected component area is more than or equal to threshold then it is coherent otherwise it is incoherent.
If we consider threshold value is 4 for image in Figure 1(b) 2 CC for color 0 as well as for color 2 and 1CC for color 1.
2. For each two color groups (C and N). C coherent pixels.
N incoherent pixels.
(a) (b) (c)
Figure 1: Example of calculating the Color Coherence vector
C. Local Binary Patterns (LBP)
Local binary patterns capture texture properties of the image [10, 13, 14]. In our work we have divided the image into non-overlapping blocks of size 32 X 32. Then the LBP features are calculated on each block. The LBP features extraction uses 3×3 window of a gray image. In the window specified, all the 8 neighbor pixels are compared with center pixel value if the difference between the center pixel and the neighbor pixel is negative then that pixel value is assigned with zero value otherwise it is assigned with value 1. Later for each neighbors polynomial value corresponding to that place is multiplied. The equation for this is given in (6) and (7).
(7)
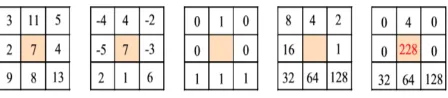
[image:3.595.316.540.173.222.2]Where n is number of neighbors, is pixel value of neighbors, is pixel value of center pixel in the window. The sample calculation of LBP feature is shown in the below Figure 2. The histogram of these features is calculated on each block and all the features are concatenated finally formed the one feature vector denoted as LBP.
Figure 2: Example of LBP calculation.
D. Histogram of Gradients (HOG)
The main purpose of using the HOG is to express the shape of an object by considering the gradient distribution and edge direction [6]. First, the gradient values are computed by filtering with gradient operators along vertical and horizontal direction. We divide an image into blocks [12], here block size is 32 × 32 and no overlapping is considered. Then for each block a histogram of edge directions is computed with 9 bins (directions). Later normalized histograms represent histogram of each block. Finally, concatenate histograms of all the blocks and formed HOG feature vector.
IV. PROPOSEDSYSTEMARCHITECTURE
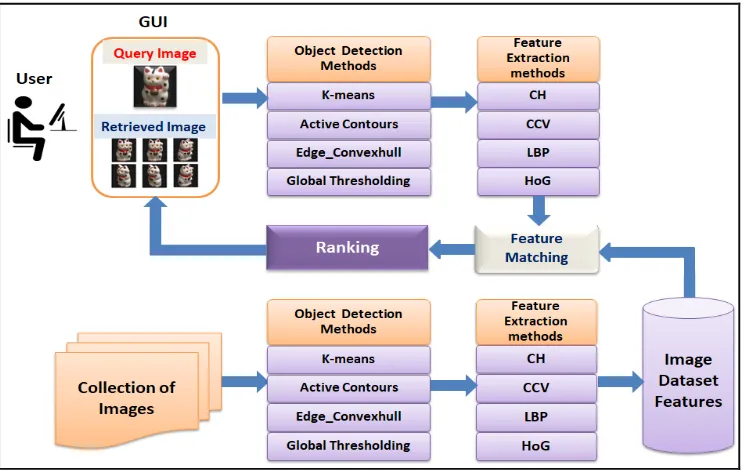
The OBIR system architecture is shown in Figure 3.The system can be explained in two phases, in the offline phase, first, we segment the object from the background using four different segmentation methods. Then features such as CH, CCV, LBP and HOG of images present in the repository are extracted then stored in the features database separately for each segmentation method. In the online phase, the query image is submitted through graphical user interface (GUI) by the user, the object is segmented and features vector of a query image are extracted in the similar manner as in the offline phase. The features of the query image are matched with the features in the database using similarity measures. In this work we have computed the similarity using the Euclidian distance measure and the images are ranked from highest to lowest in the range 0 to 1, here 1 corresponds to most similar and 0 is least similar image. Finally, the resultant images are retrieved.
V. EXPERIMENTALRESULTSANDDISCUSSION
[image:3.595.42.291.283.549.2]Figure 3: Proposed System Architecture.
In order to measure the performance of the system precision and recall parameters are used. Precision (P) which indicates percentage of relevant results, which is fraction of Total number of Similar images Retrieved (TSR) to the Total Images Retrieved (TIR) by the system. The equation is given (8).
Recall (R) indicates the percentage of total relevant results which are correctly retrieved by our system, which is ratio of Total number of Similar images Retrieved (TSR) and Total Images present in the Database (TID). The equation is given (9).
A. Experiment - I
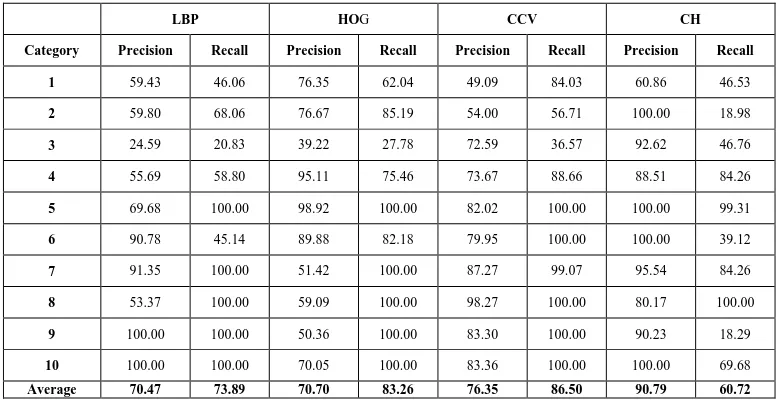
In the experiment –I, for all images in the repository object is detected using k-means segmentation (KM) method. The four feature extraction methods are applied and feature vectors are stored in the features database separately for each feature extraction method. Later, for each query image the retrieval performance is tabulated. The Table 1 shows the precision and recall of 10 category images for KM method.
B. Experiment - II
In the experiment –II, for all images in the repository object is detected using Active contours (AC) segmentation method. The same procedure is followed for feature extraction as explained in experiment- I. Later, for each query image the retrieval performance is tabulated. The Table 2 shows the precision and recall of 10 category images for AC method.
C. Experiment - III
In the experiment –III, for all images in the repository
[image:4.595.307.546.354.469.2]image the retrieval performance is tabulated. The Table 3 shows the precision and recall of 10 category images for EC method.
Figure 4: Ten different categories of images.
D. Experiment - IV
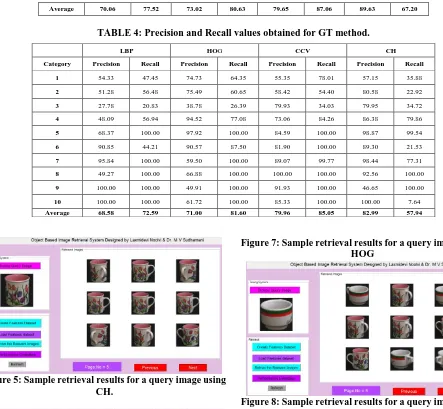
In the experiment –IV, for all images in the repository object is detected using Global Thresholding (GT) segmentation method. The same procedure is followed for feature extraction as explained in experiment- I. Later, for each query image the retrieval performance is tabulated. The Table 4 shows the precision and recall of 10 category images for GT method.
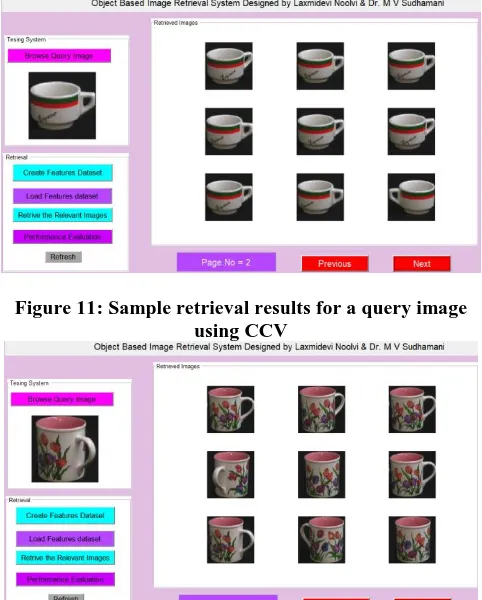
Here we observed in all the experiments that precision value for LBP features is low and for Color histogram it is high. The CCV and HOG are in between these two sets of results. As the objects contain not much of the texture patterns and performed low with LBP. In contrast to this color and shape of the object plays a very much important role in retrieval of the objects. The recall value also increased for first 3 sets of features and obtained comparatively less value for CH features. Figure 5-12 shows the retrieval results for the different query images.
VI. CONCLUSIONANDFUTUREWORK
With the help of these methods four types of features were extracted. Various experiments were conducted with segmentation and using features one by one. We have obtained that, with the K-means method of segmentation CH has 90.79 precision which is comparatively highest than other
[image:5.595.103.493.133.337.2]methods and it can be appropriate for object retrieval. Later, in future this work can be enhanced with the help of combination of features and also with different efficient features.
TABLE 1: Precision and Recall values obtained for KM method.
LBP HOG CCV CH
Category Precision Recall Precision Recall Precision Recall Precision Recall
1 59.43 46.06 76.35 62.04 49.09 84.03 60.86 46.53
2 59.80 68.06 76.67 85.19 54.00 56.71 100.00 18.98
3 24.59 20.83 39.22 27.78 72.59 36.57 92.62 46.76
4 55.69 58.80 95.11 75.46 73.67 88.66 88.51 84.26
5 69.68 100.00 98.92 100.00 82.02 100.00 100.00 99.31
6 90.78 45.14 89.88 82.18 79.95 100.00 100.00 39.12
7 91.35 100.00 51.42 100.00 87.27 99.07 95.54 84.26
8 53.37 100.00 59.09 100.00 98.27 100.00 80.17 100.00
9 100.00 100.00 50.36 100.00 83.30 100.00 90.23 18.29
10 100.00 100.00 70.05 100.00 83.36 100.00 100.00 69.68
Average 70.47 73.89 70.70 83.26 76.35 86.50 90.79 60.72
TABLE 2: Precision and Recall values obtained for AC method.
LBP CCV HOG CH
Category Precision Recall Precision Recall Precision Recall Precision Recall
1 56.72 45.83 50.54 83.80 72.53 61.34 64.07 50.69
2 54.61 65.28 56.06 58.56 70.09 85.19 89.39 24.07
3 32.65 22.22 77.71 31.48 57.50 31.94 92.63 57.64
4 47.21 57.18 73.61 87.50 95.03 80.79 85.03 83.80
5 71.45 100.00 77.89 100.00 98.72 100.00 100.00 99.54
6 87.14 51.85 80.72 100.00 86.33 76.39 100.00 66.90
7 95.26 99.77 88.15 97.45 66.21 100.00 95.77 86.11
8 52.17 100.00 99.77 100.00 63.21 100.00 80.61 100.00
9 100.00 100.00 79.83 100.00 69.20 100.00 100.00 7.41
10 100.00 100.00 82.53 100.00 99.55 100.00 100.00 90.97
Average 69.72 74.21 76.68 85.88 77.84 83.56 90.75 66.71
TABLE 3: Precision and Recall values obtained for EC method.
LBP HOG CCV CH
Category Precision Recall Precision Recall Precision Recall Precision Recall
1 56.03 45.60 74.38 61.81 51.76 84.95 59.35 47.45
2 52.64 63.43 61.75 66.90 61.15 56.71 86.73 24.54
3 29.82 23.61 40.43 26.39 79.71 35.19 93.14 50.23
4 58.86 60.88 94.64 75.23 82.73 94.44 82.60 87.27
5 70.83 100.00 98.33 100.00 77.69 100.00 99.32 99.77
6 81.33 81.94 90.54 75.93 86.14 100.00 100.00 74.77
7 96.51 99.77 72.18 100.00 89.50 99.31 92.70 84.03
8 54.53 100.00 63.03 100.00 98.92 100.00 82.46 100.00
9 100.00 100.00 51.79 100.00 84.48 100.00 100.00 10.19
Average 70.06 77.52 73.02 80.63 79.65 87.06 89.63 67.20
TABLE 4: Precision and Recall values obtained for GT method.
Figure 5: Sample retrieval results for a query image using CH.
Figure 6: Sample retrieval results for a query image using CCV.
Figure 7: Sample retrieval results for a query image using HOG
Figure 8: Sample retrieval results for a query image using LBP.
Figure 9: Sample retrieval results for a query image using CH.
Figure 10: Sample retrieval results for a query image using LBP
LBP HOG CCV CH
Category Precision Recall Precision Recall Precision Recall Precision Recall
1 54.33 47.45 74.73 64.35 55.35 78.01 57.15 35.88
2 51.28 56.48 75.49 60.65 58.42 54.40 80.58 22.92
3 27.78 20.83 38.78 26.39 79.93 34.03 79.95 34.72
4 48.09 56.94 94.52 77.08 73.06 84.26 86.38 79.86
5 68.37 100.00 97.92 100.00 84.59 100.00 98.87 99.54
6 90.85 44.21 90.57 87.50 81.90 100.00 89.30 21.53
7 95.84 100.00 59.50 100.00 89.07 99.77 98.44 77.31
8 49.27 100.00 66.88 100.00 100.00 100.00 92.56 100.00
9 100.00 100.00 49.91 100.00 91.93 100.00 46.65 100.00
10 100.00 100.00 61.72 100.00 85.33 100.00 100.00 7.64
[image:6.595.64.507.48.457.2]Figure 11: Sample retrieval results for a query image using CCV
Figure 12: Sample retrieval results for a query image using HOG.
REFERENCES
1. Ravani, Reza, Mohamad Reza Mirali, and Maryam Baniasadi. "Parallel CBIR system based on color coherence vector." 17th International Conference on Systems, Signals and Image Processing, 2010. 2. Chaudhari, Reshma, and A. M. Patil. "Content based image retrieval
using color and shape features." International Journal of Advanced Research in Electrical, Electronics and Instrumentation Engineering, 2012.
3. Shrinivasacharya, Purohit, and M. V. Sudhamani. "Content based image retrieval by combining median filtering, BEMD and color technique." Proceedings of International Conference on Advances in Computing. Springer, New Delhi, 2013.
4. Meryem Salmi and Bachir Boucheham, “Content Based Image Retrieval Based on Cell Color Coherence Vector (Cell-CCV)” IEEE, 2014. 5. Patel, Ami M., and Rikin Thakkar. "Object based image retrieval from
database using local and global features." International Journal of Innovative Research in Technology, 2015.
6. Kavitha, H., and M. V. Sudhamani. "Content-based image retrieval using edge and gradient orientation features of an object in an image from database." Journal of Intelligent Systems, 2016.
7. Zhijie Zhao, Qin Tian et. al “Content Based Image Retrieval Scheme using Color, Texture and Shape Features.” International Journal of Signal Processing, Image Processing and Pattern Recognition , 2016. 8. Heba A. Elnemr “Combining SURF and MSER along with Color
Features for Image Retrieval System Based on Bag of Visual Words,” Journal of Computer Sciences, 2016.
9. Ceyhun Celik, Hasan Sakir Bilge. “ Content based image retrieval with sparse representations and local feature descriptor : A comparative study.” Pattern Recognition, 2017.
10. A obulesu, V Vijaykuma, et. al. Region based image retrieval using ranking concept of local binay patterns.” InternationalConference On Big Data Analytics and computationalIntelligence (ICBDACI), IEEE, 2017
11. Kavitha, H., and M. V. Sudhamani. "Experimental analysis of SIFT and SURF features for multi-object image retrieval." International Journal of Computational Vision and Robotics, 2017.
12. Desai, Rupali, and Bhakti Sonawane. "Gist, HOG, and DWT-based content-based image retrieval for facial images." Proceedings of the International Conference on Data Engineering and Communication Technology. Springer, Singapore, 2017.
13. Yu, Laihang, et al. "Multi-trend binary code descriptor: a novel local texture feature descriptor for image retrieval." Signal, Image and Video Processing , 2018.
14. Srivastava, Prashant, and Ashish Khare. "Content-Based Image Retrieval Using Multiresolution Feature Descriptors." Recent Advances in Computer Vision. Springer, Cham, 2019.
15. Latif, Afshan, et al. "Content-based image retrieval and feature extraction: a comprehensive review." Mathematical Problems in Engineering, 2019.
16. Ahmed, Khawaja Tehseen, Shahida Ummesafi, and Amjad Iqbal. "Content based image retrieval using image features information fusion." Information Fusion, 2019.
17. AfshanLatif, et. al. “Content-Based Image Retrieval and Feature Extraction: A Comprehensive Review.” Mathematical Problems in Engineering, 2019.
18. Laxmidevi Noolvi, Hema N, Dr. M. V. Sudhamani. “Evaluation of Object Segmentation Techniques for object Based Image Retrieval.” unpublished.
AUTHOR PROFILE
Mrs. Laxmidevi Noolvi, she is currently pursuing her Ph.D degree in the department of Computer science and Engineering, RNSIT, Bangalore.
[image:7.595.48.289.52.352.2]