https://doi.org/10.5194/angeo-36-1457-2018 © Author(s) 2018. This work is distributed under the Creative Commons Attribution 4.0 License.
Morphology of GPS and DPS TEC over an equatorial station:
validation of IRI and NeQuick 2 models
Olumide Olayinka Odeyemi1, Jacob Adeniyi2, Olushola Oladipo3, Olayinka Olawepo3, Isaac Adimula3, and
Elijah Oyeyemi1
1Department of Physics, University of Lagos, Lagos, Nigeria
2Department of Physical Sciences, Landmark University, Omu-Aran, Nigeria 3Department of Physics, University of Ilorin, Ilorin, Nigeria
Correspondence:Olumide Olayinka Odeyemi ([email protected])
Received: 2 June 2018 – Discussion started: 8 June 2018
Revised: 19 September 2018 – Accepted: 10 October 2018 – Published: 24 October 2018
Abstract. We investigated total electron content (TEC)
at Ilorin (8.50◦N 4.65◦E, dip lat. 2.95) for the year 2010, a year of low solar activity in 2010 with Rz=
15.8. The investigation involved the use of TEC derived from GPS, estimated TEC from digisonde portable sounder data (DPS), and the International Reference Ionosphere (IRI) and NeQuick 2 (NeQ) models. During the sunrise period, we found that the rate of increase in DPS TEC, IRI TEC, and NeQ TEC was higher compared with GPS TEC. One reason for this can be attributed to an overestimation of plasmas-pheric electron content (PEC) contribution in modeled TEC and DPS TEC. A correction factor around the sunrise, where our finding showed a significant percentage deviation be-tween the modeled TEC and GPS TEC, will correct the dif-ferences. Our finding revealed that during the daytime when PEC contribution is known to be absent or insignificant, GPS TEC and DPS TEC in April, September, and December pre-dict TEC very well. The lowest discrepancies were observed in May, June, and July (June solstice) between the observed values and all the model values at all hours. There is an over-estimation in DPS TEC that could be due to extrapolation error while integrating from the peak electron density of F2 (NmF2) to around∼1000 km in the Ne profile. The under-estimation observed in NeQ TEC must have come from the inadequate representation of contribution from PEC on the topside of the NeQ model profile, whereas the exaggeration of PEC contribution in IRI TEC amounts to overestimation in GPS TEC. The excess bite-out observed in DPS TEC and modeled TEC indicates over-prediction of the fountain effect in these models. Therefore, the daytime bite-out observed
in these models requires a modifier that could moderate the perceived fountain effect morphology in the models accord-ingly. The daytime DPS TEC performs better than the day-time IRI TEC and NeQ TEC in all the months. However, the dusk period requires attention due to the highest percent-age deviation recorded, especially for the models, in March, November, and December. Seasonally, we found that all the TECs maximize and minimize during the March equinox and June solstice, respectively. Therefore, GPS TEC and mod-eled TEC reveal the semiannual variations in TEC.
1 Introduction
1458 O. O. Odeyemi et al.: Morphology of GPS and DPS TEC
The topside DPS TEC is extrapolated from the peak electron density of the F2 region (NmF2) to around∼1000 km; thus, the significant PEC contribution from the higher altitudes is omitted from DPS TEC measurement (Reinisch and Huang, 2001; Belehaki et al., 2004 and Zhang et al., 2006).
The International Reference Ionosphere (IRI) model de-pends on worldwide data from various measurements (Bil-itza, 1986, 2000; Bilitza and Rawer, 1998). The IRI model provides reliable ionospheric densities, composition, tem-peratures, and composition in the ionospheric altitude range (Radicella et al., 1998; Bilitza, 2000 and Coisson et al., 2009). The latest version of the IRI model can be found at all time on the web (https://ccmc.gsfc.nasa.gov/modelweb/ models/iri2016_vitmo.php; last access: 22 October 2018) with improvements on earlier versions of the model. The NeQuick 2 (NeQ) model makes use of the position, time and solar flux or sunspot number over a given location as vari-ables in the NeQ model code (Coisson et al., 2006; Bidaine and Warnant, 2011 and Andreeva and Lokota, 2013). The output of the NeQ program and corresponding TEC are given by the electron density along any ray path and numerical in-tegration in space and time respectively.
The availability of ionospheric parameters for global iono-spheric models is deficient over the African sector com-pared to the consistent input of the data from the Asian and American sectors. Therefore, the continuing investi-gations of the parameters over Africa are required to im-prove the global ionospheric model. For example, Bagiya et al. (2009) studied TEC around an equatorial, low-latitude region at Rajkot (22.29◦N, 70.74◦E, dip 14.03◦N) during low solar activity, Olwendo et al. (2012) and Karia and Pathak (2011) investigated the TEC data at Kenyan and Surat (India), respectively. They all noticed a semiannual variation with minimum and maximum TEC in the June solstice and March equinox, respectively. Using the Faraday rotational technique, Olatunji (1967) investigated TEC variation over the equatorial latitude at Ibadan. He observed no daytime bite-out and seasonal anomaly over the region. Rastogi et al. (1975) observed the diurnal variation of TEC using Fara-day rotation over the magnetic equator. They noticed that TEC at the topside was higher than TEC at the bottomside during the nighttime; however, during the daytime they ob-served a uniform distribution of the TEC, on the topside and the bottomside ofNeprofile.
Regarding the DPS TEC measurement, Barbas et al. (2010) examined GPS TEC and DPS TEC at Tucuman (26.69◦S, 65.23◦W) during different seasons. They inferred
that the DPS TEC represented the GPS TEC with a minimal discrepancy in all seasons. Reinisch et al. (2004) investigated GPS TEC and DPS TEC in a mid-latitude and equatorial re-gion. They observed that the variations in GPS TEC and DPS TEC appeared similar, but the daytime values of GPS TEC were higher than daytime DPS TEC. Zhang et al. (2004) studied the variations in DPS TEC and GPS TEC over Hainan and reported that the daytime DPS TEC and GPS
TEC were similar in value during the daytime, but during the dusk period, they observed a significant discrepancy between DPS TEC and GPS TEC. Belehaki et al. (2004) extracted the PEC from the GPS TEC at Athens (38◦N, 23.5◦E) for over a year. They reported a maximum and minimum con-tribution of PEC in the morning and evening, respectively. Mosert et al. (2007), Jodogne et al. (2004) and McKinnell et al. (2007) concluded that approximated PEC from the GPS TEC and DPS TEC is possible in colocated GPS and DPS station. Adewale et al. (2012), Okoh et al. (2015), Jee et al. (2005), Kenpankho et al. (2013), Sulungu et al. (2018), and Migoya Orué et al. (2008) validated the IRI TEC with GPS TEC at different regions and found high discrepancies between the IRI TEC and GPS TEC when compared to dif-ferent IRI-model options.
parame-ters. Our finding will inform the suitability of modeled TEC in place of GPS TEC. The result will also determine the ap-propriate model for the equatorial latitude in Africa. Thus, the deviations in TEC obtained from the combined relation-ship between GPS TEC, DPS TEC, IRI TEC, and NeQ TEC could be used to correct the discrepancy in the models.
2 Methods of analysis of GPS and DPS data
[image:3.612.308.463.284.327.2]Data used for this study are those of the five quietest days of each month of the year 2010. The five quietest days are days (with Ap≤4) for which geomagnetic activities are quiet, which are obtained from the international quiet day (IQD) table available on the website of Geoscience Australia. The data are for Ilorin (8.50◦N 4.65◦E, dip lat. 2.95) during the year 2010, a year of low solar activity. TEC data were obtained with a GPS receiver and DPS, both of which are located at the Ionospheric Laboratory of the University of Ilorin. The methods of data processing are described in the sections below.
2.1 GPS TEC
The slant TEC records from GPS have errors due to satellite differential delay (satellite bias (bS)), receiver differential de-lay (receiver bias (bR)), and receiver interchannel bias (bSR). This uncorrected slant GPS TEC, measured at every 1 min interval by the GPS receiver and derived from all the visible satellites at Ilorin station, are converted to vertical GPS TEC using the relation below in Eq. (1).
(GPSTEC)V =(GPSTEC)S
−[bS+bR+bSR]/S(E), (1)
where(GPSTEC)Sis the uncorrected slant GPS TEC mea-sured by the receiver,S(E)is the obliquity factor with zenith angle (z) at the ionospheric pierce point (IPP),E is the el-evation angle of the satellites in degrees, and (GPSTEC)V is the vertical GPS TEC at the IPP. The equation two below providesS(E)as
S(E)= 1
cos(z)=
"
1−
R
E×cos(E)
RE+hS
2#−
1 2
, (2)
whereREis the mean radius of the Earth measured in kilo-meter (km), and hS is the height of the ionosphere from the surface of the Earth, which is approximately equal to 400 km according to Langley et al. (2002), Rama Rao et al. (2006a), and Mannucci et al. (1993). The data from the five quietest slant GPS TEC days for each month in the year 2010 were interpreted using Krishna software (Global positioning sys-tem total electron content analysis application user’s man-ual, 2009, Institute for Scientific Research, Boston College, Chestnut Hill, Massachusetts, USA). This software reads raw data and corrects all source of errors mentioned above from
Global Navigation Satellite System (IGS) service code file. A minimum elevation angle of 20◦is used to avoid multipath
errors. The estimated vertical GPS TEC data are a function of a two-sigma (2σ) iteration. This sigma is a measure of GPS point positioning accuracy. We converted the average 1 min VTEC data to hourly averages.
2.2 DPS TEC
Regarding the TEC from the DPS, the Standard Archive Out-put (SAO) files obtained from the DPS at the University of Ilorin were edited to remove magnetically disturbed days. Huang and Reinisch (2001) technique was used to compute the DPS TEC. The vertical DPS TEC computation by the technique is based on the application of the integration over the vertical electron density [Ne(h)] profile as shown in the Eq. (3) below.
TEC=
hmF2
Z
0
NeB(dh)+
1000
Z
hmF2
NeT(dh), (3)
whereNeB andNeT are the bottomside and topside Ne
pro-files, respectively. We computed theNeB from the recorded ionograms by using the inversion technique developed by Huang and Reinisch (1996a, b). The information above the peak of the F2 layer is absent from the record of the iono-gram. Thus, theNeT is measured by approximating the
1460 O. O. Odeyemi et al.: Morphology of GPS and DPS TEC
2.3 Validation of IRI – 2016 and NeQuick 2 models
We correlated the observed TEC with modeled TEC in the IRI-2016 model. The website https://ccmc.gsfc.nasa.gov/ modelweb/models/iri2016_vitmo.php (last access: 22 Octo-ber 2018) provides the modeled TEC values. We selected the upper boundary height 2000 km and the B0 table option for the bottomside shape parameter. The Eqs. (4a–c) represent the differences between GPS TEC and DPS TEC, GPS TEC and IRI TEC, and GPS TEC and NeQ TEC while Eqs. (5a– c) below show the percentage change between GPS TEC and DPS TEC, GPS TEC and IRI TEC, and GPS TEC and NeQ TEC.
1DPS−GPS=DPSTEC−GPSTEC (4a)
1IRI−GPS=IRITEC−GPSTEC (4b)
1NeQ−GPS=NeQTEC−GPSTEC (4c)
%(1DPS−GPS)=
DPSTEC−GPSTEC
DPSTEC × 100 (5a)
%(1IRI−GPS)=
IRITEC−GPSTEC IRITEC
× 100 (5b)
% 1NeQ−GPS
=NeQTEC−GPSTEC
NeQTEC
× 100 (5c)
1DPS−GPS, 1IRI−GPS, and 1NeQ−GPS represent the differ-ence between GPS TEC and DPS TEC, GPS TEC and IRI TEC, and GPS TEC and NeQ TEC, respectively, while %(1DPS−GPS), %(1IRI−GPS), and % 1NeQ−GPSrepresent the percentage deviation between GPS TEC and DPS TEC, GPS TEC and IRI TEC, and GPS TEC and NeQ TEC, re-spectively.
The Abdus Salam International Centre for Theoreti-cal Physics (ICTP) in Trieste, Italy, in collaboration with the Institute for Geophysics, Astrophysics and Meteorol-ogy (IGAM) of the University of Graz, Austria, devel-oped the web front end of NeQuick. This quick-run iono-spheric electron density model developed at the Aeronomy and Radiopropagation Laboratory modeled TEC along any ground-to-satellite straight-line ray path. Therefore, we vali-dated the NeQ obtained from https://t-ict4d.ictp.it/nequick2/ nequick-2-web-model (last access: 22 October 2018).
3 Result
3.1 Monthly median variations in GPS and modeled
TEC
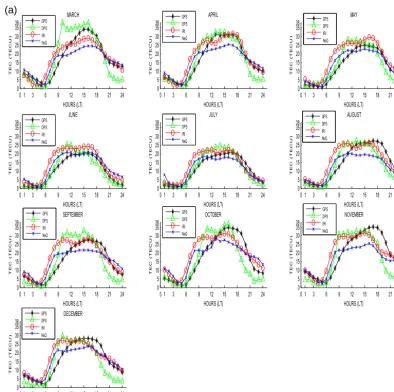
Figure 1a shows the simultaneous plots of hourly variations in the monthly median of TEC obtained from GPS,DPS, IRI, and NeQ TEC during the quiet period. The GPS TEC is de-noted by a black line with the star symbol; the DPS TEC is denoted by a green line with the diamond symbol, IRI TEC is
denoted by a red line with zero symbols, and finally, the NeQ TEC is denoted by a blue line with multiplication symbols. All the TEC plots are regulated by the same local time on the horizontal axis. The result reveals that the morphologies of GPS, DPS, and modeled TEC increase gradually from the sunrise period (07:00–09:00 LT) and reach the daytime max-imum, mostly around (12:00–17:00 LT), and then later decay steadily until a minimum value around 06:00 LT. Therefore, our result suggests that the diurnal variations in the observed and modeled TEC capture the well known solar zenith an-gle dependence of TEC since both observed and modeled TEC characterize presunrise minimum, daytime maximum, daytime depression (modeled TEC), and postsunset decay. The lowest and highest presunrise minimum ranged from
∼0.66 to ∼4.49 TECU (DPS) while the lowest and high-est daytime maximum found between∼17.75 TECU (NeQ) and∼38.0 TECU (DPS). The result shows noontime bite-out in modeled TEC around 12:00 and 15:00 LT, except in GPS TEC where the bite-out was obscure apart from a slight shift in daytime maximum within 15:00 and 17:00 LT in all months. We observed two moderate peaks (prenoon and postnoon peaks) in DPS TEC and modeled TEC, indicat-ing the bite-out effect on the modeled and DPS TEC sig-natures. We also found around the sunrise period, the model TEC rises faster than the GPS TEC, but IRI TEC rises faster compared to DPS TEC and NeQ TEC. Between 06:00 and 09:00 LT, the lowest and highest differences in the rises of IRI TEC compared to GPS TEC were∼5.0 TECU (March) and∼15.3 TECU (November), respectively. The postnoon-time decay was faster in DPS TEC compared to GPS TEC and modeled TEC in all months. Figure 1b reveals the coin-cident seasonal variations in GPS, DPS, and modeled TEC during a quiet period of the (i) March equinox, (ii) June sol-stice, (iii) September equinox, and (iv) December solstice. The daytime maximum ranges are from∼24.8 TECU (NeQ) to∼34 TECU (DPS),∼19.2 TECU (NeQ) to∼22.6 TECU (DPS),∼24.9 TECU (NeQ) to∼33.5 TECU (DPS), and∼
24.55 TECU (NeQ) to∼31 TECU (DPS), during the March equinox, June solstice, September equinox, and December solstice, respectively. We observed that the morphologies of GPS TEC and modeled TEC maximize and minimize during the March equinox and June solstice, thus indicating semian-nual variation in observed and modeled TEC.
3.2 Percentage deviation of DPS TEC, IRI TEC, and
NeQ TEC
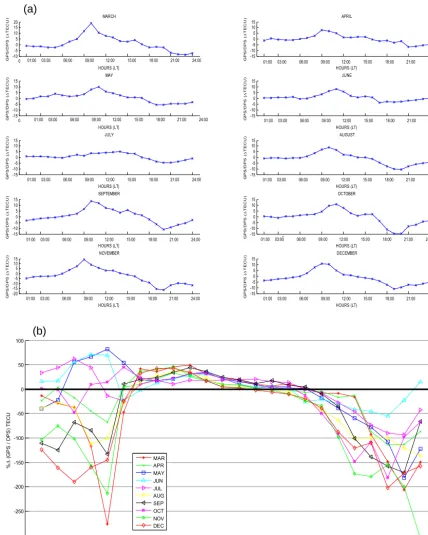
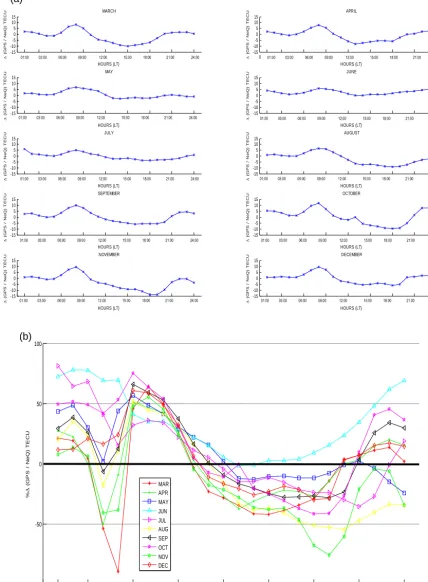
Figures 2a, 3a, and 4a are hourly variations in deviation in TEC (1TEC) between GPS-, DPS-, IRI- and NeQ-derived TEC whereas Figs. 2b, 3b, and 4b depict the mass plots of hourly variations in the percentage devia-tion (%1TEC) during a quiet period from March to De-cember. In Fig. 2a and b, the overestimation by DPS TEC as given by 1TECDPS−GPS is within the range of
0 1 3 6 9 12 15 18 21 24 0 5 10 15 20 25 30 35 38 HOURS (LT) T EC (T EC U ) MARCH GPS DPS IRI NeQ
0 1 3 6 9 12 15 18 21 24 0 5 10 15 20 25 30 35 38 HOURS (LT) T EC (T EC U ) APRIL GPS DPS IRI NeQ
0 1 3 6 9 12 15 18 21 24 0 5 10 15 20 25 30 35 38 HOURS (LT) T EC (T EC U ) MAY GPS DPS IRI NeQ
0 1 3 6 9 12 15 18 21 24 0 5 10 15 20 25 30 35 38 HOURS (LT) T EC (T EC U ) JUNE GPS DPS IRI NeQ
0 1 3 6 9 12 15 18 21 24 0 5 10 15 20 25 30 35 38 HOURS (LT) T EC (T EC U ) JULY GPS DPS IRI NeQ
0 1 3 6 9 12 15 18 21 24 0 5 10 15 20 25 30 35 38 HOURS (LT) T EC (T EC U ) AUGUST GPS DPS IRI NeQ
0 1 3 6 9 12 15 18 21 24 0 5 10 15 20 25 30 35 38 HOURS (LT) T EC (T EC U ) SEPTEMBER GPS DPS IRI NeQ
0 1 3 6 9 12 15 18 21 24 0 5 10 15 20 25 30 35 38 HOURS (LT) T EC (T EC U ) OCTOBER GPS DPS IRI NeQ
0 1 3 6 9 12 15 18 21 24 0 5 10 15 20 25 30 35 38 HOURS (LT) T EC (T EC U ) NOVEMBER GPS DPS IRI NeQ
[image:5.612.99.493.63.455.2]0 1 3 6 9 12 15 18 21 24 0 5 10 15 20 25 30 35 38 HOURS (LT) T EC (T EC U ) DECEMBER GPS DPS IRI NeQ (a) Figure 1.
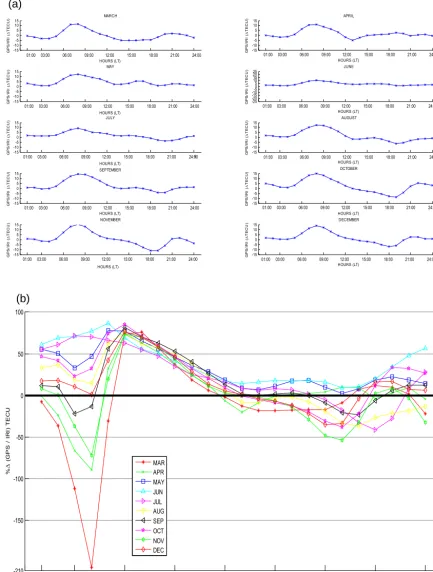
07:00–16:00 LT while the underestimation 1TECDPS−GPS fluctuated between ∼3.2 TECU (June) and ∼16.4 TECU (November) around 17:00–24:00 LT. The overestimation and underestimation of %1IRI−GPS ranged from ∼2 % to ∼ 49 % and ∼ −1.36 % to ∼ −306 %, respectively. From Figs. 3a and b, the overestimation occurred regularly around 04:00–12:00 LT in all months. The overestimated and un-derestimated 1TECIRI−GPSwere from∼9.13 TECU (July) to ∼15.3 TECU (November) and ∼0.15 TECU (October) to∼0.95 TECU (July), respectively. However, a few under-estimations and overunder-estimations of 1TECIRI−GPS still oc-curred irregularly around 13:00–03:00 LT in all months. The result also shows that IRI TEC completely overestimated GPS TEC in May and June between 01:00 and 24:00 LT. The overestimation of %1TECIRI−GPS ranged between ∼ 0.1 % and ∼86 % in all months. In Figs. 4a and b, NeQ TEC overestimated GPS TEC at 01:00–11:00 and 20:00– 24:00 LT with1TECNeQ−GPSranging from∼9.72
(Septem-ber) to ∼0.01 (April). We also found that NeQ TEC un-derestimated1TECNeQ−GPSby between∼0.11 (May) and
∼9.72 (November). The overestimations and underestima-tions of %1TECNeQ−GPSare from∼0.02 % to∼81 % and
∼ −0.3 % to∼ −75 % respectively.
3.3 Comparisons of the percentage deviations from
GPS TEC
corre-1462 O. O. Odeyemi et al.: Morphology of GPS and DPS TEC
0 1 3 6 9 12 15 18 21 24
0 5 10 15 20 25 30 35 40
HOURS (LT)
T
EC
(T
EC
U
)
MEQU(GPS) MEQU(DPS) MEQU(IRI) MEQU(NeQ)
0 1 3 6 9 12 15 18 21 24
0 5 10 15 20 25 30 35 40
HOURS (LT)
T
EC
(T
EC
U
)
JSOL(GPS) JSOL(DPS) JSOL(IRI) JSOL(NeQ)
0 1 3 6 9 12 15 18 21 24
0 5 10 15 20 25 30 35 40
HOURS (LT)
T
EC
(T
EC
U
)
SEQU(GPS) SEQU(DPS) SEQU(IRI) SEQU(NeQ)
0 1 3 6 9 12 15 18 21 24
0 5 10 15 20 25 30 35 40
HOURS (LT)
T
EC
(T
EC
U
)
DSOL(GPS) DSOL(DPS) DSOL(IRI) DSOL(NeQ)
(iv) (iii)
(ii) (i)
(b)
Figure 1. (a)Hourly variations in monthly median of five quiet days of GPS, DPS, IRI, and NeQ TEC in March–December during a quiet period. GPS TEC is denoted by the black line with the star symbol, DPS TEC is denoted by the green line with a diamond symbol, IRI TEC
is denoted by the red line with the star symbol and NeQ TEC is denoted by the blue line with the star symbol.(b)Seasonal variations in GPS
TEC, DPS TEC, IRI TEC, and NeQ TEC for the (i) March equinox, (ii) June solstice, (iii) September equinox, and (iv) December solstice over Ilorin during quiet periods in 2010. The line colors and symbols are the same as for diurnal variation in Fig. 1a for all seasons.
sponding deviations during the daytime. During the daytime, the deviations are smaller in DPS and NeQ TEC compared to IRI TEC.
4 Discussion of result
An investigation into the variations in GPS TEC, DPS TEC, and the validations of modeled TECs in an equatorial region (8.50◦N, 4.650◦E) in Africa during low solar activity in the year 2010 has been carried out. The TEC increases gradu-ally from the sunrise period, then slowly reaches the day-time maximum, and later decays to the presunrise minimum. This result indicates that the observed and modeled TEC are a solar zenith angle dependence showing peak and lowest TEC values during noontime and dusk, respectively (Aravin-dan and Iyer, 1990; Wu et al., 2008 and Kumar and Singh, 2009). Interestingly, our result reveals that the faster rise in the DPS TEC compared to GPS TEC during sunrise is not consistent with the findings of Ezquer et al. (1992) at Tu-cumán (26.9◦S; 65.4◦W), Belehaki et al. (2004) at Athens, McNamara (1985) at low latitude, and Obrou et al. (2008) at Korhogo (9.33◦N, 5.43◦W, Dip=0.67◦S). They all found
that the GPS TEC increased faster than the DPS TEC dur-ing the sunrise. The enrichment of PEC on TEC latterly re-ported by Belehaki et al. (2004) indicated a significant PEC increase in the morning and dusk time. Recently, Jodogne et al. (2004), Mosert et al. (2007), and McKinnell et al. (2007) also obtained a rough estimation of PEC from the GPS and DPS TEC variations. They inferred that the combined GPS TEC and DPS TEC could give the PEC contribution in TEC of a given location. Therefore, the higher rise in DPS TEC compared to GPS TEC during the sunrise in our study could be attributed to inaccurate representation of PEC in the top-side DPS TEC profile and incurred error during the extrapo-lation of theNe profile from the peak of F2 region (NmF2) to∼1000 km. Therefore, a typical TEC measurement nat-urally includes a meaningful PEC contribution (Balan and Iyer, 1983; Carlson, 1996; Breed et al., 1997; and Belehaki et al., 2005).
[image:6.612.108.490.74.363.2]0 -10 -50 5 10 15 20 MARCH HOURS (LT) GP S/ D PS ( T EC U )
0 1 3 6 9 12 15 18 21 24
-15 -10-5 0 5 10 15 APRIL HOURS (LT) GP S/ D PS ( T EC U )
0 1 3 6 9 12 15 18 21 24
-15 -10-5 0 5 10 15 MAY HOURS (LT) GP S/ D PS ( T EC U )
0 1 3 6 9 12 15 18 21 24
-15 -10-5 0 5 10 15 JUNE HOURS (LT) GP S/ D PS ( T EC U )
0 1 3 6 9 12 15 18 21 24
-15 -10-5 0 5 10 15 JULY HOURS (LT) GP S/ D PS ( T EC U )
0 1 3 6 9 12 15 18 21 24
-15 -10-5 0 5 10 15 AUGUST HOURS (LT) GP S/ D PS ( T EC U )
0 1 3 6 9 12 15 18 21 24
-15 -10-5 0 5 10 15 SEPTEMBER HOURS (LT) GP S/ D PS ( T EC U )
0 1 3 6 9 12 15 18 21 24
-15 -10-5 0 5 10 15 OCTOBER HOURS (LT) GP S/ D PS ( T EC U )
0 1 3 6 9 12 15 18 21 24
-20 -15 -10-5 0 5 10 15 NOVEMBER HOURS (LT) GP S/ D PS ( T EC U )
0 1 3 6 9 12 15 18 21 24
-15 -10 -50 5 10 15 DECEMBER HOURS (LT) GP S/ D PS ( T EC U ) 1:00
0 03:00 06:00 09:00 12:00 15:00 18:00 21:00 24:00
00:0001:00 03:00 06:00 09:00 12:00 15:00 18:00 21:00 24:00
-310 -250 -200 -150 -100 -50 0 50 100 HOURS (LT) % ( G P S / D P S ) T E C U MAR APR MAY JUN JUL AUG SEP OCT NOV DEC 1:00
0 03:00 06:00 09:00 12:00 15:00 18:00 21:00 24:00
1:00
0 03:00 06:00 09:00 12:00 15:00 18:00 21:00 24:00
1:00
0 03:00 06:00 09:00 12:00 15:00 18:00 21:00 24:00
1:00
0 03:00 06:00 09:00 12:00 15:00 18:00 21:00 24:00 01:00 03:00 06:00 09:00 12:00 15:00 18:00 21:00 24:00
1:00
0 03:00 06:00 09:00 12:00 15:00 18:00 21:00 24:00
1:00
0 03:00 06:00 09:00 12:00 15:00 18:00 21:00 24:00
1:00
0 03:00 06:00 09:00 12:00 15:00 18:00 21:00 24:00
(b)
(a)
1:00
0 03:00 06:00 09:00 12:00 15:00 18:00 21:00 24:00
Figure 2. (a)Hourly variations in1TEC between the GPS TEC and DPS TEC from March to December during a quiet period.(b)Mass
plot of %1TEC between the GPS TEC and DPS TEC from March to December during a quiet period. The legend represents line colors and
symbols of each deviation in all months.
the high topsideNeprofile. Thus, our observation may sug-gest that the IRI TEC has incorporated low topsideNeprofile
[image:7.612.85.514.71.607.2]1464 O. O. Odeyemi et al.: Morphology of GPS and DPS TEC
0 1 3 6 9 12 15 18 21 24
-15 -10-5 0 5 10 15 MARCH HOURS (LT) GP S/ IR I ( T EC U )
0 1 3 6 9 12 15 18 21 24
-15 -10-5 0 5 10 15 APRIL HOURS (LT) GP S/ IR I ( T EC U )
0 1 3 6 9 12 15 18 21 24
-15 -10-5 0 5 10 15 MAY HOURS (LT) GP S/ IR I ( T EC U )
0 1 3 6 9 12 15 18 21 24
-25 -20 -15 -10-5 0 5 10 15 20 25 JUNE HOURS (LT) GP S/ IR I ( T EC U )
0 1 3 6 9 12 15 18 21 24
-15 -10-5 0 5 10 15 JULY HOURS (LT) GP S/ IR I ( T EC U )
0 1 3 6 9 12 15 18 21 24
-15 -10-5 0 5 10 15 AUGUST HOURS (LT) GP S/ IR I ( T EC U )
0 1 3 6 9 12 15 18 21 24
-15 -10-5 0 5 10 15 SEPTEMBER HOURS (LT) GP S/ IR I ( T EC U )
0 1 3 6 9 12 15 18 21 24
-15 -10-5 0 5 10 15 OCTOBER HOURS (LT) GP S/ IR I ( T EC U )
0 1 3 6 9 12 15 18 21
-15 -10 -50 5 10 15 NOVEMBER GP S/ IR I ( T EC U )
0 1 3 6 9 12 15 18 21
-15 -10 -50 5 10 15 DECEMBER HOURS (LT) GP S/ IR I ( T EC U ) -210 -150 -100 -50 0 50 100 HOURS (LT) % ( G P S / I R I) T E C U MAR APR MAY JUN JUL AUG SEP OCT NOV DEC
(a)
(b)
1:000 03:00 06:00 09:00 12:00 15:00 18:00 21:00 24:00
1:00
0 03:00 06:00 09:00 12:00 15:00 18:00 21:00 24:00
1:00
0 03:00 06:00 09:00 12:00 15:00 18:00 21:00 24:00
1:00
0 03:00 06:00 09:00 12:00 15:00 18:00 21:00 24:00
1:00
0 03:00 06:00 09:00 12:00 15:00 18:00 21:00 24:00 01:00 03:00 06:00 09:00 12:00 15:00 18:00 21:00 24:00
1:00
0 03:00 06:00 09:00 12:00 15:00 18:00 21:00 24:00
1:00
0 03:00 06:00 09:00 12:00 15:00 18:00 21:00 24:00
1:00
0 03:00 06:00 09:00 12:00 15:00 18:00 21:00 24:00
1:00
0 03:00 06:00 09:00 12:00 15:00 18:00 21:00 24:00
HOURS (LT)
00:00 01:00 03:00 06:00 09:00 12:00 15:00 18:00 21:00 24:00
Figure 3. (a)Hourly variations in1TEC between the GPS TEC and IRI TEC from March to December during a quiet period.(b)Mass plot
of %1TEC between the GPS TEC and IRI TEC from March to December during a quiet period. The line colors and symbols are the same
[image:8.612.80.514.73.646.2]0 1 3 6 9 12 15 18 21 24 -15 -10 -5 0 5 10 15 MARCH HOURS (LT) (GP S / N eQ ) T EC U
0 1 3 6 9 12 15 18 21 24
-15 -10 -5 0 5 10 15 APRIL HOURS (LT) (GP S / N eQ ) T EC U
0 1 3 6 9 12 15 18 21 24
-15 -10 -5 0 5 10 15 MAY HOURS (LT) (GP S / N eQ ) T EC U
0 1 3 6 9 12 15 18 21 24
-15 -10 -5 0 5 10 15 JUNE HOURS (LT) (GP S / N eQ ) T EC U
0 1 3 6 9 12 15 18 21 24
-15 -10 -5 0 5 10 15 JULY HOURS (LT) (GP S / N eQ ) T EC U
0 1 3 6 9 12 15 18 21 24
-15 -10 -5 0 5 10 15 AUGUST HOURS (LT) (GP S / N eQ ) T EC U
0 1 3 6 9 12 15 18 21 24
-15 -10 -5 0 5 10 15 SEPTEMBER HOURS (LT) (GP S / N eQ ) T EC U
0 1 3 6 9 12 15 18 21 24
-15 -10 -5 0 5 10 15 OCTOBER HOURS (LT) (GP S / N eQ ) T EC U
0 1 3 6 9 12 15 18 21 24
-15 -10 -5 0 5 10 15 NOVEMBER HOURS (LT) (GP S / N eQ ) T EC U
0 1 3 6 9 12 15 18 21 24
-15 -10 -5 0 5 10 15 DECEMBER HOURS (LT) (GP S / N eQ ) T EC U 1:00
0 03:00 s:00 09:00 12:00 15:00 18:00 21:00 24:00
101:00 033:00 066:00 099:00 12:0012 15:0015 18:0018 21:0021 24:0024
101:00 033:00 066:00 099:00 12:0012 15:0015 18:0018 21:0021 24:0024
101:00 033:00 06:006 099:00 12:0012 15:0015 18:0018 21:0021 24:0024
101:00 033:00 066:00 09:009 12:0012 15:0015 18:0018 21:0021 24:0024
101:00 03:003 06:006 09:009 12:0012 15:0015 18:0018 21:0021 24:0024
101:00 033:00 066:00 09:009 12:0012 15:0015 18:0018 21:0021 24:0024
101:00 033:00 06:006 099:00 12:0012 15:0015 18:0018 21:0021 24:0024
11:00 3 6 9 12 15 18 21 24
0 03:00 06:00 09:00 12:00 15:00 18:00 21:00 24:00
101:00 033:00 066:00 099:00 12:0012 15:0015 18:0018 21:0021 24:0024
101:00 033:00 066:00 099:00 12:0012 15:0015 18:0018 21:0021 24:0024
(a) -100 -50 0 50 100 % ( G P S / N e Q ) T E C U MAR APR MAY JUN JUL AUG SEP OCT NOV DEC
00:0001:00 03:00 06:00 09:00 12:00 15:00 18:00 21:00 24:00
HOURS (LT) (b)
Figure 4. (a)Hourly variations in1TEC between the GPS TEC and NeQ TEC from March to December during a quiet period.(b)Mass
plot of %1TEC between the GPS TEC and NeQ TEC from March to December during a quiet period. The line colors and symbols are the
[image:9.612.82.510.77.659.2]1466 O. O. Odeyemi et al.: Morphology of GPS and DPS TEC
The similarity observed during daytime between GPS TEC and DPS TEC in April, August, and December may also suggest that the topsideNe profile in GPS TEC is ac-curate in the DPS TEC topside profile due to the absence of or negligible PEC contribution in DPS TEC values. The in-significant daytime PEC observed in this study is consistent with Rastogi et al. (1971) and Belehaki et al. (2004). Higher daytime DPS TEC compared with daytime IRI TEC is con-sistent with the result of McNamara (1985). However, Obrou et al. (2008) found, at the equatorial latitude, higher IRI TEC relative to DPS TEC during low solar activity. Therefore, the reduced daytime IRI TEC compared to GPS TEC values in-dicates the excessive PEC removal from the model values that its PEC contribution had been raised initially during the sunrise.
Also, the reduced NeQ TEC compared to GPS TEC values in all months is consistent with the reports of Migoya-Orue et al. (2017), Cherniak and Zakharenkova (2016), Rabiu et al. (2014), and Coisson et al. (2009). They recommended an added PEC contribution on the topside NeQ profile for an accurate prediction of the NeQ model.
The daytime bite-out in TEC is due to the occurrence of the most active fountain effect during noontime at the mag-netic equator. The bite-out results from the vertical plasma drift due to the combined consequence of mutually perpen-dicular electric and magnetic fields on the plasma. The drift lifts the plasma at the magnetic equator and diffuses along geomagnetic field lines into the high latitudes, thereby leav-ing the reduced TEC at the magnetic equator (Bandyopad-hyay, 1970; Skinner, 1966; Bolaji et al., 2012; Olwendo et al., 2013). However, the absence of daytime bite-out (Olatunji, 1967) in GPS TEC in our finding may be due to the greater amount of production at the bottomside and topside electron content that are enhanced quickly to replenish the loss of the ionization that occurs through the fountain effect during noontime.
The percentage difference between observed and modeled TEC reveals that the presunrise values in DPS TEC, IRI TEC, and NeQ TEC require modifications, especially during the month of March for DPS TEC and the models and Novem-ber and DecemNovem-ber for DPS TEC only. The daytime DPS TEC is closer to the GPS TEC value compared to the daytime IRI TEC and NeQ TEC values. The nighttime NeQ TEC and IRI TEC perform better with GPS TEC compared with DPS TEC in all months. There is also the need to minimize the discrep-ancies observed during the dusk periods.
Seasonally, we found that TEC maximizes and minimizes during the equinoxes and the solstices, respectively. Our re-port is consistent with Bagiya et al. (2009), Wu et al. (2008), Kumar and Singh (2009), and Balan and Rao (1984), who investigated TEC in various regions. They attributed the sea-sonal variation in TEC to the seasea-sonal differences in thermo-spheric composition. Moreover, the subsolar point is around the equator during the equinox. Consequently, the sun shines directly over the equatorial latitude, and in addition to the
high ratio of O/N2 around the region, this translates to stronger ionization and generates a semiannual variation in TEC. The finding from our study is consistent with the re-ports of Skinner (1966), Bolaji et al. (2012), and Scher-liess and Fejer (1999), who obtained semiannual variation in TEC. Scherliess and Fejer (1999) also concluded that day-timeE×Bdrift velocity could result in semiannual variation because the drift is more and less significant in the equinoc-tial months and June solstice, respectively.
5 Conclusion
We have examined the variations in observed and modeled TEC over an equatorial region in Africa during a year of low solar activity. Our findings showed the following:
i. GPS TEC and modeled TEC dependence on solar zenith angle;
ii. a faster sunrise increase in the modeled TEC relative to GPS TEC, which suggests an overestimation of the topsideNeprofile of the modeled TEC due to plasmas-pheric electron content (PEC) in the models;
iii. a good representation of the daytime measured TEC by the models, suggesting that the model TEC could rep-resent GPS TEC in the absence of plasmaspheric TEC contribution;
iv. that the 1TECIRI−GPS and %1TECIRI−GPS in May and June consistently show overestimations at 01:00– 24:00 LT, indicating the enhanced contribution of PEC at all hours in May and June;
v. that the percentage deviations in DPS and modeled TEC relative to GPS TEC during dusk periods is always higher than their corresponding differences during the daytime, and the values of daytime deviation in DPS and NeQ TEC are smaller compared to daytime devia-tion in IRI TEC.
This study was carried out during low solar activity in the year 2010; it will be of advantage to investigate and compare similar reviews during high solar activity with our results.
Data availability. The GPS and DPS data are provided by the
Author contributions. OOO carried out the analysis and prepared the paper. JA, OO, OO, IA and EO participated in discussing the results, read the paper, and commented on it.
Competing interests. The authors declare that they have no conflict
of interest.
Acknowledgements. The authors thank the US Air Force and
Lowell Digisonde, Massachusetts, for the donation and continual maintenance of the DPS. We also appreciate Boston College and the SCINDA group for the donations and continual maintenance of the GPS receiver at the University of Ilorin, Nigeria. We also ap-preciate the support of the University of Ilorin and CAR-NASRDA for their support in funding of the ionospheric observatories.
Edited by: Ana G. Elias
Reviewed by: Kavutarapu Venkatesh and one anonymous referee
References
Abdus Salam International Centre for theoretical Physics: the T/ICT4D laboratory, NeQuick 2 web model, https://tict4d.ictp. it/nequick2/nequick-2-web-mode last access: 22 October 2018. Adewale, A. O., Oyeyemi, E. O., and Olwendo, J.: Solar activity
dependence of total electron content derived from GPS observa-tions over Mbarara, Adv. Space. Res., 50, 415–426, 2012. Akala, A. O., Oyeyemi, E. O., Somoye, E. O., Adeloye,
A. B., and Adewale, A. O.: Variability of foF2 in the
African equatorial ionosphere, Adv. Space Res., 45, 1311–1314, https://doi.org/10.1016/j.asr.2010.01.003, 2010.
Aravindan, P. and Iyer, K. N.: Day-to-day variability in ionospheric electron content at low latitudes, Planet. Space Sci., 38, 743–750, 1990.
Bagiya, M. S., Joshi, H. P., Iyer, K. N., Aggarwal, M., Ravin-dran, S., and Pathan, B. M.: TEC variations during low so-lar activity period (2005–2007) near the Equatorial Ionospheric Anomaly Crest region in India, Ann. Geophys., 27, 1047–1057, https://doi.org/10.5194/angeo-27-1047-2009, 2009.
Balan, N. and Rao, P. B.: Relationship Between Nighttime Total Electron Content Enhancements, J. Geophys. Res., 89, 9009– 9013, 1984.
Balan, N. and Iyer, K. N.: Equatorial anomaly in ionospheric elec-tron content and its relation to dynamo currents, J. Geophys. Res., 88, 10259–10262, 1983.
Bandyopadhyay, P.: Measurement of total electron content
at Huancayo, Peru, Planet. Space. Sci., 18, 129–135,
https://doi.org/10.1016/0032-0633(70)90150-9, 1970.
Barbas, H. B., Medina, D. C., and Rios, V. H.: Differences between GPS and digisonde measurements of total electron content, Acta Geod. Geophys. Hu., 45, 403–16, 2010.
Belehaki, A., Jakowski, N., and Reinisch, B.W.: Plasmaspheric electron content derived from GPS TEC and digisonde iono-grams, Adv. Space Res., 33, 833–837, 2004.
Belehaki, A.: Real-time monitoring for nowcasting and forecast-ing ionospheric space weather in Europe with ground digisondes, Ann. Geophys., 48, 453–465, 2005.
Bent, R. B., Llewellyn, S. K. and Schmid, P. E.: A highly successful empirical model for the worldwide ionospheric electron density profile, DBA Systems, Melbourne, Florida, USA, 1972. Bidaine, B. and R. Warnant.: Ionosphere Modelling for Galileo
Single Frequency Users: Illustration of the Combination of the NeQuick Model and GNSS Data Ingestion, Adv. Space Res., 47, 312–322, doi.org/10.1016/j.asr.2010.09.001, 2011.
Bilitza, D.: International reference ionosphere.: Recent develop-ments, Radio Sci., 21, 343–346, 1986.
Bilitza, D.: International Reference Ionosphere 2000, Radio Sci., 36, 261–275, 2000.
Bilitza, D. and Rawer, K.: International Reference Ionosphere Model, Adv. Space Res., 69, 520–829, 1998.
Bolaji, O. S., Adeniyi, J. O., Radicella, S. M., and Doherty, P. H.: Variability of total electron content over an equatorial West African station during low solar activity, Radio Sci., 47, 1–9, https://doi.org/10.1029/2011RS004812, 2012.
Breed, A. M., Goodwin, G. L., Vandenberg, A. M., Essex, E. A., Lynn, K. J. W., and Silby, J. H.: Ionospheric total electron content and slab thickness determined in Australia, Radio Sci., 32, 1635– 1643, 1997.
Carlson, H. C.: Incoherent scatter radar mapping of polar electro-dynamics, J. Atmos.Sol.-Terr. Phy., 58, 37–56, 1996.
Cherniak, I. and Zakharenkova, I.: NeQuick and IRI-Plas model performance on topside electron content representation: Space-borne GPS measurements, Radio Sci., 51, 752–766, 2016. Coisson, P., Radicella, S. M., Leitinger, R., and Nava, B.: Topside
electron density in IRI and NeQuick: features and limitations, Adv. Space Res., 37, 937–942, 2006.
Coisson, P., Nava, B., and Radicella, S. M.: On the use of NeQuick topside option in IRI-2007, Adv. Space Res., 43, 1688–1693, 2009.
Community Coordinated Modeling Center (CCMC): International Reference Ionosphere – IRI, available at: https://ccmc.gsfc.nasa. gov/modelweb/models/iri2016_vitmo.php (last access: 22 Octo-ber 2018), 2016.
de Jesus, R., Fagundes, P. R., Coster, A., Bolaji, O. S., Sobral, J. H. A., Batista, I. S., de Abreu, A. J., Venkatesh, K., Gende, M., Abalde, J. R., and Sumod, S. G.: Effects of the intense ge-omagnetic storm of September–October 2012 on the equatorial, low-and mid-latitude F region in the American and African sec-tor during the unusual 24th solar cycle strength, J. Atmos. Terr. Phys., 138, 93–105, 2016.
Ezquer, R. G., Adler, N. O., Radicella, S. M., Gonzalez, M. M., and Manza, J. R.: Total electron content obtained from ionogram data alone, Radio Sci., 27, 429–434, 1992.
Huang, X. and Reinisch, B. W.: Vertical electron density profiles from the digisonde network, Adv. Space Res., 18, 121–129, 1996a.
Huang, X. and Reinisch, B. W.: Vertical electron density profiles from digisonde ionograms. The average representative profile, Ann. Geophys., 39, 751–756, 1996b.
Huang, X. and Reinisch, B. W.: Vertical electron content from iono-grams in real time, Radio Sci., 36, 335–342, 2001.
1468 O. O. Odeyemi et al.: Morphology of GPS and DPS TEC
Jodogne, J.-C., Nebdi, H., and Warnan, R.: Advances in Radio Sci-ence GPS TEC and ITEC from Digisonde Data Compared with NeQuick Model, Adv. Radio Sci., 2, 269–273, 2004.
Karia, S. P. and Pathak, K. N.: GPS based TEC measurement for a period Aug 2008–Dec 2009 near the northern crest of India equatorial ionospheric anomaly region, J. Earth Syst. Sci., 120, 851–858, 2011.
Kenpankho, P., Supnithi, P., and Nagatsuma, T.: Comparison of ob-served TEC values with IRI-2007 TEC and IRI-2007 TEC with optional foF2 measurements predictions at an equatorial region, Chumphon, Thailand, Adv. Space Res., 52, 1820–1826, 2013. Kumar, S. and Singh, A. K.: Variation of ionospheric total electron
content in Indian low latitude region of the equatorial anomaly during May 2007–April 2008, Adv. Space Res., 43, 1555–1562, 2009.
Langley, R., Fedrizzi, M., Paula, E., Santos, M., and Komjathy, A.: Mapping the low latitude ionosphere with GPS, GPS World, 13, 41–46, 2002.
Leong, S. K., Musa, T. A., Omar, K., Subari, M. D., Pathy, N. B., and Asillam, M. F.: Assessment of ionosphere models at Bant-ing: Performance of IRI-2007, IRI-2012 and NeQuick 2 models during the ascending phase of Solar Cycle 24, Adv. Space Res., 55, 1928–1940, 2015.
Liu, J. Y., Tsai, H. F., and Jung, T. K.: Total electron content obtained by using the global positioning system, Terr. Atmos. Oceanic Sci., 7, 107–117, 1996.
Mannucci, A. J., Wilson, B. D., and Edwards, C. D.: A new method for monitoring the Earth’s ionospheric total electron content us-ing the GPS global network, paper presented at ION GPS-93, Inst. of Navigation., 1323–1332, 1993.
McKinnell, L. A., Opperman, B., and Cilliers, P. J.: GPS TEC and ionosonde TEC over Grahamstown, South Africa: First compar-isons, Adv. Space Res., 39, 816–820, 2007.
McNamara, L. F.: The use of total electron content measurements to validate empirical models of the ionosphere, Adv. Space Res., 5, 81–90, 1985.
Migoya Orué, Y. O., Radicella, S. M., Coïsson, P., Ezquer, R. G., and Nava, B.: Comparing TOPEX TEC Measurements with IRI Predictions, Adv. Space Res., 42, 757–762, 2008.
Migoya-Orué, Y., Folarin-Olufunmilayo, O., Radicella, S., Alazo-Cuartas, K., and Rabiu, A. B.: Evaluation of NeQuick as a model to characterize the Equatorial Ionization Anomaly over Africa using data ingestion, Adv. Space Res., 60, 1732–1738, 2017. Mosert, M., Gende, M., Brunini, C., Ezquer, R., and Altadill, D.:
Comparisons of IRI TEC predictions with GPS and digisonde measurements at the Ebro, Adv. Space Res., 39, 841–847, 2007. Obrou, O. K., Mene, M. N., Kobea, A. T., and Zaka, K. Z.: Equa-torial total electron content (TEC) at low and high solar activity, Adv. Space Res., 43, 1757–1761, 2008.
Okoh, D., McKinnell, L. A., Cilliers, P., Okere, B., Okonkwo, C., and Rabiu, B.: IRI-vTEC versus GPS-vTEC for Nigerian SCINDA GPS stations, Adv. Space Res., 55, 1941–1947, 2015. Olatunji, E. O.: The total columnar electron content of the equatorial
ionosphere strength, J. Atmos. Terr. Phys., 29, 277–285, 1967. Olawepo, A. O., Oladipo, O. A, Adeniyi, J. O., and Doherty, P. H.:
TEC response at two equatorial stations in the African sector to geomagnetic storms, Adv. Space Res., 56, 19–27, 2015. Olwendo, O. J., Baki, P., Cilliers, P. J., Mito, C., and Doherty,
P.: Comparison of GPS TEC Measurements with IRI-2007
TEC Prediction over the Kenyan Region during the Descend-ing Phase of Solar Cycle 23, Adv. Space Res., 49, 914–921, https://doi.org/10.1016/j.asr.2011.12.007, 2012.
Olwendo, O. J., Baki, P., Cilliers, P. J., Mito, C., and Doherty, P.: Comparison of GPS TEC Variations with IRI-2007 TEC Predic-tion at Equatorial Latitudes during a Low Solar Activity (2009– 2011) Phase over the Kenyan Region, Adv. Space Res., 52, 1770–1779, 2013.
Rabiu, A. B., Adewale, A. O., Abdulrahim, R. B., and Oyeyemi, E. O.: Science Direct TEC Derived from Some GPS Stations in Nigeria and Comparison with the IRI and NeQuick Models, Adv. Space Res., 53, 1290–1303, https://doi.org/10.1016/j.asr.2014.02.009, 2014.
Radicella, S. M., Bilitza, D., Reinisch, B. W., and Adeniyi, J. O., Mosert Gonzalez, M. E., Zolesi, B., Zhang, M. L., and Zhang, S.: IRI Task Force Activity At ICTP: Proposed Improvements For The IRI Region Below The F Peak, Adv. Space Res., 22, 731–739, 1998.
Rama Rao, P. V. S., Niranjan, K., Prasad, D. S. V. V. D., Gopi Krishna, S., and Uma, G.: On the validity of the ionospheric pierce point (IPP) altitude of 350 km in the Indian equato-rial and low-latitude sector, Ann. Geophys., 24, 2159–2168, https://doi.org/10.5194/angeo-24-2159-2006, 2006a.
Rastogi, R. G. and Sharma, R. P.: Ionospheric electron content at Ahmedabad (near the crest of the equatorial anomaly) by using beacon satellite transmissions during half a solar cycle, Planet. Space Sci., 19, 1505–1517, 1971.
Rastogi, R. G., Iyer, K. N., and Bhattacharyya, J. C.: Total elec-tron content of the ionosphere over the magnetic equator, Current Sci., 531–533, 1975.
Reinisch, B. W. and Huang, X.: Deducing topside profiles and total electron content from bottomside ionograms, Adv. Space Res., 27, 23–30, 2001.
Reinisch, B. W., Huang, X., Belehaki, A., and Ilma R.: Using Scale Heights Derived from Bottomside Ionograms for Modelling the IRI Topside Profile, Adv. Radio Sci., 2, 293–297, 2004. Reinisch, B. W., Huang, X., Galkin, I. A., Paznukhov, V., and
Ko-zlov, A.: Recent advances in the real-time analysis of ionograms and ionospheric drift measurements with digisondes strength, J. Atmos. Terr. Phys., 67, 1054–1062, 2005.
Rios, V. H., Medina, C. F., and Alvarez, P.: Comparison between IRI predictions and digisonde measurements at Tucuman Strength, J. Atmos. Terr. Phys., 69, 569–577, 2007.
Scherliess, L. and Fejer, B.: Radar and satellite global equatorial F region vertical drift model, J. Geophys. Res., 104, 6829–6842, 1999.
Skinner, N. J.: Measurements of Total Electron Content Near The Magnetic Equator, Planet. Space Sci., 14, 1123–1129, 1966. Sulungu, E. D., Uiso, C. B., and Sibanda, P.: Comparison of GPS
derived TEC with the TEC predicted by IRI 2012 model in the southern Equatorial Ionization Anomaly crest within the Eastern Africa region, Adv. Space Res., 61, 1660–1671, 2018.
Tariku, Y. A.: Patterns of GPS-TEC variation over low-latitude re-gions (African sector) during the deep solar minimum (2008 to 2009) and solar maximum (2012 to 2013) phases, Earth Planets Space, 67, 1–9, 2015.
equato-rial anomaly from 1994 to 2003, Adv. Space Res., 41, 611–616, 2008.
Yu, X., She, C., Liu, D., and Zhen, W.: October. A preliminary study of the NeQuick model over China using GPS TEC and ionosonde data. In Antennas, Propagation & EM Theory (ISAPE), 2012 10th International Symposium on IEEE, Xian, China, 627–630, 22–26 October 2012.
Zhang, M. L., Shi, J. K., Wang, X., and Radicella, S. M.: Iono-spheric variability at low latitude station: Hainan, China, Adv. Space Res., 34, 1860–1868, 2004.