University of Southern Queensland
Faculty of Engineering & Surveying
Automated real time optimisation for control of
furrow irrigation
A thesis submitted by
Richard Koech
in fulfilment of the requirements of
Doctor of Philosophy
Abstract
Furrow irrigation is one of the oldest techniques of surface irrigation and is the most popular method for the irrigation of row crops. In Australia the method is widely used for the irrigation of cotton and in some years it has accounted for about 95% of the total production. The furrow system is however often associated with high labour requirement and low water used efficiency. In furrow irrigation the soil is used both as a medium for infiltration and also for conveyance of water from one end of field to the other. However, the spatial and temporal soil infiltration variability causes non-uniformity in water absorption rates and furrow stream advance rates. This significantly reduces water use efficiency because current design and management practices do not take this variability into account. Most operations in the furrow system are undertaken manually, and are hence labour-intensive.
iii
The system developed in this research is an integration of a simulation model and associated automation hardware and consists of five main components: (i) a water delivery system, (ii) an inflow measurement system, (ii) a water sensor to monitor advance of water along the furrow, (iv) computer running the simulation model (AutoFurrow), and (v) a radio telemetry system to facilitate communi-cation among the system components. AutoFurrow uses a scaling technique to adjust the soil infiltration characteristic and determine the soil conditions pre-vailing for the particular irrigation. Hence it optimises the current irrigation to satisfy the soil moisture deficit and other user-defined objectives (for example target efficiency, uniformity and run-off) and determines the time to end the irrigation in sufficient time for effective control of the irrigation.
Trials to test and prove the new system were undertaken on two separate com-mercial cotton properties over two consecutive irrigation seasons. The system implemented for the field trials was not fully automated, and operations such as starting and cutting off flow was achieved manually. Apart from evaluations of the optimisation system, full advance data and other measurements were taken for all trials to enable a post-irrigation complete (actual) irrigation evaluation to be undertaken. Performances expected as per the grower’s irrigation manage-ment practices were also evaluated. The SISCO simulation model was used for analysis of data.
iv
infiltration scaling process. The investigations involved an exhaustive series of simulations using the SISCO model, varying each of these factors in turn.
The key changes in the evaluation methodology effected as a result of these in-vestigations and used for the 2011/12 irrigation season trials were: the adoption of a simpler objective function consisting only of RE, and (ii) taking the aver-age shape of the previous infiltrations curves and using it as the model curve. The benefit of these changes was clearly evident in the results obtained from the 2011/12 trials - the performance of the optimisation system improved and the difference between the actual performance predicted by the optimisation system was reduced to≤4%.
Preface
The work presented in this dissertation on the development of an automated real time optimisation system for furrow irrigation is the original work of the author. This PhD research project was part of a larger project funded by the Cotton Catchment Communities CRC. The AutoFurrow software developed in the study was designed by the author; however, the source code (simulation engine) was provided by Dr. Malcolm Gillies while the coding was done by Bo Zhao. The telemetry system used for communication was assembled by Steve Rees.
The field trials, laboratory experiments and the subsequent analyses and writing of this entire dissertation were conducted by the author. The publications pro-duced during the period of candidature are listed blow:
Koech, R. K., Smith, R. J. and Gillies, M. H. (2010), ‘Furrow irrigation in the Australian
cotton industry: alternative water delivery systems and their potential for automation’,
Technical Report, National Centre for Engineering in Agriculture, Toowoomba,
Aus-tralia.
Koech, R. K., Smith, R. J. and Gillies, M. H. (2010), ‘Hydraulic characteristics of large
diameter gated flexible fluming’, Irrigation Australia Conference and Exhibition 2010:
Preface vi
Koech, R. K., Smith, R. J. and Gillies, M. H. (2010), ‘Automation and control in
surface irrigation systems: current status and expected future trends’, Southern Region
Engineering Conference (SREC 2010), 11-12 November 2010, Toowoomba, Australia.
Koech, R. K., Gillies, M. H. and Smith, R. J. (2010), ‘Simulation modelling in
sur-face irrigation systems’, Southern Region Engineering Conference (SREC 2010), 11-12
November 2010, Toowoomba, Australia.
Koech, R. K., Smith, R. J. and Gillies, M. H. (2011), ‘Design of an automatic furrow
irrigation system utilising adaptive real-time control’, SEAg 2011 Conference, 29-30
September 2011, Surfers Paradise, Australia.
Koech, R. K., Smith, R. J. and Gillies, M. H. (2011), ‘Trends in the surface irrigation
systems in the Australian irrigated agriculture’, SEAg 2011 Conference, 29-30
Septem-ber 2011, Surfers Paradise, Australia.
Smith, R. J., Gillies, M. H. and Koech, R. K. (2012) ‘Real time optimisation for smart
automation of surface irrigation’, U.S. Society for Irrigation and Drainage
Professionals (USCID) Conference: Irrigated Agriculture Responds to Water Use Challenges
-Strategies for Success, 3-6 April 2012, Texas, US.
Koech, R. K. Smith, R. J. and Gillies, M. H. (2012) ‘Evaluating the performance of
a real time optimisation and control system for furrow irrigation’, Irrigation Australia
Conference and Exhibition 2012: Droughts, Floods, Environment: Managing
Certification of Dissertation
I certify that the ideas, designs and experimental work, results, analyses and conclusions set out in this dissertation are entirely my own effort, except where otherwise indicated and acknowledged. I further certify that the work is original and has not been previously submitted for assessment in any other course or in-stitution, except where specifically stated
Richard Koech
D1136791
Signature of Candidate Date
ENDORSEMENT
Signature of Principal Supervisor Date
(Prof. Rod Smith)
Acknowledgments
This research has come to fruition through the invaluable assistance I received from a great number of people over the last approximately three years. I would like to express my sincere gratitude to some of these people who were particularly instrumental to the success of my study.
Firstly I would like to sincerely thank Prof. Rod Smith and Dr. Malcolm Gillies, my principal supervisor and associate supervisor respectively, for their dedication and guidance throughout my study. I will forever cherish the knowledge you gra-ciously passed over to me during our numerous Wednesday meetings and through written feedback on my work.
A big thank you to the entire staff and students of the University of Southern Queensland, who in one way or another, contributed to making my student life a memorable experience. I would like to covey my appreciation in particular to the staff in the Faculty of Engineering and Surveying (FOES) and the National Centre for Engineering in Agriculture (NCEA) for their excellent service and understanding. A big thank you to Dr. Jochen Eberhard, Steve Rees, Bo Zhao and Troy Symes (late) all from the NCEA and Justin Schultz of WaterBiz Pty Limited for their great assistance with the technical aspects of my research.
ACKNOWLEDGMENTS ix
following people for facilitating field trials in their properties: Nathan Bradley, Craig Saunders, Kim Bremner and Drew. The role played by staff of Agri-Science Queensland (especially Graham Harries) in identifying these field sites is much appreciated.
Special thanks to Carmel Hohn, Theresa Baldo, Noreen Pauli, Vincent Hall and their families for supporting my family to settle down in Toowoomba and to integrate into the local community. The moral support and company provided by the Kenyan, Sudanese and Congolese communities living in Toowoomba is greatly acknowledged. Special thanks to William Tong, Deng Mogok, Amira and Abuk for their incredible support over the years.
To my extended family, relatives and friends: thank you for your love, prayers and enormous moral support. Thank you all my siblings - Alice, Isaac, Esther, Priscilla, Sara, Daniel, David, Emily, Christopher, Florence and Viola for always being on my side. Special thanks to my treasured mum Grace Chumo and dad the late Mael Chumo for your sacrifices, love and protection. Thank you to my parents-in-law John Chepkwony, Esther Chepkwony and Grace Chepkwony, and all my brothers and sisters-in-law for their constant support.
Finally a very big thank to my dear wife Margaret for her love, moral support and company, both in good and turbulent times. Thank you for enduring and understanding my long absence in the course of my study. To our dear sons Abraham, Sydney and Ismael, thank you for being a source of motivation and inspiration.
Richard Koech
Contents
Abstract ii
Associated Publications v
Acknowledgments viii
List of Figures xxi
List of Tables xxix
Notation xxxvi
Acronyms & Abbreviations xxxviii
Chapter 1 Introduction 1
1.1 Introduction . . . 1
1.2 Background . . . 1
CONTENTS xi
1.4 Irrigation performance . . . 5
1.5 Irrigation in Australia . . . 7
1.6 Improving furrow irrigation . . . 7
1.7 Definitions . . . 9
1.7.1 Automation . . . 9
1.7.2 Control . . . 10
1.7.3 Feedback control . . . 10
1.7.4 Real-time control . . . 11
1.7.5 Adaptive control . . . 11
1.7.6 Optimisation . . . 11
1.8 Impacts of improvements in the surface systems . . . 12
1.8.1 Benefits . . . 12
1.8.2 Level of adoption . . . 13
1.8.3 Barriers . . . 13
1.8.4 Future trends . . . 14
1.9 Overview of research . . . 15
1.9.1 Hypotheses . . . 15
CONTENTS xii
1.9.3 Objectives . . . 15
1.10 Significance of research . . . 16
1.11 Structure of the dissertation . . . 17
Chapter 2 Review of automation, control and optimisation in sur-face irrigation 19 2.1 Introduction . . . 19
2.2 On-farm water delivery in surface irrigation systems . . . 20
2.2.1 Gates . . . 20
2.2.2 Siphons . . . 22
2.2.3 Pipes-through-the-bank (PTB) . . . 25
2.2.4 Gated pipe . . . 27
2.2.5 Bankless channels . . . 28
2.3 Sensing and communication systems . . . 30
2.3.1 Advance measurement . . . 30
2.3.2 Telemetry and SCADA systems . . . 31
2.4 Hydraulic modelling . . . 32
2.4.1 Governing equations . . . 32
2.4.2 Soil infiltration characteristic . . . 34
CONTENTS xiii
2.5.1 SIRMOD . . . 35
2.5.2 WinSRFR . . . 37
2.5.3 Recent Australian models . . . 39
2.5.4 The SISCO model . . . 39
2.6 Soil moisture deficit . . . 41
2.7 Automated surface irrigation . . . 43
2.7.1 Introduction . . . 43
2.7.2 Automated systems . . . 45
2.7.3 Feedback control systems . . . 48
2.7.4 Automatic real-time optimisation and control systems . . . 49
2.7.5 Discussion . . . 52
2.8 Conclusions . . . 53
Chapter 3 Design of system 55 3.1 Introduction . . . 55
3.2 Real-time optimisation and control . . . 56
3.2.1 Infiltration variability . . . 56
3.2.2 The concept of real-time optimisation and control . . . 57
CONTENTS xiv
3.3.1 Introduction to system implemented for the field trials . . 59
3.3.2 Field characterisation . . . 61
3.3.3 Water delivery and inflow measurement system . . . 62
3.3.4 Advance sensing . . . 66
3.3.5 Infiltration scaling . . . 68
3.3.6 Software package developed . . . 70
3.3.7 Computing, telemetry system and simulation . . . 71
3.3.8 The optimisation process . . . 73
3.4 General discussion . . . 74
3.4.1 Infiltration scaling process . . . 74
3.4.2 Model infiltration curve . . . 75
3.4.3 Selection of the advance distance . . . 75
3.5 Summary . . . 76
Chapter 4 Evaluation methodology 77 4.1 Introduction . . . 77
4.2 Field sites . . . 78
4.2.1 2010/11 season . . . 78
CONTENTS xv
4.3 Automated real time optimisation trials . . . 80
4.3.1 Inflow measurement . . . 81
4.3.2 Advance monitoring . . . 84
4.3.3 Telemetry and hydraulic modelling . . . 84
4.4 Evaluations based on full advance . . . 87
4.4.1 Actual irrigation performance . . . 87
4.4.2 Performance expected as per the farmer’s management prac-tices . . . 89
4.4.3 Multi-furrow evaluation . . . 89
4.4.4 Model infiltration parameters for future irrigations . . . . 90
4.5 Sample workings . . . 90
4.6 Summary . . . 99
Chapter 5 Results of Preliminary Trials (2010/11 irrigation sea-son) 101 5.1 Introduction . . . 101
5.2 Scaling the infiltration . . . 102
5.3 Predictions of the automated real time optimisation and control system . . . 104
CONTENTS xvi
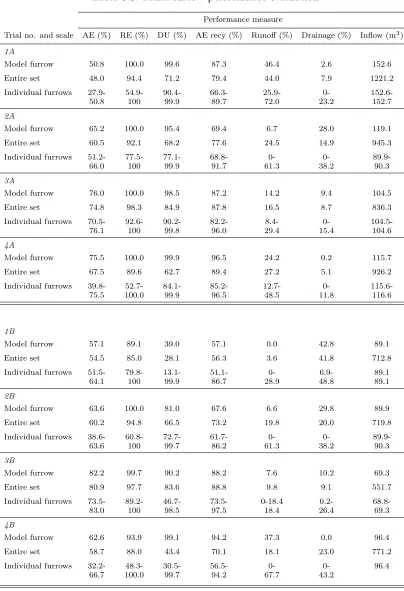
5.4.1 Model furrow evaluation . . . 109
5.4.2 Expected performance as per the farmer management practices . . . 113
5.5 System hardware and software performance . . . 115
5.6 General discussion . . . 116
5.7 Conclusion . . . 117
Chapter 6 Analysis and evaluation of alternative strategies 119 6.1 Introduction . . . 119
6.2 Objective function . . . 120
6.2.1 Trial results as predicted by the optimisation system . . . 120
6.2.2 Trial results based on the full measured data (actual infil-tration) . . . 121
6.2.3 Implications on the optimisation system . . . 122
6.3 Flow rate . . . 123
6.3.1 Constant TCO . . . 123
6.3.2 Variable TCO . . . 126
6.4 Irrigation deficit . . . 128
6.5 Infiltration scaling process . . . 132
CONTENTS xvii
6.7 Selection of the advance distance . . . 137
6.7.1 Introduction . . . 137
6.7.2 Effect of advance distance on scaling factor and cumulative infiltration . . . 138
6.7.3 Effect of advance distance on the predicted advance curves 142 6.7.4 Effect of the advance distance on the performance of the optimisation system . . . 145
6.7.5 General discussion . . . 147
6.8 Selection of the model curve . . . 149
6.9 Multi-furrow evaluation . . . 154
6.10 Conclusions . . . 157
Chapter 7 Final Field Trials (2011/12 irrigation season) 159 7.1 Introduction . . . 159
7.2 Model infiltration curve and infiltration scaling . . . 161
7.3 Irrigation performance . . . 163
7.3.1 Prediction of the optimisation system . . . 163
7.3.2 Performance based on complete evaluation . . . 164
CONTENTS xviii
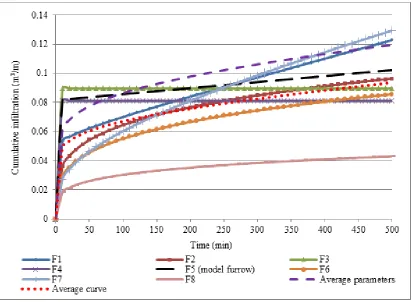
7.4 Cumulative infiltration and advance curves . . . 166
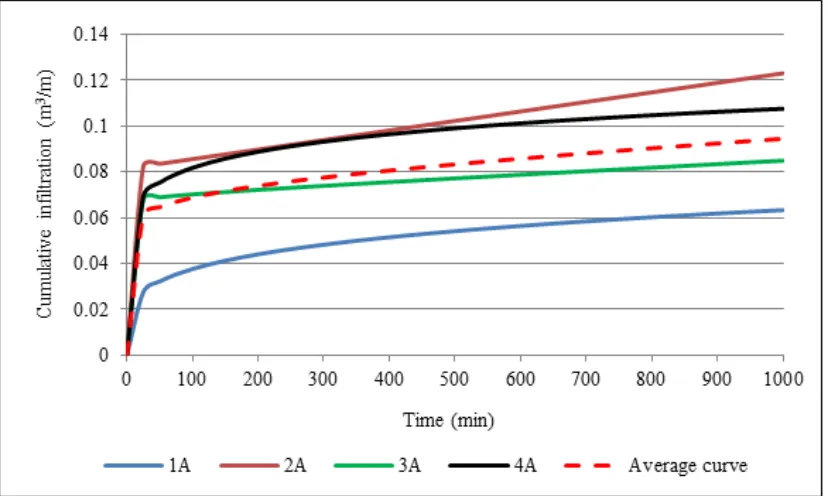
7.4.1 Actual and scaled cumulative infiltration curves . . . 166
7.4.2 Actual and scaled advance curves . . . 169
7.5 Potential performance improvement . . . 172
7.5.1 Alternative objective function . . . 172
7.5.2 Selection of the advance distance . . . 173
7.5.3 Varying the flow rate . . . 176
7.6 Conclusions . . . 179
Chapter 8 Conclusions and recommendations 181 8.1 Introduction . . . 181
8.2 Overview of previous chapters . . . 182
8.3 Major conclusions from this research . . . 186
8.4 Major conclusions based on specific research objectives . . . 187
8.5 Key outcomes . . . 191
8.6 Recommendations for further research . . . 192
References 195
CONTENTS xix
Appendix B St George Field Trials (2010/11 Irrigation Season) 227
B.0.1 Trial 1A . . . 228
B.0.2 Trial 2A . . . 229
B.0.3 Trial 3A . . . 230
B.0.4 Trial 4A . . . 231
B.0.5 Trial 1B . . . 232
B.0.6 Trial 2B . . . 233
B.0.7 Trial 3B . . . 234
B.0.8 Trial 3B . . . 235
B.0.9 Cumulative infiltration curves (based scaled infiltration) . 236 Appendix C Evaluation of alternative strategies 239 C.1 Varying the flow rate . . . 240
C.2 Varying the irrigation deficit . . . 249
C.3 Infiltration scaling process . . . 253
C.4 Comparison of advance curves . . . 255
C.5 Selection of the advance point . . . 257
C.6 Selection of the model curve . . . 265
CONTENTS xx
Appendix D Final Field Trials (2011/12 irrigation season) 271
D.0.1 Trial 1C . . . 272
D.0.2 Trial 1D . . . 273
D.0.3 Trial 2D . . . 274
D.1 Selection of the advance distance . . . 275
D.1.1 Trial 1C . . . 275
D.1.2 Trial 1D . . . 278
D.1.3 Trial 2D . . . 280
List of Figures
1.1 Application times too long . . . 5
1.2 Application times too short . . . 5
1.3 Area of land in Australia irrigated using different application systems 8 2.1 Siphon operating with free flow . . . 22
2.2 Siphon operating with submerged flow . . . 22
2.3 PTB in the cotton industry . . . 26
2.4 Schematic diagram of a bankless channel irrigation system . . . . 29
2.5 Bankless channel irrigated field in St George, Queensland . . . . 30
2.6 IPARM main user interface . . . 36
2.7 SIRMOD main output screen . . . 37
2.8 WinSRFR 3.1 Project Management window . . . 38
2.9 SISCO main screen . . . 40
LIST OF FIGURES xxii
2.11 FACC irrigation system . . . 50
3.1 Automatic real time control system for furrow irrigation . . . 60
3.2 Basic real-time optimisation and control system . . . 61
3.3 Automated bay outlet (Rubicon Water Publicity brochure) . . . . 63
3.4 PST inserted into the head ditch . . . 64
3.5 The GPIPE program main interface . . . 66
3.6 Advance meter attached to sensor node) . . . 67
3.7 AutoFurrow main input screen . . . 71
3.8 Computer, modem and solar panel) . . . 72
4.1 St. George rainfall patterns (BoM Station Number 043109) . . . . 79
4.2 Water application methods at the trial site . . . 79
4.3 Pontoon used to measure effective head . . . 83
4.4 Flow measurement tools . . . 83
4.5 SISCO optimisation window . . . 86
4.6 IrrimateT M advance meter . . . . 88
4.7 SISCO main input screen . . . 92
4.8 Calibration of infiltration parameters . . . 93
LIST OF FIGURES xxiii
4.10 Results of evaluation . . . 95
4.11 Performance as per farmer’s time to cut off . . . 96
4.12 Determining parameter r using the IPARM model . . . 96
4.13 Multi-furrow input . . . 97
4.14 Combined results of entire set of furrows . . . 98
4.15 Individual furrow results . . . 99
5.1 Predicted (scaled) cumulative infiltration curves . . . 106
5.2 Predicted advance curves . . . 107
5.3 Actual cumulative infiltration curves . . . 111
5.4 Actual advance curves . . . 112
5.5 PTB water application method . . . 116
6.1 Effect of varying Q on AE (scaled infiltration) . . . 124
6.2 Effect of varying Q on AE (Actual infiltration) . . . 124
6.3 Effect of varying Q on RE (scaled infiltration) . . . 125
6.4 Effect of varying Q on RE (actual infiltration) . . . 125
6.5 Optimum Q for maximum AE and RE (optimisation system - Trial 1A) . . . 126
LIST OF FIGURES xxiv
6.7 Effect of varied flow on AE and TCO (scaled infiltration - Trial 2B) 127
6.8 Effect of varying deficit on AE and TCO (optimisation system -Trial 1A) . . . 130
6.9 Effect of varying deficit on AE and TCO (optimisation system -Trial 2B) . . . 130
6.10 Effect of varying deficit on AE and RE (optimisation system - Trial 1A) . . . 131
6.11 Effect of varying deficit on AE and RE (optimisation system - Trial 2B) . . . 131
6.12 Model, actual and scaled infiltration curves (Trial 2A) . . . 134
6.13 Model, actual and scaled infiltration curves (Trial 2B) . . . 134
6.14 Predicted and actual advance curves - Trial 1A . . . 136
6.15 Predicted and actual advance curves - Trial 2B . . . 136
6.16 Variation of scaling factors with advance distance for Site A . . . 141
6.17 Variation of scaling factors with advance distance for Site B . . . 141
6.18 Effect of advance distance on predicted cumulative infiltration -Trial 1A . . . 142
6.19 Effect of advance distance on the predicted advance curves - Trial 1A . . . 144
LIST OF FIGURES xxv
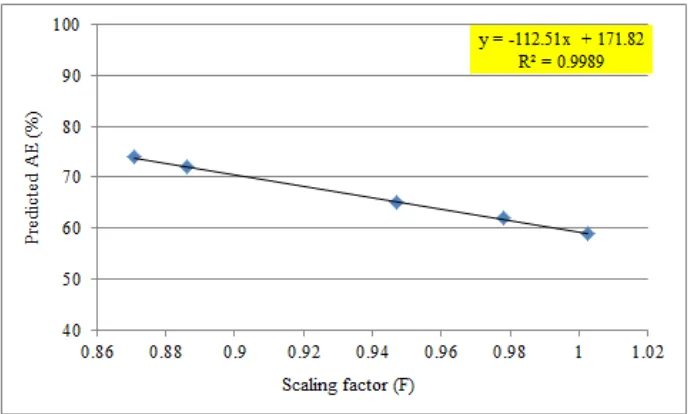
6.21 Scaling factor versus predicted AE - Trial 2B . . . 148
6.22 Scaling factor versus predicted AE - Sites A and B . . . 148
6.23 Model curve and average curves in relation to rest of the curves (Trial 1A) . . . 150
6.24 Determination of the model curve from the average shape . . . . 152
7.1 Trial 1C model infiltration curve . . . 161
7.2 Trial 2D model infiltration curve . . . 162
7.3 Actual and scaled cumulative infiltration curves - Trial 1C . . . . 167
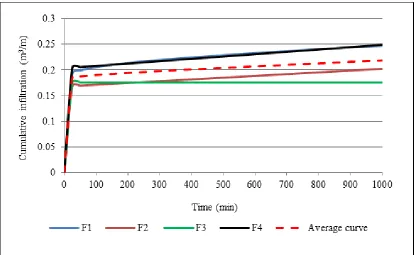
7.4 Actual and scaled cumulative infiltration curves - Trial 1D . . . . 168
7.5 Actual and scaled cumulative infiltration curves - Trial 2D . . . . 169
7.6 Actual and predicted advance curves - Trial 1C . . . 170
7.7 Actual and predicted advance curves - Trial 1D . . . 171
7.8 Actual and predicted advance curves - Trial 2D . . . 171
7.9 Effect of the advance distance on the scaling factor - Trials 1C, 1D and 2D . . . 174
7.10 Effect of the advance distance on the predicted advance - Trial 1D 175
7.11 Scaling factor (F) versus predicted AE (%) - Trial 1D . . . 176
7.12 Effect of varying Q on AE and RE (optimisation system) . . . 177
LIST OF FIGURES xxvi
A.1 Flexiflume outlet . . . 208
A.2 Bin and flow meter for outflow measurement . . . 212
A.3 Relationship between the head-diameter and height-width ratios for the layflat superimposed over the curve provided by Humpherys and Lauritzen (1964) . . . 214
A.4 Variation of pressure along the length of the 222.8 mm diameter layflat (without valves) . . . 216
A.5 Discharge variation along the length of the 222.8 mm layflat (with-out valves) . . . 217
A.6 Discharge variation along the length of the 425 mm layflat (Trials 1 - 3 without valves; Trials 4 - 7 with valves) . . . 218
A.7 Socks on outlets . . . 219
A.8 Plot of discharge, pressure and velocity heads for the 222.8 mm diameter pipe . . . 220
A.9 Discharge-pressure for the combined data (valve seats) . . . 221
A.10 Discharge-pressure for the combined data (with adjustable valves) 222
A.11 Measured versus simulated pressure for the 425 mm diameter pipe 223
A.12 Measured versus simulated discharge for the 425 mm diameter pipe 223
A.13 Measured versus simulated pressure for the 222.8 mm diameter pipe . . . 224
LIST OF FIGURES xxvii
C.1 Effect of varying Q on AE (Site B - scaled infiltration . . . 242
C.2 Effect of varying Q on AE (Site B - actual infiltration) . . . 243
C.3 Effect of varying Q on RE (Site B- scaled infiltration) . . . 243
C.4 Effect of varying Q on RE (Site B - actual infiltration) . . . 244
C.5 Optimum Q for maximum AE and RE (Optimisation system -Trial 2A) . . . 244
C.6 Optimum Q for maximum AE and RE (Optimisation system -Trial 3A) . . . 245
C.7 Optimum Q for maximum AE and RE (Optimisation system -Trial 4A) . . . 245
C.8 Optimum Q for maximum AE and RE (Optimisation system -Trial 2B) . . . 246
C.9 Effect of varied flow on AE and TCO (scaled infiltration - Trial 2A) 247
C.10 Effect of varied flow on AE and TCO (scaled infiltration - Trial 3A) 247
C.11 Effect of varied flow on AE and TCO (scaled infiltration - Trial 4A) 248
C.12 Effect of varied deficit on AE and TCO (optimisation system Trial 2A) . . . 249
C.13 Effect of varied deficit on AE and TCO (optimisation system Trial 3A) . . . 250
LIST OF FIGURES xxviii
C.15 Effect of varied deficit on AE and RE (optimisation system -Trial 2A . . . 251
C.16 Effect of varied deficit on AE and RE (optimisation system -Trial 3A) . . . 252
C.17 Effect of varied deficit on AE and RE (optimisation system -Trial 4A) . . . 252
C.18 Model, actual and scaled infiltration curves (Trial 1A) . . . 253
C.19 Model, actual and scaled infiltration curves (Trial 3A) . . . 254
C.20 Model, actual and scaled infiltration curves (Trial 4A) . . . 254
C.21 Actual and predicted advance curves - Trial 2A . . . 255
C.22 Actual and predicted advance curves - Trial 3A . . . 256
C.23 Actual and predicted advance curves - Trial 4A . . . 256
D.1 Scaling factor (F) versus predicted AE (%) - Trial 1C . . . 277
D.2 Scaling factor (F) versus predicted AE (%) - Trial 2D . . . 281
D.3 Effect of varying Q on AE and RE (actual irrigation) . . . 283
List of Tables
2.1 Commercially available channel/outlet gates . . . 21
4.1 Furrow dimensions - Trial 3A . . . 91
4.2 Advance data - Trial 3A . . . 92
5.1 Model and scaled parameters . . . 103
5.2 Performance as per the optimisation system . . . 104
5.3 Predictions of the corrected version of AutoFurrow . . . 108
5.4 Actual irrigation performance . . . 110
5.5 Performance expected as per farmer time to cut off . . . 114
6.1 Effect of alternative objective function on the performance of the controlled trials . . . 120
6.2 Effect of alternative objective function on the performance of ac-tual irrigation . . . 121
LIST OF TABLES xxx
6.4 Effect of advance distance on the scaling factor - Sites A and B . 140
6.5 Effect of advance distance on the predicted advance curves - Trial 1A . . . 144
6.6 Effect of advance distance on the performance of the optimisation system - Trial 1A . . . 146
6.7 Effect of advance distance on the predicted AE and TCO at RE of ≥90% . . . 147 6.8 Multi-furrow performance evaluation . . . 156
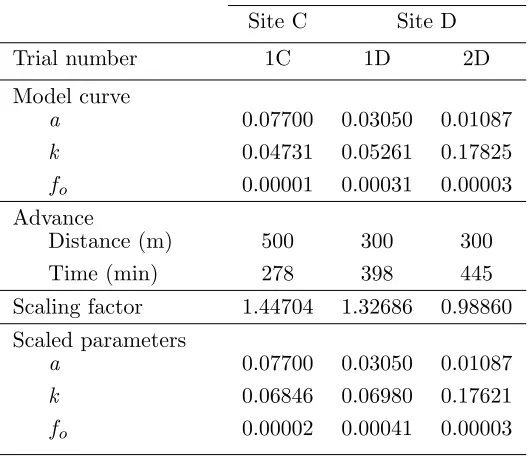
7.1 Model and scaled parameters . . . 163
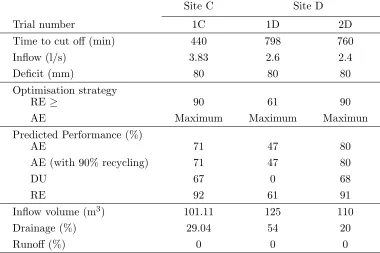
7.2 Performance predicted by the optimisation system . . . 164
7.3 Actual irrigation performance . . . 165
7.4 Actual irrigation and alternative objective function . . . 173
7.5 Effect of advance distance on the performance of the optimisation system - Trial 1D . . . 175
A.1 Summary of outflow and pressure trials . . . 213
A.2 Determination of CHW . . . 215
B.1 Furrow dimensions - Trial 1A . . . 228
B.2 Advance data - Trial 1A . . . 228
LIST OF TABLES xxxi
B.4 Furrow dimensions - Trial 2A . . . 229
B.5 Advance data - Trial 2A . . . 229
B.6 Infiltration parameters - Trial 2A . . . 229
B.7 Furrow dimensions - Trial 3A . . . 230
B.8 Advance data - Trial 3A . . . 230
B.9 Infiltration parameters - Trial 3A . . . 230
B.10 Furrow dimensions - Trial 4A . . . 231
B.11 Advance data - Trial 4A . . . 231
B.12 Infiltration parameters - Trial 4A . . . 231
B.13 Furrow dimensions - Trial 1B . . . 232
B.14 Advance data - Trial 1B . . . 232
B.15 Infiltration parameters - Trial 1B . . . 232
B.16 Furrow dimensions - Trial 2B . . . 233
B.17 Advance data - Trial 2B . . . 233
B.18 Infiltration parameters - Trial 2B . . . 233
B.19 Furrow dimensions - Trial 3B . . . 234
B.20 Advance data - Trial 3B . . . 234
B.21 Infiltration parameters - Trial 3B . . . 234
LIST OF TABLES xxxii
B.23 Advance data - Trial 4B . . . 235
B.24 Infiltration parameters - Trial 4B . . . 235
B.25 Scaled infiltration parameters and scaled cumulative infiltration for Trials 1A, 2A, 3A, 4A and 2B . . . 236
B.26 Actual infiltration parameters and actual cumulative infiltration for Trials 1A, 2A, 3A and 4A . . . 237
B.27 Actual infiltration parameters and actual cumulative infiltration for Trials 1B, 2B, 3B and 4B . . . 238
C.1 Trial 1A . . . 240
C.2 Trial 2A . . . 240
C.3 Trial 3A . . . 241
C.4 Trial 4A . . . 241
C.5 Trial 2B . . . 242
C.6 Effect of varied Q on AE and TCO (Optimisation system) . . . . 246
C.7 Effect of varied Q on AE and TCO (Optimisation system) . . . . 249
C.8 Effect of varied Q on AE and TCO (Optimisation system) . . . . 251
C.9 Effect of advance distance on the scaling factor - Trial 2A . . . 257
LIST OF TABLES xxxiii
C.11 Effect of advance distance on the performance of the optimisation system - Trial 2A . . . 258
C.12 Effect of advance distance on the scaling factor - Trial 3A . . . 259
C.13 Effect of advance distance on the predicted advance curves - Trial 3A . . . 259
C.14 Effect of advance distance on the performance of the optimisation system - Trial 3A . . . 260
C.15 Effect of advance distance on the scaling factor - Trial 4A . . . 261
C.16 Effect of advance distance on the predicted advance curves - Trial 4A . . . 261
C.17 Effect of advance distance on the performance of the optimisation system - Trial 4A . . . 262
C.18 Effect of advance distance on the scaling factor - Trial 2B . . . 263
C.19 Effect of advance distance on the predicted advance curves - Trial 2B . . . 263
C.20 Effect of advance distance on the performance of the optimisation system - Trial 2B . . . 264
C.21 Cumulative infiltration for model and average (parameters and shape) curves in relation to the rest of the curves (Trial 1A) . . . 265
C.22 Trial 1A . . . 266
C.23 Trial 1B . . . 267
LIST OF TABLES xxxiv
C.25 Trial 2B . . . 268
C.26 Trial 3A . . . 268
C.27 Trial 3B . . . 269
C.28 Trial 4A . . . 269
C.29 Trial 4B . . . 270
D.1 Furrow dimensions - Trial 1C . . . 272
D.2 Advance data - Trial 1C . . . 272
D.3 Infiltration parameters - Trial 1C . . . 272
D.4 Furrow dimensions - Trial 1D . . . 273
D.5 Advance data - Trial 1D . . . 273
D.6 Infiltration parameters - Trial 1D . . . 273
D.7 Furrow dimensions - Trial 2D . . . 274
D.8 Advance data - Trial 2D . . . 274
D.9 Infiltration parameters - Trial 2D . . . 274
D.10 Effect of advance distance on the scaling factor - Trial 1C . . . 275
D.11 Effect of advance distance on the predicted advance curves - Trial 1C . . . 276
LIST OF TABLES xxxv
D.13 Effect of advance distance on the scaling factor - Trial 1D . . . 278
D.14 Effect of advance distance on the predicted advance curves - Trial 1D . . . 279
D.15 Effect of advance distance on the scaling factor - Trial 2D . . . 280
D.16 Effect of advance distance on the predicted advance curves - Trial 2D . . . 280
D.17 Effect of advance distance on the performance of the optimisation system - Trial 2D . . . 281
D.18 Effect of varying the flow rate (Q) on AE and RE . . . 282
Notation
g Acceleration due to gravity (9.81 m/s2)
∆h Operating head (m)
G Upward movement of groundwater (mm)
y Depth of flow (m)
x Advance distance (m)
t Time (minutes or seconds)
Ix Infiltration rate at a distance x along the furrow (m3/m/s)
I Cumulative infiltration (m3/m)
v Velocity of flow (m/s)
So Channel bottom slope
Sf Channel friction slope
a,k and fo Modified Kostiakov infiltration parameters
τ Infiltration opportunity time (min)
SW2, SW1 Final and initial depths of soil moisture stored respectively (mm)
Id Irrigation depth applied (mm)
P Precipitation (mm)
R Runoff expressed as a depth (mm)
Notation xxxvii
ETa Actual crop and soil evapotranspiration (mm)
D, Φ Internal diameter of pipe or siphon (m)
L Field or pipe/siphon length (m)
A, Ao, Cross-sectional area of flow (m2)
p1,p2 Pressure in the head ditch and the discharge point (N/m2)
v1, v2 Velocity of flow in the head ditch and the discharge point(m/s)
Z1, Z2 Elevation of the PTB in the head ditch and the discharge point (m)
ρ Density of water (1000 kg/m3)
hf Head loss due to friction (m)
λ Friction loss coefficient
α Velocity head coefficient
Q, Qo Discharge or flow rate (l/s)
Hp Pressure head (m)
F Scaling factor
σy Surface shape factor (dimensionless)taken to be constant (0.77)
σz Sub-surface shape factor
p,r Fitted parameters of the power curve advance function
Is Scaled infiltration (m3/m) CHW Hazen-Williams coefficient
β Shape factor
a Cross-sectional area of fluming when less than full round
m Exponent on the discharge/velocity term in flow equation
n Exponent on diameter or hydraulic radius term
Vv Mean velocity of flow in equivalent circular pipe
d/w Height-width ratio of layflat
Cd Coefficient of discharge
N Number of outlets from the closed end
FN Christiansen’s F factor
Ls Outlet spacing (m)
Acronyms & Abbreviations
ABS Australian Bureau of Statistics AE Application efficiency (%) AFI Alternate furrow irrigation
AutoFurrow Software developed for real time optimisation of furrow irrigation CV Coefficient of variation
DU Distribution uniformity (%)
FAO Food and Agriculture Organisation FIDO Furrow Irrigation Design Optimiser GPIPE Gated Pipe Simulation Program
IrrimateT M Suite of tools used for surface irrigation evaluation NCEA National Centre for Engineering in Agriculture PST Pressure sensitive transducer
PTB Pipe(s) through the bank RE Requirement efficiency (%)
SISCO Surface Irrigation Simulation Calibration and Optimisation HGL Hydraulic grade line
TCO Time to cut off flow (min)
Chapter 1
Introduction
1.1
Introduction
This dissertation is the culmination of approximately three years of research on the subject of automated real-time optimisation for control of furrow irrigation. This first chapter provides the essential background information to the topic and covers: (i) the science of irrigation and in particular furrow irrigation hy-draulics, (ii) role and significance of irrigation in Australia, (iii) improvements in furrow irrigation, (iv) definitions of essential terminologies, and (v) impacts of the improvements in the surface systems. The chapter then sets out the research problem addressed in the dissertation, the specific objectives and the significance. An outline of the whole thesis is also provided.
1.2
Background
1.2 Background 2
3800 km3 of water used annually at a global scale, irrigation consumes about
70% with industry and domestic use accounting for 20% and 10% respectively (Molden 2007). Although irrigated land covers only approximately 20% of the world’s cropped land, it accounts for about 40% of total food production (FAO 2003). The global demand for water is expected to increase with the increase in population, and agricultural water use will face increasing competition from industrial and domestic usage.
In the context of this dissertation, an irrigation system refers to the various components, devices and tools that are used for the supply and management of water in an irrigated field. This research focuses on the on-farm systems, implying that issues to deal with water sources and the conveyance of water to the farm will not be covered in detail. Irrigation systems or methods may be broadly classified as (i) sprinkler, (ii) drip or trickle, (iii) surface, and (iii) other minor systems such as use of buckets.
In sprinkler systems water is delivered using overhead sprinklers, which spray the water over the crop or land surface. Common configurations of sprinkler systems include: hand-move or portable sprinkler systems, solid-set system, travelling sprinkler irrigators (gun and boom), centre pivot machines and linear move ma-chines. In the drip or trickle system water drips or trickles through small nozzles installed in pipes which can either be under or above-ground. The sprinkler and drip/trickle systems are also referred to as pressurised systems, as they operate under low pressure which often involves some form of pumping. These systems are however out of the scope of this dissertation and will not be discussed in any greater detail.
1.3 Basic surface irrigation hydraulics 3
46% of the total irrigated land, the majority of which is located in the Murray Darling Basin (ABS 2010). The system is particularly suited to the irrigation of broad-acre crops and those that need to be grown in a pool of water. Pasture for grazing and crops such as cotton and rice are mainly grown using surface systems. Surface systems in general are simple and have lower energy and initial capital requirements compared to the conventional pressurised systems.
The most common configurations of the surface system are basin, bay and furrow. A basin, as the name suggests is level in all directions, and is bounded by earthen embankments with a gate for water inlet. A basin can either be rectangular or square in shape. This system is popular for the irrigation of rice which is usually grown in ponded conditions. A bay (or border) consists of sloping, rectangular blocks of land with free draining conditions at the lower end. In Australia this method is the most popular for the irrigation of pasture. In furrow irrigation, one of the oldest techniques of surface irrigation, water is conveyed through small channels with a gentle slope towards the downstream end. The spacing of these channels or furrows generally correspond to the spacing of the crop to be estab-lished. Furrow irrigation is the most popular method for the irrigation of row crops in the world. The system is by far the most common method for the irri-gation of cotton in Australia. In 2003-2004 for instance, this system was used on 95% of all the cotton farms (ABS 2008a). This dissertation focusses on real time optimisation and control of furrow irrigation; hence the system will be analysed in greater detail in the subsequent sections and chapters.
1.3
Basic surface irrigation hydraulics
1.3 Basic surface irrigation hydraulics 4
The infiltration characteristic of the soil determines the rate of infiltration of water into the soil and hence controls both the rate of advance and recession of water down the furrow. The depth of application, furrow flow rate and time to cut off are management variables. For most irrigators, time to cut-off is the only quantity that can be varied to achieve a desired level of irrigation performance (Raine & Smith 2007).
As mentioned above, in surface systems the soil is used both as a medium for infiltration and also for conveyance of water from one end of the field to the other. However, the soil infiltration characteristics vary both with time and space (for example Smith et al. 2007, Walker 1989, Emilio et al. 1997). Spatial variability is primarily attributable to the differences in the soil physical and chemical properties while temporal variability may be as a result of differences in the initial soil moisture content. In furrow irrigation for instance, infiltration variability causes non-uniformity in water absorption rates and furrow stream advance rates (Trout 1990).
To achieve the desired depth of application and uniformity, irrigators tend to increase the application times often leading to deep drainage mostly in the up-stream end and runoff from the downup-stream end (Figure 1.1). Deep drainage losses are also prevalent in highly permeable soils under surface systems (Raine & Shannon 1996). Shorter applications times may reduce the risk of deep drainage and excessive run-off but may also lead to insufficient water at the downstream end (Figure 1.2). Infiltration variability in surface systems thus presents prob-ably the biggest challenge to both designers and irrigators (Walker 1989) and significantly reduces irrigation water use efficiency (Trout 1990, Gillies 2008).
1.4 Irrigation performance 5
Figure 1.1: Application times too long
Figure 1.2: Application times too short
will be analysed throughout this dissertation.
Whilst there has been significant research aimed at minimising deep drainage losses in surface systems, evaporation losses in head ditches, furrows, bays and basins have largely been ignored. However, because of the relatively longer fields and irrigation application times typical of the Australian surface irrigated agri-culture, these losses could be significant.
1.4
Irrigation performance
1.4 Irrigation performance 6
is referred to as deficit irrigation.
The two most commonly used efficiency measures of an irrigation system are (i) application efficiency (AE) and (ii) requirement efficiency (RE). AE is probably the most commonly applied performance measure in surface irrigation and may be defined as:
AE = volume of water added to the root zone
total volume of water applied (1.1)
RE is an indication of how well the water requirements have been met and may be expressed as:
RE = volume added to the root zone
water deficit prior to irrigation (1.2)
Irrigation performance may also be characterised in terms of the uniformity or evenness of the applied water across the field. The uniformity measure commonly used in surface irrigation is distribution uniformity (DU) and may be defined as:
DU = average of the lowest 25% of applied depths
average applied depth in the whole field (1.3)
1.5 Irrigation in Australia 7
1.5
Irrigation in Australia
Australia is one of the driest continents in the world and thus irrigation plays a significant role in the production of food and raw materials. Due to water scarcity however, only a small proportion of the agricultural land is irrigated. For instance in 2009-10, less than 1% of the approximately 399 million hectares of agricultural land was irrigated (ABS 2011). However irrigation accounts for approximately 30% food and non-food agricultural produce (Leonardi & Roth 2008).
Data from the Australian Bureau of Statistics (ABS) show that the total land area under irrigation in Australia has decreased by approximately 537 thousand hectares between 2002 and 2010 (Figure 1.3). The major reasons for this decline were (i) widespread drought; (ii) reductions of area under irrigation as a result of reduced water allocations; and (iii) agricultural establishments which sold out their water rights and reduced their acreages or stopped irrigation altogether (ABS 2008b, ABS 2010). Surface irrigation system has remained the main irri-gation method in Australia, with the method used in 46% of the total irrigated land in 2008-09. However this represents a decrease of 28% in the acreage under surface irrigation experienced between 1990 and 2009. Figure 1.3 also shows that there has been an uptake in the use of the sprinkler and the drip/trickle irrigation methods in the same period of time.
1.6
Improving furrow irrigation
1.6 Improving furrow irrigation 8
Figure 1.3: Area of land in Australia irrigated using different application systems
[Plotted from data obtained from: ABS 2004, Graph 5.6; ABS 2005, Tables 2.1 and 4.2; ABS 2006, Tables 2.1 and 4.2; ABS 2008, Tables 2.1 and 4.2; ABS 2010, Tables 2.1 and 4.2; ABS 2011, Table 2.1]
furrow irrigation has traditionally been considered a suitable method. However the system is often associated with high labour requirement and low water use efficiency (Smith et al. 2005). Labour requirements under pressurised systems can be as low as 10% of the labour required in typical surface irrigation systems (Raine & Foley 2002). These are some of the reasons that have seen some previously furrow-irrigated fields converted into low pressure systems.
The conversion from surface to pressurised systems comes with a heavy initial capital investment. This investment cannot always be justified, as shown by a study of the dairy industry in the Lower Murray-Darling Basin (Doyle et al. 2009). This study concluded that adopting pressurised irrigation systems will not improve the viability of most irrigated dairy farms as the farmers need time to acquire a new set of skills. Wood & Martin (2000) also advised against the broad adoption of pressurised irrigation systems as the benefits were not automatic.
1.7 Definitions 9
made to the furrow system in the recent past has been the need to reduce the labour requirement and to improve its water use efficiency. A lot of focus has gone to the latter especially because of the need to ensure sustainable use of water resources. The Federal and State governments in Australia have provided funding for improvements in the surface system on condition that the water saved is surrendered back to the environment (Plusquellec 2009). These improvements have come in the form of upgrades in the physical irrigation on-farm infrastructure and changes in the irrigation management practices, including automation and control. These will be covered in greater detail in the subsequent chapters.
1.7
Definitions
Automation and control engineering principles have traditionally been applied in industrial processes such as manufacturing and production. In the recent decades however, these principles have also been applied in precision agriculture including surface irrigation systems. Some of the more common terminologies that have hitherto been used in control systems engineering are defined below as they are used in most surface irrigation literature.
1.7.1
Automation
auto-1.7 Definitions 10
mated systems operate independently except for periodic checks and maintenance while semi-automatic systems usually have to be manually reset before the next irrigation event.
1.7.2
Control
This refers to management or regulation of irrigation in aspects such as size of inflow and time to cut off the inflow. Control can either be achieved manually or automatically. A control system can be defined as an interconnection of compo-nents forming a system configuration that will provide a desired response (Dorf and Bishop 2008) or simply a system that controls the operation of a process (Smith et al. 2007). Control systems may be classified as either open or closed-loop. In open loop systems, irrigation is initiated and controlled according to a pre-defined schedule. On the other hand, in the closed-loop systems control de-cisions are typically based on feedback from sensors. Most of the existing control strategies in irrigation are open-loop (Smith et al. 2007).
1.7.3
Feedback control
1.7 Definitions 11
1.7.4
Real-time control
Real-time control as applied to surface irrigation implies that measurements taken during an irrigation event are processed and used for the modification and op-timisation of the same irrigation event. Real-time control in surface systems is feasible when the control process is automated so that the feedback can be im-plemented rapidly. An example is when an irrigation event is monitored and the feedback is implemented while the irrigation is still underway. Some authors however have used the terms feedback and real time control interchangeably in surface irrigation systems (for example Clemmens 1992).
1.7.5
Adaptive control
This refers to the continuous variation of the control strategy in response to the changing parameters of the system. In surface irrigation for instance, infiltration or rate of water entry into the soil changes both temporally and spatially. A control system that takes cognisance of this variability is termed adaptive. The system may be termed as adaptive real-time control if the variation and control occurs in real time or rapidly.
1.7.6
Optimisation
1.8 Impacts of improvements in the surface
systems 12
1.8
Impacts of improvements in the surface
systems
1.8.1
Benefits
In automated surface irrigation systems, the irrigation process takes place in the absence of the irrigator (or operator). The excess labour as a result of automation can be re-deployed elsewhere in the farm or simply dispensed with. Labour is often required during night-time hours in irrigation operations, but this may be avoided with automation translating to comfort to both irrigators and operators. This partly explains why the benefits of automation have traditionally been seen as labour saving and lifestyle improvement, especially from the point of view of the irrigators.
The use of automatic structures and devices in irrigation guarantees timely farm operations (such as opening and closing of inlet bay structures) and eliminates (or at least reduces) the element of human error. This leads to water savings, the magnitude of which depends in part on the robustness of the control strategy in place.
That the water saving aspect of automation is somehow obscure is perhaps best illustrated by a survey undertaken by Maskey et al. (2001). When asked about their perceptions of the benefits of automation, the percentage of farmers who considered labour saving and reduction of water usage as having the greatest benefits were 59% and 19.3% respectively. The potential increase of land value as a result of automation was also widely recognised by the farmers.
1.8 Impacts of improvements in the surface
systems 13
Northern Victoria, suggest that an average water saving of 38% can be realised (Dassanayake et al. 2001).
1.8.2
Level of adoption
There is limited published data on the proportion of irrigators who have adopted some form of irrigation automation in Australia. However it is clear that the majority of the automated systems are found in southern-eastern Australia (New South Wales, Victoria) and particularly within the dairy industry. Bay irrigation is the preferred method of irrigation in these areas. Statistics from Murray Valley Irrigation Area (Maskey et al. 2001) and Central Goulburn in Northern Victoria (Armstrong 2009) indicate that 8% and 11% of dairy farmers respectively were using some form of automation in their farming practices.
1.8.3
Barriers
1.8 Impacts of improvements in the surface
systems 14
1.8.4
Future trends
The future will undoubtedly see more competition for the already scarce water resources. Governments and environmentalists will continue to advocate for a balance between the exploitation of water resources and sustainable environmen-tal conservation. All water users, including irrigators, will be required to be more accountable in their use of the scarce resource. Farm labour will become scarce and expensive. It is widely anticipated that some of the farms presently under sur-face irrigation will eventually be converted to the various forms of low-pressure systems, but nonetheless surface irrigation will remain a dominant method for the foreseeable future (for example Gillies 2008, Raine 2006). It is likely that the current efforts to modernise and improve the water use efficiencies of the surface systems will intensify in the future.
Several factors work in favour of the surface systems, the initial capital require-ment perhaps being the most significant. Most surface systems are gravity-fed from the water source with very limited pumping. The limited pumping involved means that the energy requirements (and therefore the carbon foot print) are also low. There is also the advantage of low maintenance costs involved and the use of generally unskilled labour.
As explained earlier in this chapter, conversion to pressurised systems is an expen-sive venture, and the benefits are not always forthcoming. Pressurised systems also rely heavily on energy, the price of which has been on a steady increase for several decades. The possibility of energy prices increasing to the point of rendering the pressurised systems unviable is not impossible.
1.9 Overview of research 15
1.9
Overview of research
1.9.1
Hypotheses
This PhD proposes that:
• Use of a real time optimisation system in furrow irrigation can lead to significant improvement in performance; and
• Automated real-time control of furrow irrigation is feasible.
1.9.2
Research problem
Adaptive real-time control has been proposed for the management of temporal infiltration variability (for example: Emilio et al. 1997, Mailhol & Gonzalez 1993, Khatri & Smith 2006, Turral 1996). This has the potential to improve the water use efficiency of the furrow system (as demonstrated by Smith et al. 2005, Raine et al. 1997). As already explained, none of the systems so far proposed have been widely accepted by irrigators.
One possible reason is that the benefits of such a system have not been clearly demonstrated to irrigators and researchers. Another factor is that most of the systems have tended to be expensive and complex. Hence the main goal of this research was to design a simple real time optimisation and control system for furrow irrigation and test in order to demonstrate its potential benefits.
1.9.3
Objectives
1.10 Significance of research 16
adaptive real time control. The specific objectives are:
• evaluate alternative water delivery systems e.g. flexible fluming, bank-less channels, siphon and pipe through the bank (PTB);
• identify an appropriate numerical procedure to evaluate infiltration rates in real-time (while irrigation is underway);
• integrate modelling software with sensing, communication and control hard-ware; and
• prove the prototype system through appropriate field trials.
1.10
Significance of research
The expected outcomes and significance of the proposed project are as follows:
• Additional gains in water use efficiency through increased irrigation perfor-mance, improved uniformity of application along the length of the furrows and reduced runoff. Water logging and deep drainage losses are also ex-pected to reduce;
• Potential increase in crop yield as a result of improved uniformity of appli-cation and reduced water-logging;
• Substantial labour savings as a result of automation;
• An improved understanding of how irrigation management must change in order to adapt to changes in field conditions; and
1.11 Structure of the dissertation 17
1.11
Structure of the dissertation
The outcome of about three years worth of research for this PhD has been pre-sented in eight chapters. Briefly the contents of each chapter are as follows:
Chapter 1- This first chapter provides an overview or ‘big picture’ of the entire body of work. Basic science of irrigation hydraulics and especially the infiltration process is provided. The role and significance of irrigation in Australia is discussed as well as the improvements that have been made to the furrow system and their impacts. Definitions of the terminologies commonly used in this dissertation are provided. The research problem and hypotheses are expressed, and also the objectives and the envisaged outcomes.
Chapter 2 - Previous work focussing on optimisation and control of furrow irrigation (and surface irrigation in general) is presented and evaluated in this chapter. In particular, existing and previous optimisation and control strategies are discussed and their limitations identified. The goal of this chapter is to identify the gaps that exist in the research area so as to be able to tackle the research problem appropriately.
Chapter 3 - This chapter presents the details of the optimisation and con-trol system designed and developed for furrow irrigation, including the hardware and software components. The concept of real-time optimisation and control is explained, as well as the significance of infiltration variability. The system description and operation is provided, including the associated modelling and simulation.
1.11 Structure of the dissertation 18
Chapter 5- The results of the preliminary field trials (2010/11 irrigation season) are presented in this chapter. The results are presented as follows: (i) the model and scaled infiltration parameters, (ii) performance predicted by the optimisation system, (iii) performance based on actual (measured) infiltration, and (iv) per-formance achieved by the farmer. The challenges encountered in the field trials are explained.
Chapter 6 - The results of the series of evaluations of the preliminary results undertaken using the SISCO model are presented in this chapter. These sim-ulations were undertaken to evaluate the effect of using alternative control and management strategies on the optimisation system performance. The parameters investigated are: objective function, flow rate, irrigation deficit, the infiltration scaling process, the model curve, advance distance and multi-furrow evaluation.
Chapter 7- This chapter presents the final results undertaken during the 2011/12 irrigation season to prove the system. The changes effected in the these trials based on the experiences of the first trials are explained as well as their impacts.
Chapter 2
Review of automation, control
and optimisation in surface
irrigation
2.1
Introduction
The broad and specific context of this work has already been established in the previous chapter. In this chapter past work related to automation and control of surface irrigation is reviewed and evaluated, with emphasis on furrow irriga-tion. Although the focus of this dissertation is furrow irrigation, past work on border/bay and basin irrigation is included because some of the techniques used in those systems might possibly be adapted to the furrow system.
2.2 On-farm water delivery in surface irrigation systems 20
are presented. Finally, the chapter presents a comprehensive review of past and existing designs of automated surface systems, including the model selected as the basis for the design of a furrow irrigation system for this project.
2.2
On-farm water delivery in surface irrigation
systems
The mode of water delivery into a surface-irrigated field determines to a large extent the degree to which the irrigation system can be automated, controlled or optimised. Prior to reviewing other related aspects of surface irrigation, it is necessary to discuss the different methods of water delivery with particular em-phasis on their potential for application in automated surface irrigation systems. Water delivery system as used in this dissertation refers to the technique em-ployed to supply water to an irrigation basin, border or furrow. In the majority of the surface irrigation systems, either a head ditch running along one edge of the paddock or a buried pipe equipped with risers are used as sources of water. The common techniques used to transfer water from these sources are discussed below.
2.2.1
Gates
2.2 On-farm water delivery in surface irrigation systems 21
of these devices may be achieved by a mechanical timer or electronic solenoid, that is, they are time-based open loop systems Humpherys (1995c). The two types of gates however require resetting prior to an irrigation event.
Table 2.1: Commercially available channel/outlet gates
Gate Manufacturer Features Mode of control
SlipGate Rubicon Systems Measure flow when Electromechanical Australia fitted with sensors actuators
FlumeGateT M Rubicon Systems Control and Electromechanical
Australia measure flow actuators
Padman Padman Stops Rubber set in Mechanical times
Stop concrete structure
Water control AWMA Pty Ltd. Actuation systems Electromechanical,
gates (various) are custom made manual, hydraulic or
pneumatic actuators
Adapted from:Agbodo et al. (1997)
2.2 On-farm water delivery in surface irrigation systems 22
2.2.2
Siphons
The use of overbank siphons is a feature of furrow irrigation in the cotton and grains industries in Australia. The siphons commonly in use range from 50 to 77 mm internal diameter while the lengths vary from 3.5 to 4.5 m. These siphons are mostly made of low density polyethylene. One or more siphons may be used per furrow, with the use of more than one siphon being most common where alternate furrow irrigation (AFI) is practiced.
For water to flow from the head ditch into the furrows, one end of the siphon must be submerged in the water in the head ditch, while the other end could either be free draining (Figure 2.1) or submerged in the furrow stream (Figure 2.2). In the first case the head driving the flow is taken as the difference between the water level in the head ditch and the outlet end of the siphon. In the latter case the head is taken as the difference between the water levels in the head ditch and the furrow stream.
Figure 2.1: Siphon operating with free flow
(source: Purcell 1994)
Figure 2.2: Siphon operating with submerged flow
2.2 On-farm water delivery in surface irrigation systems 23
The recommended equation for calculating the siphon discharge (Wigginton 2008) is that proposed by Bos (1989). The equation derived from the energy equation is expressed as:
Q= πD
2
4
(
2g∆h
1.9 + λL D
)0.5
(2.1)
whereQ is the discharge (m3/s), D is the siphon internal diameter (m), g is the acceleration due to gravity (9.81 m/s2), ∆h is the operating head (m), λ is the
friction loss coefficient, and L is the siphon length (m). The value 1.9 in the denominator reflects the minor loss between the head ditch and the furrow.
In Eqn. 2.1 above the siphon diameter term is squared while all the factors influencing the siphon discharge are raised to power 0.5. The implication here is that siphon internal diameter is the single most important factor affecting the siphon discharge. For instance, a 10% increase in diameter of a 50 mm diameter, 4 m long siphon operating under a head of 500 mm leads to a 23.6% increase in discharge. On the other hand, a corresponding 10% increase in operating head results in only a 5% increase in discharge. Where the available operating head in the head ditch is limiting, irrigators have the option of using more than one siphon or siphons of larger diameter in order to increase furrow inflows. Both of these options will obviously decrease the number of furrows that can be irrigated at a time.
2.2 On-farm water delivery in surface irrigation systems 24
Spatial variability in siphon discharge at the field scale may be caused by:
• level and slope in the head ditch which affects head available on the siphons;
• differences in lengths, cross-sectional area and roughness of the siphons; and
• differences in the orientation and level of points of discharge of the siphons.
Fluctuation in the level of water in the head ditch is an important cause of siphon discharge variation with time.
The uniformity of furrow inflows is a major determinant of irrigation performance at the field scale (Smith & Gillies 2010). The accuracy of an evaluation based on a single furrow will therefore be affected as a result of siphon discharge variability. It is however possible to design head ditches using hydraulic models in order to minimise variability in outflows (Smith & Gillies 2010)
Perhaps the main drawback of siphons in the irrigation industry is that they have to be started or primed manually. This involves dipping one end of the siphon into the water in the head ditch and drawing the water in by way of creating suction. Other problems associated with the use of siphons include blockage by trash in the head ditch and drastic reduction of water level in the head ditch which may lead to cessation of discharge.
2.2 On-farm water delivery in surface irrigation systems 25
The increased labour cost especially in the developed countries has made the need to automate furrow irrigation more relevant. Automation of siphon discharge is technically difficult. Siphons operate independently from each other and tens or hundreds of siphons may be in use at any one time. It would probably be infeasible to automate each one of these siphons. The other challenge facing the automation of siphons is the fact that head ditches are typically kept empty and are only filled with water just before an irrigation event.
2.2.3
Pipes-through-the-bank (PTB)
PTB, made of materials such as PVC and polyethylene, are used to draw a large quantity of water from the head ditch into a group of irrigation furrows or border/basin. In the cotton industry for instance pipes of about 300 mm internal diameter are used to deliver water to between 12 - 20 furrows. To constrain the water to flow only into the intended furrows, rotorbucks or earthen embankments are constructed in the space between the PTB outlet and the cropped area.
Hydraulically, PTB are similar to syphons and may be designed using the same methods. The discharge through the PTB is a function of the pipe characteristics (internal diameter, length and roughness) and the head of water above the inlet in the head ditch. For most irrigators, the available head in the supply ditch influences the size of PTB used and hence the number of furrows that can be irrigated by a single PTB. Obviously cost is also an important consideration in sizing PTB.
2.2 On-farm water delivery in surface irrigation systems 26
possibility of accelerated flows in some furrows especially those that are wheel-tracked or slightly lower in elevation. Maintenance of the rotorbucks is often required throughout the irrigation season.
The majority of the PTB in use in the cotton industry have a flap valve and an extended arm at the inlet point in the head ditch side of the bank used to control flow (Figure 2.3a). The opening and closing is often done manually, but there is a great potential for automation using existing technologies. This was demonstrated at a furrow irrigation automation trial site at in the Gwydir Valley (Figure 2.3b) whereby each PTB inlet mechanism was automated allowing remote control using the ‘Aquator’ system (AWMA 2009).
Figure 2.3: PTB in the cotton industry
2.2 On-farm water delivery in surface irrigation systems 27
2.2.4
Gated pipe
Gated pipes used for distributing water into irrigation furrows can either be rigid (made of plastic or aluminium) or flexible/layflat with outlets to each furrow. The outlets, which can either be fixed or adjustable, are normally spaced according to the crop row spacing. Rigid gated pipes are rarely used in the Australian irrigation sector mainly because of difficulty experienced in transportation. Layflat is widely used in the sugar industry, but has so far not been successfully applied in the cotton industry because of the high flow rates required (Smith & Gillies 2010).
The hydraulic performance of gated pipe is primarily a function of the gate char-acteristic and pipe diameter. In the case of gated layflat, hydraulic character-istics are also influenced by the shape of the layflat which in turn varies with the fluid pressure (Humpherys & Lauritzen 1962). To determine the frictional losses, the Darcy-Weisbach, Hazen Williams and Manning equations may be used (Humpherys & Lauritzen 1964). However these methods must be modified to fac-tor in the shape facfac-tors of the layflat. Humpherys & Lauritzen (1964) suggested the experimental calibration of the friction coefficient in the Darcy-Weisbach equation. Further work by the same author produced a plot of head-diameter and height-width ratios which can be used to determine the cross-sectional area of the layflat at any degree of roundness.
2.2 On-farm water delivery in surface irrigation systems 28
Trout & Mackey (1988) reported a coefficient of variation (CV) of 25% in furrow inflows from a gated pipe (rigid) delivery system. This variability is a matter of the hydraulic design of the gated pipe system. Computer simulation programs for instance GPIPE (Smith 1990) can be used to reduce this variability. A detailed discussion of the hydraulic characteristics of the layflat gated pipe is found in Appendix A.
2.2.5
Bankless channels
As the name suggests, bankless channel systems are a series of bays whose supply channel or head ditch has no bank in the field side. The bays may be level or with a small slope in either direction (that is, towards or away from the channel). These systems are relatively new to Australia. Published literature suggests that they were initially used in the 1990’s to improve the water use efficiency of rice based farming systems (Grabham et al. 2008).
A common configuration of bankless channel irrigation is shown in Figure 2.4. The upward slope towards the tail-end of the bay ranges from 0.01 to 0.08% while the elevation difference between the bays is about 0.15 m (Grabham et al. 2009). The bankless bays are irrigated in sequence, starting with the one nearest the supply inlet. Gates are installed along the bankless channel aligned with each bank separating the bays and are used to block water forcing it to flow along the furrows of a single bay. Once the bay has been irrigated, the gate is opened thus water from the supply channel as well as the drainage from the previous bay is admitted into the next bay.
2.2 On-farm water delivery in surface irrigation systems 29
Figure 2.4: Schematic diagram of a bankless channel irrigation system
(source: Grabham et al. 2009)
2.3 Sensing and communication systems 30
Figure 2.5: Bankless channel irrigated field in St George, Queensland
2.3
Sensing and communication systems
2.3.1
Advance measurement
Irrigators often use their intuition and experiences to determine the time to cut-off water flow into an irrigation bay/basin or furrow. In bay irrigation for instance, the inflow is co