Research Report No 231
The Barriers to Childcare
Provision
Claire Callender South Bank University
The Views expressed in this report are the authors' and do not necessarily reflect those of the Department for Education and Employment.
© Crown Copyright 2000. Published with the permission of DfEE on behalf of the Controller of Her Majesty's Stationery Office. Applications for reproduction should be made in writing to The Crown Copyright Unit, Her Majesty's Stationery Office, St Clements House, 2-16 Colegate, Norwich NR3 1BQ.
A
UTHORSHIP ANDA
CKNOWLEDGEMENTSThe Policy Studies Institute (PSI) was commissioned by the Department for Education and Employment to undertake this study while Claire Callender, the main author of this report, was working at PSI. On leaving PSI to take up a Chair in Social Policy at South Bank University, Claire Callender continued working on the study.
Claire Callender undertook much of the research with Michael White of PSI who was responsible for undertaking the literature review and modelling the take-up of childcare. The summary findings of the modelling are included in Chapter 2 of this report.
There are several people I would like to thank for their help and support while undertaking the study. First, I would like to thank those in the Department for Education and Employment who commissioned the study, especially Jenny Wight, Richard White and Richard Bartholomew. Next I am indebted to Nick Smith of Research Partnership who undertook the postal survey on PSI’s behalf, and to BMRB, especially Andrew Thomas, who carried out the focus groups. I also want to thank my ex-colleagues at PSI for their involvement in the work, especially Michael White and Karen McKinnon who undertook the computer analysis. Finally I would like to thank all the childcare providers who took part in the survey.
All the views expressed in this report are solely those of the authors.
CONTENTS
E
XECUTIVES
UMMARY 81 I
NTRODUCTION 191.1 Introduction 19
1.2 Background to study 19
1.3 Research aims and objectives 23
1.4 Research methods 24
1.5 Outline of the sample of providers 25
1.6 Outline of the report 27
2 R
EVIEW OFF
ACTORSA
FFECTINGW
ORKINGM
OTHERS’
T
AKE-
UP OFC
HILDCARE 282.1 Introduction 28
2.2 Main findings of the research concerning childcare supply 29
2.3 Other findings with possible policy relevance 31
2.4 Main conclusion and summary 32
3 T
HEN
ATURE ANDS
COPE OFP
ROVISION 333.1 Introduction 33
3.2 Who provides childcare services 36
3.3 Scale of provision 37
3.4 Age of children for whom care was provided 40
3.5 Structure of provision 43
3.6 Other characteristics of the providers 45
4 T
HED
EMANDF
ORC
HILDCARE 484.1 Introduction 48
4.2 Optimum capacity? 48
4.3 Vacancies 49
4.4 Waiting lists 52
4.5 The relationship between vacancies and waiting lists 55
4.6 Summary 57
5 O
BSTACLES TOS
ETTING UPC
HILDCAREP
ROVISION 605.1 Introduction 60
5.2 Greatest obstacles to setting up provision 60
5.3 Costs 62
5.4 Infrastructure and information 66
5.5 Legislation and regulation 69
5.6 Summary 71
6
O
BSTACLEST
OR
UNNINGC
HILDCAREP
ROVISION 736.1 Introduction 73
6.2 Greatest obstacles to running provision 73
6.3 Costs 74
6.4 The economics of provision 77
6.5 Infrastructure and information 82
6.6 Legislation and regulation 84
7
O
BSTACLEST
OP
ROVIDINGH
IGH-Q
UALITYC
HILDCARE 897.1 Introduction 89
7.2 Who works in childcare 90
7.3 Greatest obstacles to providing high-quality childcare 90
7.4 Staff’s terms and conditions of employment 92
7.5 Training and qualifications 96
7.6 The economics of provision 101
7.7 Summary 102
8
I
NCREASINGC
HILDCAREP
ROVISION ANDI
MPROVING ITSQ
UALITY 1048.1 Introduction 104
8.2 Greatest obstacles to expanding existing provision 104
8.3 Incentives to childcare providers 108
8.4 Policies for increasing childcare provision 109
8.5 Summary 119
A
PPENDIX1 R
ESEARCHD
ESIGNANDM
ETHODS 122LIST OF TABLES
Table 1.1 Unweighted sample of childcare providers by category of provider 26 Table 1.2 Weighted sample of other childcare providers by category of provider 27
Table 3.1 Range and main type of childcare provided 34
Table 3.2 Range of provision by main type of childcare provided 35
Table 3.3 Range and type of childminding provided most 36
Table 3.4 Main type of childcare provided by sector 37
Table 3.5 Main type of childcare provided by number of children that could cater for 38 Table 3.6 Main type of childcare provided by size of provider 39 Table 3.7 Type of childminding provided by number of children looked after 39 Table 3.8 Main type of childcare provided by ages of children catered for 40 Table 3.9 Age of children currently catered for by main type of childcare provided 42 Table 3.10 Type of childminding provided by age of children looked after 43 Table 3.11 Hours of childcare provided by main type of childcare provided 44 Table 3.12 Number of days per week childcare provided by main type of childcare 44
provided
Table 3.13 Flexibility of provision by main type of childcare provided 45 Table 4.1 The extent to which providers have had the maximum number of children they49
could take care over the past 12 months by the main type of childcare provider
Table 4.2 Vacancies over the past 12 months by main type of childcare provider 50 Table 4.3 Age of children for whom providers had vacancies over the past 12 months 51
by maintype of childcare provided
Table 4.4 Waiting list by main type of childcare provided 52
Table 4.5 Number of children on waiting lists by main type of childcare provided 52 Table 4.6 Age of children on waiting lists by main type of childcare provided 54 Table 4.7 Relationship between vacancies and waiting lists by type of childcare provided 56 Table 5.1 The greatest obstacles stopping others setting up childcare provision by main 61 type of childcare provided
Table 5.2 Whether set up costs were obstacles stopping others setting up childcare 63 provision by main type of childcare provided
Table 5.3 Whether factors concerning infrastructure and information were obstacles 67 stopping others setting up childcare provision by main type of childcare provided Table 5.4 Whether legislation and regulation covering childcare provision were obstacles70
stopping other setting up childcare provision by main type of childcare provided Table 6.1 The greatest obstacle to continuing to provide childcare by main type of 73 childcare provided
Table 6.2 Whether costs were obstacles to continuing to provide childcare by main type 75 of childcare provided
Table 6.3 Gross annual salary by main type of childcare provided 76 Table 6.4 Whether the economics of provision were obstacles to continuing to provide 79
childcare by main type of childcare provided
Table 6.5 Whether infrastructure and information issues were obstacles to continuing 83 to provide childcare by the main type of childcare provided
Table 6.6 Whether legislation and regulations were obstacles to continuing to provide 86 childcare by main type of childcare provided
Table 7.1 The gender of the respondent by main type of childcare provided 90 Table 7.2 The greatest obstacle to providing high quality childcare by main type of 91
childcare provided
Table 7.3 Whether employees’ terms and conditions of employment were obstacles to 93 providing high -quality childcare by main type of childcare provided
Table 7.4 Gross annual salary by gender 95
Table 7.5 Respondents’ highest qualification by main type of childcare provided 97 Table 7.6 Whether training and qualifications were obstacles to providing high-quality 99
childcare by main type of childcare provided
childcare by main type of childcare provided
Table 8.1 The greatest obstacles to increasing the number of hours of childcare 105 provided by main type of childcare provided
Table 8.2 The greatest obstacles to increasing the number of childcare places by main 106 type of childcare provided
Table 8.3 The greatest obstacles to diversifying provision by main type of childcare 107
provided
Table 8.4 What could be done to increase the number of childcare providers by main 108 type childcare provided
Table 8.5 The most effective change to increase the number of childcare providers by 109 main type of childcare provided
Table 8.6 The extent to which policies affecting providers’ costs would help increase 110 the number of providers by main type of childcare provided
Table 8.7 The extent to which policies affecting the economics of provision would help 113 increase the number of providers by main type of childcare provided
Table 8.8 The extent to which policies affecting the infrastructure and information 115 would help increase the number of providers by main type of childcare provided Table 8.9 The extent to which policies affecting legislation and regulation would help 117
increase the number of providers by main type of childcare provided
E
XECUTIVES
UMMARYIntroduction
This is a report of the findings from a study commissioned by the Department for Education and Employment on the barriers to childcare provision undertaken by Professor Claire Callender of South Bank University and the Policy Studies Institute (PSI) .
Research aims and objectives
The overall aim of the project was to establish what, if any, are the barriers to the provision of childcare services for children under the age of 16. The study’s objectives were:
• to assess the nature and the extent of both the demand for and supply of different types of childcare provision taking into account children’s ages, the geographical spread; and the costs to parents;
• to identify the unmet demand for childcare and the reasons for this by examining and identifying any barriers to supplying different types of provision; and
• to explore practical solutions to overcoming barriers to the supply of childcare provision.
This report focuses primarily on the second and third research objectives while another concentrates on the first.
Research methods
The overall research project consisted of:
• Desk research to review the literature and existing data on the nature and extent of both the demand for and supply of childcare.
• Analysis of secondary data sources to assess the potential unmet demand for childcare services.
• Interviews with 20 key organisations concerned with childcare provision.
• Five focus group discussions with childcare providers and potential providers carried out in May 1998 in three separate locations to reflect a range of provision in terms of size and type as well as inner city/urban and rural areas
There is no readily accessible and comprehensive data source on all childcare providers in the UK. Consequently, the sample of providers in this study is not necessarily nationally representative.
This report discusses the findings from the interviews, focus group discussions and the survey of providers.
Factors affecting working mothers’ take-up of childcare
Available information concerning the costs of childcare proved inadequate for an analysis concerning the effects of costs on the demand for formal childcare. However, the analysis showed that the demand for formal childcare was influenced by the local availability of two kinds of childcare services:
• Childminder places - affecting formal childcare as a whole; and
• Out of school club places - affecting formal childcare exclusive of childminding.
A similar influence was not demonstrated for day nursery places: the relationship was in the same direction, but not strong enough to be considered reliable.
All analyses netted-out the effects of numerous other potential influences on the demand for childcare, including those influencing the mother’s employment, the ages and numbers of her children, and family resources. It is therefore reasonable to interpret the findings as showing that lack of availability of childcare services was constraining the demand for childcare. Equivalently, the findings can be interpreted as indicating a latent demand for childcare, which was released by the availability of additional childcare services.
The nature and scope of childcare provision amongst the providers in the sample
Type of provision offered by the providers surveyed
• Three-quarters of childcare providers (excluding childminders) offered only one type of provision while the remainder supplied more than one.
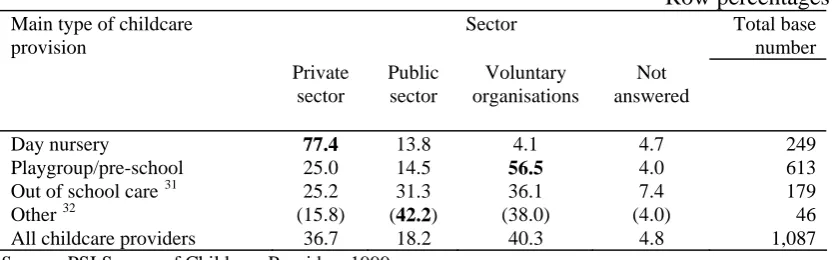
• Day nurseries were predominately (77%) run by the private sector. Nearly all of them (96%) classified this type of childcare as their main provision.
• Most (56%) playgroups and pre-school schemes were run by voluntary organisations and these dominated voluntary organisations’ childcare provision. • The vast majority (93%) of organisations running playgroups identified this type
of childcare as their main form of childcare provision.
• Four out of five childminders most often looked after children during working hours but they were willing to care for them at other times, except late at night and over the week-end.
Scale of provision among the providers surveyed
• The maximum number of children providers (excluding childminders) could take was 30 on average, and the median was 24.
• School holiday schemes and day nurseries could cater for more on average, 37 and 54 respectively.
• Most (52%) playgroups, and before and after school providers (39.3%) catered for between 21-30 children, on average.
• Childminders looked after three children, on average.
Age of children catered for among the providers surveyed
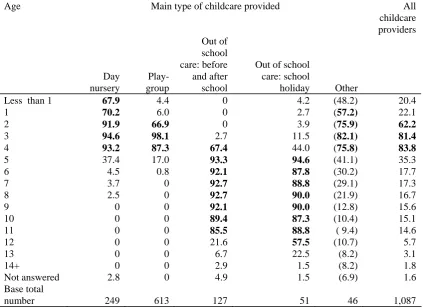
• Among all the providers surveyed, care was most widely available for 4 year olds and least available for children aged 13 and above.
• There were significant differences in the age groups of children catered for depending on the type of provider:
¾ day nurseries primarily looked after babies and children up to 4 years; ¾ playgroups and play schemes catered largely for 2-4 year olds;
¾ children aged 5 and over were most often looked after by out of school provision which also catered for the broadest age group of children; and
¾ the average age of children looked after by childminders was 2.4 years.
The structure of provision among the providers surveyed
• The hours of care available per day varied by the type of provider:
¾ the vast majority of day nurseries (95%) and childminders (89%) usually provided at least seven hours of care a day; and
¾ most playgroups (72%) and out of school childcare (62%) provision lasted for 3-4 hours a day.
• The majority of all providers, including childminders, usually provided care for five days a week.
• very small proportion of providers normally required children to attend on a full-time basis
¾ the norm for playgroups and ‘other’ types of provision was part-time care; and ¾ the norm for day nurseries, out of school childcare, and childminders was a
combination of full and part-time care
The most comprehensive care for working parents was provided by day nurseries and childminders.
A rather confusing picture emerges about the demand for and supply of childcare. Some factors suggest that there may be a surplus of places while others point to shortages.
Optimum capacity
• The vast majority of providers had had some slack over the previous year and appeared to have had the capacity to take more children:
¾ one in five providers had cared for the maximum number of children they could take in the 12 months leading up to the survey; and
¾ one in six had never operated at full capacity over this period.
• Childcare providers, but not childminders, offering care every day of the week and on a full-time basis - the most comprehensive care - were the least likely to have any spare capacity.
Vacancies
• Up to four in five providers had had some vacancies in the 12 months prior to the survey, suggesting some slack in the system:
¾ day nurseries and playgroups had the highest vacancy levels; and ¾ providers offering ‘other’ types of care the lowest levels.
• Vacancies were most likely to be for children aged 3 years old:
¾ over half of all providers with vacancies had spare places for this age group; and
¾ the proportion reporting openings for 3 year olds ranged from 68 per cent to 29 per cent.
• Childminders were mostly likely to have some spare capacity for babies under one year.
• Providers offering out of school childcare had most space for 7 year olds.
• All providers (except childminders) had the most vacancies for the age group of children they most frequently catered for – indicating an excess of supply over demand.
Waiting lists
• Despite the high level of vacancies reported, there appeared to be considerable unmet demand. Just under half of the providers (excluding childminders) had waiting lists for children they would like to take, but for whom no places were available.
• The proportion of providers with a waiting list varied with each type of provider ¾ day nurseries were most likely to have waiting lists (67%) ; and
¾ childminders were the least likely (16%).
• Most providers had waiting lists for between 1-10 children but the larger the provider the greater the number of children on their list.
The relationship between vacancies and waiting list
¾ just under a half of all providers with vacancies, had no waiting lists; ¾ a further, 13 per cent had no waiting lists but had vacancies; and ¾ over a third of all providers had both vacancies and waiting lists.
• This discrepancy between supply and unmet demand could have been due to a variety of factors such as:
¾ a mismatch between the ages of children for whom there were vacancies, and the ages of the children needing a place;
¾ frictional vacancies which arise where parents spend time looking for childcare provision with the right characteristics, and when children are withdrawn at short notice for various reasons;
¾ inefficiency in the way in which the childcare providers handled both their vacancies and waiting lists;
¾ the fact that some providers run on a termly cycle or only took new children at certain times of the year; and
¾ most important of all, vacancies may be a poor proxy for the supply of places while waiting lists may not be an accurate indicator of unmet demand.
Obstacles to setting up childcare provision according to the providers surveyed
The greatest obstacles to setting up new childcare provision
• The three interdependent categories of obstacles, which were the greatest deterrent to setting up new provision were associated with:
¾ infrastructure and information particularly, finding suitable premises; ¾ costs; and
¾ the economics of provision, especially the time it took to fill childcare places. • There was very little variation between providers in the greatest obstacle they
identified, but childminders were much more likely to be hindered by the governing legislation and regulations than were others.
Set-up costs
• The obstacle most frequently mentioned by all providers (except childminders) was the cost of buying equipment – cited by nearly three in five.
• The major obstacles for the different types of providers were:
¾ buying childcare premises – cited by nearly a half (47%) of the day nurseries and a third of out of school childcare providers;
¾ converting or adapting premises – reported by over a third (36%) of playgroups and nearly three in ten (28%) ‘other providers’; and
¾ the time it took to fill up places – affecting a quarter of all childminders.
Infrastructure and information
¾ finding suitable premises mentioned by nearly a third of day nurseries, nearly a quarter of out of school childcare providers, one in five playgroup and ‘other providers’; and
¾ a lack of support for small businesses mentioned by just under one in ten childminders.
• Recent government initiatives to help small businesses may help childminders.
Legislation and regulation
• Meeting the requirements of the 1989 Children Act was at the same time the obstacle most frequently mentioned (25%) by all providers and the least important factor (69%). The government is aware of these issues and some of them have been addressed in the recently published Care Standards Bill 1999 and other announcements made in August 1999.
• The major impediments for the different types of providers were:
¾ getting planning permission from local authorities to set up new provision mentioned by a quarter of day nurseries, one in fourteen ‘other providers’, and just one in twenty playgroups; and
¾ the time it took to register with their local authority mentioned by one in five childminders and one in eight out of school childcare providers.
Obstacles to running childcare provision among the providers surveyed
The greatest obstacles to continuing to provide childcare
• Providers’ greatest obstacles to continuing to provide their services were associated with:
¾ the economics of provision identified by a third of all them, particularly how much parents could afford to pay for childcare and the perceived threat of competition from schools providing nursery education. Three out of ten day nurseries, over two in five playgroups, and nearly three in five childminders identified this; and
¾ the costs, especially the ongoing costs and general lack of funding which hindered two out of five ‘other providers’ and three in ten out of school childcare providers.
Costs
• The major obstacles for the different types of providers were:
¾ wages, mentioned by all providers (except childminders). Playgroups were the most likely to single them out and ‘other providers’ the least likely (69% compared to 44%); and
¾ registration and inspection costs impacting on over two out of five childminders.
The economics of provision
• The obstacle most commonly cited by all providers was how much money parents could afford to pay for childcare – mentioned by over three-quarters of all providers.
• The major obstacles for the different types of providers were:
¾ the belief that childcare should be cheap, mentioned by three in five childminders and two in five day nurseries;
¾ the perceived threat of competition from schools providing nursery education identified by well over half (55%) of playgroups and over a quarter (27%) of ‘other providers’; and
¾ how much parents could afford to pay for childcare, mentioned by over two out of five out of school childcare providers.
Infrastructure and information
• The obstacle most frequently reported by all providers was their lack of expertise in marketing, cited by a third of all providers (except childminders).
• The major obstacles for the different types of providers were:
¾ lack of expertise in marketing childcare provision for about one in ten day nurseries, playgroups, and ‘other providers’; and
¾ the lack of public transport for one in seven out of school childcare providers and one in twenty childminders.
Legislation and regulation
• The most frequently selected impediment was differences in the regulatory standards between different types of providers, identified by over two in five of all providers (except childminders).
• The major obstacles for the different types of providers were:
¾ differences in the regulatory standards between different types of providers, mentioned by a third of day nurseries, an eighth of playgroups and a tenth of ‘other providers’;
¾ differences in the way local authorities interpreted the 1989 Children Act’s regulations and guidelines, mentioned most often by out of school childcare providers; and
¾ local authorities not policing unregistered childminders mentioned by the vast majority of childminders.
Obstacles to providing high quality childcare among the providers surveyed
The greatest obstacles to delivering high-quality childcare
Providers’ greatest obstacles to delivering quality care were:
¾ staff’s terms and conditions of employment, especially staff’s wage levels mentioned by a quarter of all providers (excluding childminders) and especially day nurseries, playgroups, and ‘other providers’; and
¾ the economics of provision, especially how much providers could charge for childcare which troubled three in ten out of school childcare providers and two in five childminders.
Terms and conditions of employment
• The obstacle most frequently hindering all providers’ (except childminders) delivery of high-quality care was their ability to recruit suitably qualified staff. Over four in five of all providers cited such recruitment difficulties.
• The major problems for the different types of providers were:
¾ the low wage levels of childcare staff, mentioned by seven out of ten playgroups, three in five day nurseries and half of ‘other providers’; and
¾ the lack of suitably qualified and experienced staff, mentioned by three in five out of school childcare providers.
• Three in five survey respondents’ gross annual salary was less than £10,000 and this proportion rose to nearly nine in ten for childminders.
• So, whilst providers recognised salary costs were a major obstacle to continuing to provide childcare, they also acknowledged poor wage levels were a major hurdle to recruiting good-quality staff and providing a good-quality service.
Training and qualifications
• Overall, the level of survey respondents’ qualifications was not very high, especially among childminders. All providers were most likely to identify the costs of training as an obstacle to delivering high quality care. Four out of five of them (except childminders) mentioned these costs.
• Monies allocated to the Standards Fund for training and development may help with some of these issues.
The economics of provision
• Just as the affordability of childcare most frequently affected providers’ capacity to continue to provide services, so it was the most common factor influencing providers’ ability to deliver high-quality care. Nearly nine out of ten providers, including childminders, thought that how much money parents could afford to pay for childcare affected the quality of their provision.
• The major obstacles for the different types of providers were:
¾ how much parents could afford to pay for childcare for all providers including childminders, but except for ‘other providers’; and
• The childcare subsidies available from the Childcare Tax Credit should help with these issues.
Increasing childcare provision and improving its quality
Greatest obstacles to expanding existing provision among the providers surveyed
• The supply of childcare provision could be expanded if existing providers: ¾ increased the number of hours of care they provided;
¾ boosted the number of childcare places available; and
¾ diversified their provision by delivering other types of childcare services. • The greatest obstacle to all three strategies was:
¾ the size of providers’ premises particularly in relation to increasing the number of places (43%) but less so in relation to either raising the number of hours (32%) or diversifying their provision (23%).
• The greatest obstacles for different types of providers surveyed were:
¾ providers’ limited premises, which stopped both playgroups and out of school childcare providers from adopting all three expansion strategies;
¾ the economics of provision was paramount for childminders because they did not have any more time to increase their hours and/or were operating at their maximum capacity;
¾ inadequate premises prevented day nurseries from increasing the number of childcare places and undertaking other types of childcare but the economics of provision, namely the costs and returns on those costs stopped them increasing their hours; and
¾ ‘other’ providers’ premises militated against them increasing the number of places while costs stopped them both from boosting their hours and expanding into other types of childcare provision.
Most effective change for increasing the number of childcare providers
• All providers in the survey, irrespective of the type of childcare they provided, believed that the most effective way of increasing the number of providers was to give financial support to parents to help meet childcare costs. Overall, just over a third of all providers singled out this issue.
• These views suggest that the Childcare Tax Credit delivered via the Working Families Tax Credit is likely to help increase the number of providers.
Policies for increasing provision which affect providers’ costs
The policy most favoured, among all the providers surveyed, for reducing their costs and hence increasing provision was VAT free purchases. Nearly seven out of ten providers, and slightly fewer childminders, selected this policy.
• The most popular policies among the different types of providers were:
¾ reducing business rates supported by 86 per cent of day nurseries and over a half of ‘other providers’.
• Again, government policy has addressed the latter issue by changes in the rules on non-domestic rates in the private sector.
Policies for increasing provision which affect the economics of provision
• All the providers surveyed, irrespective of the type of care they supplied, favoured childcare subsidies for parents most of all. Nine out of ten supported this and believed it was the most effective policy lever for increasing provision. They recognised that the costs of childcare were a barrier to take-up, and hence had an immediate impact on its supply. So according to the providers, if childcare was more economically viable, more provision would be available. This finding confirms PSI’s econometric modelling on the factors affecting mother’s take-up of childcare.
• Again, government policy has taken on board these concerns via the Childcare Tax Credit.
Policies for increasing provision which affect the infrastructure and information
• The providers surveyed were most likely to believe that local audits of childcare provision and childcare needs would increase childcare provision overall. Three-quarters of them thought this.
• The most popular policies among the different types of providers were:
¾ local audits of childcare provision and childcare needs, advocated by around three-quarters of playgroups, ‘other providers’ and childminders; and
¾ information for providers and parents on all the different types of childcare provision in the locality, supported by seven out of ten day nurseries, and four out five out of school childcare providers.
• To some extent government measures have addressed these issues. The Early Years Development and Childcare Partnerships work with local partners to plan services. In addition, initiatives such as electronic information points in supermarkets will help improve the dissemination of information on local childcare provision, employment and training in the early years sector, benefits and family support.
Policies for increasing provision which affect the legislation and regulations
• The change favoured most of all by the providers was getting rid of the differences in the standards of childcare regulation and inspection. Overall, two-thirds of all providers (excluding childminders) thought this.
• The most popular policies among the different types of providers were:
¾ streamlining the system for regulating and inspecting all types of childcare provision, promoted by nearly two-thirds of out of school childcare providers and seven out of ten childminders.
• Again, several of these issues are encompassed in the changes in legislation published in December 1999 and changes to regulations announced in August 1999.
Policies for increasing provision which affect training and qualifications
• The providers surveyed were most enthusiastic about the greater availability of training leading to a recognised qualification as a means of increasing the number of providers. Nearly three-quarters of all providers (excluding childminders) favoured this approach.
• The most popular policies among the different types of providers were:
¾ the greater availability of training leading to a recognised qualification, supported by nearly four-fifths of playgroups, two-thirds of day nurseries, and nearly three in five ‘other providers’; and
¾ more training courses which lead to a recognised qualification, promoted by four in five out of school childcare providers and three-quarters of childminders.
1 I
NTRODUCTION1.1 Introduction
The Department for Education and Employment commissioned the Policy Studies Institute to examine the barriers to the provision of childcare services for children under the age of 16. The study was conducted by Professor Claire Callender of South Bank University. This report outlines the findings from interviews with key childcare organisations, focus group discussions with, and a survey of, childcare providers, which sought to identify the barriers to providing childcare. In addition, it summarises the key findings from other work undertaken by PSI that assessed the supply and demand of childcare provision using existing secondary data sources.
1.2 Background to study
1.2.1 The rising labour market participation of mothers and the need for childcare
Over the past 20 years, the number of married women in employment has increased by almost 50 per cent and this trend is expected to continue. This expansion has been especially marked amongst mothers and, in the last decade, amongst those with young children. Marital status used to be the most important indicator of women’s economic activity but this is no longer the case. Today responsibility for dependent children (i.e. under 16 years) is the most significant determinant of whether or not women work and the hours they work. In particular, the age of their youngest dependent child has a strong influence.
The Labour Force Survey shows that in Spring 19981 the economic activity rate for women of working age with dependent children was 67 per cent compared with 75 per cent for those without children. The activity rates were lowest amongst those with pre-school children and highest for those with pre-school-age children. Over the last decade, the proportion of women with no children who were economically active was unchanged. For women with dependent children it rose from 61 to 67 per cent while for women with children under 5 years, the rise was even more substantial from 45 to 55 per cent. Indeed, the largest rise in labour market activity has been amongst these women with pre-school age children. If these trends continue, women will account for an increasing share of the labour force and an increasingly high proportion of these women will be mothers of young children. In turn, this suggests an increasing demand for childcare.
1
Callender et al’s (1997) recent study Maternity Rights and Benefits in Britain 19962 has also highlighted some very important trends in mothers’ labour market behaviour which would suggest an increasing demand for childcare. Key issues to emerge from this study were:
• The rise in the proportion of women returning to work after childbirth. In 1996 two-thirds (67%) of women returned to work within 10-11 months of childbirth compared to less than a half (45%) in 1988.
• The amount of time women take out of the labour market for childbearing and childrearing has continued to fall. Thus in 1996, women on average took only 6 months maternity leave. So these women are returning to work when their children are still very young and in need of high levels of care.
• Increasing proportions of women who had worked full-time while pregnant are returning, and higher proportions are returning to full-time employment, especially first time mothers. In 1979, a fifth of women who had worked full-time during their pregnancy had returned to work compared to double the rate of part-timers (37%). By 1996, the proportion of full and part-time workers returning was nearly the same (69% and 64% respectively). So by 1996, over a third of all women returned to full-time work after childbirth compared with 20 per cent in 1988 and 7 per cent in 1979. This suggests that rising proportions of mothers need full-time childcare provision.
Callender et al (1997) also confirmed that issues about childcare inhibited women’s labour market participation and their return to work. Of those women who had worked during their pregnancy but did not return to work, over a third (35%) said that the main reason for not returning was that they could not earn enough to pay for childcare. Furthermore, one in ten (11%) said it was because they could not find suitable childcare. In other words, Callender et al’s (1997) study showed, like others before it, that the lack of appropriate and affordable childcare services hinders women’s return to work. Indeed a more recent study3 found that two-thirds of non-working mothers would prefer to work or study if they had access to good quality, convenient, reliable and affordable childcare.
Evidence from both this study, and Forth et al’s study of Family Friendly Working Arrangements in Britain 19964 also showed the positive influence of family friendly working arrangements on the rate of women’s return to work. The survey of employers showed that where employers operated childcare-related arrangements they were most likely to retain staff. Yet only one in ten employers operated such policies and only two per cent provided workplace nurseries. Similarly, the survey of new mothers showed that women’s return to work behaviour varied substantially depending on whether their pre-birth employer operated flexible and family-friendly employment practices. Women were least likely to return where their pre-birth employer had no such practices (56%), and were most likely to return where the greatest number were in operation (77%). Yet only three per cent of women used a workplace nursery or crèche and the same proportion
2
Callender C, Millward N, Lissenburgh S, Forth J (1997) Maternity Rights and Benefits in Britain 1996 Research Report No 67, Stationery Office, London.
3
La Valle I, Finch S, Nove A, and Lewin C (1999) Parent’s Demand for Childcare Department for Education and Employment Research Report No 176, London.
4
received financial help with the costs of childcare. It is to women’s use of different types of childcare provision that we now turn.
1.2.2 Childcare provision
Research based on a series of surveys of working parents has shown that there has been a rise in the proportion of working women using childcare. Research by Finlayson et al (1996) 5 shows that in 1994 the majority (55%)6 of working mothers used informal forms of childcare. Only 12 per cent exclusively used professional arrangements namely childminders, nannies, nurseries or crèches, nursery schools or playgroups, and after school or holiday play schemes. A further 19 per cent of mothers avoided the need for childcare by working only school hours or by working from home and 14 per cent said that their child did not require childcare because of their age.
A more recent study7 found that in 1999 a clear majority of parents (86%) used some form of formal or informal childcare in the previous 12 months, while a more narrow majority (57%) had used some in the last week. The household characteristic, which most strongly influenced use of childcare, was parental working status. Usage in the last week was highest for lone parents with full-time jobs (77%) and couples who both worked full-time (70%). Usage was also higher among families in the higher income groups and in non-manual occupations. These groups, who were more likely to use any childcare, also used it in greater quantities than other parents.
There is a variety of other sources of information on the type of childcare provision used by working parents. The most important and comprehensive of these is the Family Resources Survey. It shows similar trends although the exact proportions differ.8
Fully comprehensive data on the number of childcare places available in different types of provision for all children under 16 are not readily available. However, Department of Education and Employment data9 show that over the past 10 years in England both the numbers of providers and places available. The key providers are the voluntary sector and private organisations. Registered day nursery provision stood at 6,100 nurseries providing 203,00 places in 1998, approximately five times the 1988 levels. In 1998, there were 94,700 registered childminders, an increase of 20,000 since
5
Finlayson L, Ford R and Marsh A (1996) ‘Paying more for child care’ Labour Market Trends July, 295-303.
6
This includes 11 per cent who used a combination of formal and informal care arrangements.
7
La Valle I, Finch S, Nove A, and Lewin C (1999) op. cit.
8
The proportion of working parents using different forms of childcare provision varies depending upon both which women are included (i.e. all working women or only those with full-time working partners) and the age of the children (i.e. under 16 or younger).
9
1988. By March 1998 15,7000 playgroups with 383,00 places but in the last four years the number of places has fallen
1.2.3 ‘Meeting the Childcare Challenge’
In May 1998 the government published the Green Paper ‘Meeting the Childcare Challenge’ 11 which launched the National Childcare Strategy. It identified three main problems with childcare provision in the UK:
• the quality of the care can be variable;
• the cost of care is high and out of the reach of many parents; and
• in some areas, there are not enough childcare places and parents’ access to them is hampered by poor information.
Through the National Childcare Strategy and working in partnership, the Government committed itself to providing a framework within which good quality, affordable childcare could be developed. The overall aim of the National Childcare Strategy, according to the Green Paper (p.6) is
to ensure good quality, affordable childcare for children aged 0 to 14 in every neighbourhood, including both formal childcare and support for informal arrangements. The Strategy is founded on a commitment to promoting the wellbeing of children, offering equal opportunities for parents, especially women and to supporting parents in balancing work and family life.
In November 1998, the responses to the Green Paper were published. While the Strategy was enthusiastically welcomed, concerns were voiced about:
• services for the under threes
• the disadvantaged and the needs of families in rural areas
• children with disabilities and those with special educational needs • the needs of parents and children from ethnic minorities
• the needs of the homeless, travellers or refugees
• getting the balance right between the needs of children and those of parents.
Various policy measures have been introduced to meet the main problems identified in the Green Paper and in the National Childcare Strategy. The major ones include: • help with the costs of childcare via the Childcare Tax Credit, which is part of the
Working Families Tax Credit. • help to increase the supply:
¾ the introduction of the New Opportunities Fund primarily for increasing out of school childcare;
¾ changes to the Out of School Childcare Initiative so funding can be used for essential infrastructure support to ensure quality and sustainability of both new and existing out of school provision;
10
Children’s Day Care Facilities at 31 March 1998, England (1999) Stationery Office, London.
11
¾ the setting up of Sure Start to provides support services including childcare for children under four in disadvantaged communities.
• help to improve the quality:
¾ a new training and qualifications framework developed by the Qualifications and Curriculum Authority and the National Training Organisations for the Early Years and Playwork;
¾ new regulations and inspection procedures for early education and day care.
As a result of these and other measures, the Strategy has helped improve the supply of childcare provision. Government sources suggest that by June 1999, around 66,000 new childcare places had been created since the launch of the National Childcare Strategy in May 1998. Of these, some 63 per cent have been created through the Out of School Childcare Initiative and approximately a further 20 per cent through the Early Years Development and Childcare Partnership Plans. The remaining places are to be created by April 1999 for which funding has been allocated to the Further Education Funding Council.12 More recently the Education and Employment Secretary announced that ‘the government had created 76,000 new childcare places, approaching the annual target of 82,000 places in just six months ...Eighty per cent of the new places created so far are in the private and voluntary sector.’13
It is against this background that the Department of Education and Employment commissioned this study on the barriers to the provision of childcare.
1.3 Research aims and objectives
The overall aim of the project was to establish what, if any, are the barriers to the provision of childcare services for children under the age of 16. To meet this aim, the study had the following objectives:
• to assess the nature and the extent of both the demand for and supply of different types of childcare provision taking into account children’s ages, the geographical spread; and the costs to parents;
• to identify the unmet demand for childcare and the reasons for this by examining and identifying any barriers to supplying different types of provision; and
• to explore practical solutions to overcoming barriers to the supply of childcare provision.
This report focuses primarily on the second and third research objectives while another study concentrates on the first.14
12
Sixty Six Thousand New Childcare places – Hodge Exceeds Target (1999) Department for Education and Employment Press Release, 16 June.
13
Government exceeds targets on creating new childcare places – Blunkett (2000) Department for Education and Employment Press Release, 24 January.
14
1.4 Research methods
The overall research project consisted of the following:
• Desk research to review the literature and existing data on the nature and extent of both the demand for and supply of childcare.
• Analysis of secondary data sources to assess the potential unmet demand for childcare services.
• Interviews with 20 key organisations concerned with childcare provision. • Five focus group discussions with childcare providers and potential providers. • A postal survey of 1,281 childcare providers, including childminders.
This report examines the findings from the interviews, focus group discussions and the survey of providers. Full details of the methodology are outlined in Appendix 1.
1.4.1 Interviews
Twenty face-to-face semi-structured interviews were undertaken at the start of the project with senior personnel in key organisations concerned with childcare provision. Their prime purpose was to get a better understanding of the range of issues facing childcare providers and to help inform the development of the research instruments used in the focus groups. The interviews were conducted between January and March 1998.
The organisations included voluntary sector groups such as the Childcare Trust, National Childminders Association, Kids Club Network, Pre-School Learning Alliance; in the private sector groups concerned with promoting childcare such as LV Group - Childcare Vouchers, Work Family Directions; organisations focusing on links with business and employers such as Business in the Community, Employers for Childcare, Pan London Employers Network; and private, public and voluntary sector providers including a major au pair agency and their representative organisations such as the Local Government Association.
1.4.2 Focus group discussions
A total of five focus group discussions were conducted which explored a spectrum of opinion on the barriers to childcare provision in more depth than was possible through face to face interviews or a quantitative approach.
The five focus group discussions, each with eight participants, were undertaken with different types of childcare providers operating in the public, private and voluntary sectors.
• Two group discussions were with providers of non-profit making care, which included playgroups, crèches, before and after school care, holiday clubs and childminding;
• two groups were with providers of private day nursery care; and
Details of how individuals were selected for the focus groups are outlined in Appendix 1. The fieldwork was carried out in May 1998 in three separate locations, Preston, Leeds and Kendal in Cumbria, to reflect a range of provision in terms of size and type as well as inner city/urban and rural areas. Kendal, representing rural provision, had a mix of rural town and more isolated rural areas to reflect the different factors affecting provision depending on the degree of isolation and the density of population.
1.4.3 Survey of providers
The postal survey of childcare providers was undertaken to help quantify the prevalence of the barriers they face. It was important that the full range of different types of providers were included in the survey. However, there is no readily accessible and comprehensive data source on all childcare providers in the UK.15 Nor is there a single source of listings of all childcare providers. Consequently, it was not possible to get a nationally representative sample of childcare providers. Therefore, the sample was drawn from a sub set of organisations listed in the Directory of Childcare Information Services 1996 produced by Choices in Childcare, the most up-to-date edition then available. All the organisations selected from the directory were asked to provide details of providers within their locality. Thus, the sample of providers was not necessarily nationally representative.16 Care should be taken, therefore, when interpreting the findings of the survey.
The sample was stratified by category of provider and region.17 Childminders and other categories of childcare providers were surveyed separately and different questionnaires were used for each group to reflect their differing concerns. A total of 194 usable questionnaires from childminders were returned giving an effective response rate of 48 per cent. 1,087 questionnaires were received from other categories of childcare providers, equating to an effective response rate of 63 per cent. The fieldwork was conducted between January and May 1999.18
1.5 Outline of the sample of providers
1.5.1 Unweighted sample
The data provided by the organisations was supplied using the category of provider listed in Table 1.1. The distribution of the sample within these categories, unweighted, is outlined in this table.
15
The lack of a readily accessible comprehensive data source is a significant problem and has implications for policy development and for monitoring the impact of policy change.
16
It is not possible to assess the nature of any biases in the sample because no national data are available on the number and type of childcare providers.
17
For more details on sample selection see Appendix 1.
18
Table 1.1 Unweighted sample of childcare providers by category of provider
1.5.1 Unweighted sample
The data provided by the organisations was supplied using the category of provider listed in Table 1.1. The distribution of the sample within these categories, unweighted, is outlined in this table.
Category of childcare provider All Providers (%)
Private nursery 29
Playgroup 25 Childminders 15 Out of school childcare 14
School holiday schemes 9
Crèche 7
Local authority nursery 2
Base total number 1,281
Source: PSI Survey of Childcare Providers 1999
1.5.2 Weighted sample
The sample was divided into two groups of providers: childminders and all the other categories of childcare providers. In addition, the responses from childminders and the other categories of childcare providers were analysed separately because two different questionnaires were used for these two groups.
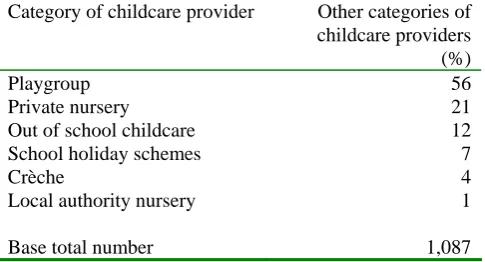
It was decided to weight19 the responses of the other categories of childcare providers to reflect their distribution in the sampled categories of providers. This distribution is shown in Table 1.2.20
19
For details of how the weighting was applied see Appendix 1.
20
Table 1.2 Weighted sample of other childcare providers by category of provider
Category of childcare provider Other categories of childcare providers (%)
Playgroup 56
Private nursery 21
Out of school childcare 12
School holiday schemes 7
Crèche 4
Local authority nursery 1
Base total number 1,087
Source: PSI Survey of Childcare Providers 1999
1.6 Outline of the report
The next chapter is a summary of our assessment of the supply and demand of childcare provision based on our analysis of secondary data. Thereafter, the report is based on the findings from the focus group discussions and the postal survey of providers. Chapter 3 looks at the nature and scope of provision while Chapter 4 examines the demand for childcare. The following chapters concentrate on the obstacles faced by providers: Chapter 5 explores them in the context of setting up provision; Chapter 6 in terms of running provision; Chapter 7 in relation to the quality of childcare provision, and the final chapter explores obstacles in relation to expanding existing provision.
2 R
EVIEW OFF
ACTORSA
FFECTINGW
ORKINGM
OTHERS’
T
AKE-
UP OFC
HILDCAREby Michael White, Policy Studies Institute
2.1 Introduction
The chapter examines the factors facilitating or restricting the take-up of childcare among working mothers using the Family Resources Survey and linked locality data.
2.1.1 Aim of the analysis
The analysis was carried out to assess how far the local supply of childcare services affected working mothers’ use of ‘formal’ childcare. Formal childcare refers to services which are supplied through the market or through public and voluntary agencies rather than through family or friends.
The further aim of carrying out this analysis was to estimate how far changes in the supply of services, or in factors which affect supply, would be likely to influence the demand for formal childcare.
2.1.2 Sources of data
The analysis made use of two main sources of data:
• The 1995/6 Family Resources Survey, which provides information for a large national sample of working mothers concerning their children, their financial circumstances, and their childcare use, together with some further background details. Childcare information was only available for mothers who were in employment.
• A database on childcare places available, by local authority area, which had been updated to 1995/6. This database was supplied by the Department of Health. It was limited to England and to services for children aged up to 8.
A few additional items of information were matched in by local authority area from other sources to complete the data for the analysis.
2.1.3 Methods of analysis
In the analysis, the supply of childcare was initially represented in two distinct ways: • In terms of the number of places available, per 1,000 population, for various types
• In terms of the average cost per hour of formal childcare used. This information was not available in the local authority database, so regional average costs were estimated from information supplied by mothers in the Family Resources Survey. Initial analysis indicated that the average cost of childcare, estimated in this way, was not sufficiently reliable to be used as the basis for estimating the effects of variations in costs on the demand for services. Accordingly, the further work focused upon the supply of childcare in terms of numbers of places available.
The chief analyses considered how far mothers’ take-up of childcare was influenced by local supply, while taking into account variations in the mothers’ characteristics and their family circumstances. The method used took particular account of those characteristics, which influence a mother’s participation in employment over the childrearing years, since employment propensity is a strong influence on the demand for childcare.
The factors directly taken into account included: age, ill-health of the mother, marital status, partner’s employment status, family income other than the mother’s own wage, home ownership, car ownership, number of children in various age-groups, ill-health of any child, and the population density of the area of residence. Some analyses also made use of the number of hours the mother worked, a measure of local female unemployment, and a coding of the administrative region.
For technical reasons, it was necessary to analyse the effect of each aspect of local childcare supply (such as childminder places or out of school clubs) separately. Care was taken to ensure that the approach was consistent across the analyses.
2.2 Main findings of the research concerning childcare supply
2.2.1 Effects of the supply of childminder places
Mothers’ probability of using formal childcare was found to be, on average, higher when the local provision of childminder places was greater, relative to population. Similarly, the number of hours of formal childcare used tended to be higher where the local provision of childminder places was greater.
These figures are, however, very probably an under-estimate. This is because childminder supply is averaged over quite a large area (a local education authority), while mothers are most likely to be affected by an increase or decrease in demand in their immediate vicinity. A more localised increase in supply should therefore have a larger impact on demand.
2.2.2 Effect of the supply of day nursery places
The analysis did not clearly demonstrate that the demand for childcare was influenced by the local supply of day nursery places. Although the demand for childcare was somewhat higher where day nursery places were more numerous, the relationship was not strong enough to be considered reliable.
In interpreting this negative result, it should be borne in mind that the numbers of day nursery places were generally very much smaller, and more variable, than the numbers of childminder places. This makes it inherently more difficult to identify an impact.
2.2.3 Effect of the supply of out of school club places
To avoid overlap with the analysis of childminder places, we considered the effect of out of school club places on demand for childcare excluding use of childminders.
Demand for formal childcare (except childminder services) was found to increase where the available places in out of school clubs was greater. A supplementary analysis showed that the number of out of school club places had no effect on the demand for childminder services.
In 1995/6, there was a very great local variation in the supply of out of school club places: the highest level observed in England was more than six-and-a-half times greater than the average for England. Calculations indicated that a mother living in an area with the maximum level of supply of out of school club places would be more than three times as likely to make use of formal childcare (except childminders) as one living in an area with an average level of out-of-school club places. Those living in an area with an average level of places would be about 20-25 per cent more likely to use formal childcare (except childminders) than those living in an area with the lowest observed level of places.
2.3 Other findings with possible policy relevance
2.3.1 Desire to work additional hours
It was found, in a supplementary analysis, that employed women who had formal childcare arrangements were less likely to wish to work additional hours, than women not using formal childcare. This suggests that those having formal childcare are more likely to be able to work up to the level of hours, which they prefer.
2.3.2 Effect of population density on demand
The probability of a mother using formal childcare as a whole was found to vary strongly with population density. This however did not apply to childcare excluding childminder services. Further investigation indicated that the difference was essentially one between the 20 per cent living in the most densely populated areas (which tend to be in the large metropolitan areas such as Greater London, Greater Manchester and the West Midlands), and those living in the remaining areas. The analysis showed that it was not a difference between rural and urban areas as such, nor was it a difference between Greater London and all other areas.
Additional calculations indicated that, of mothers with typical characteristics, little less than two-thirds were likely to use formal childcare if they also lived in an area of the highest observed population density.
This finding can perhaps be interpreted in terms of the distance to nearest services (specifically childminders), which will generally be least in areas of the highest population density.
Consistent with this, mothers in car-owning families were substantially more likely to use formal childcare, after allowing for the influence of family income.
2.3.3 Influence of the health of the mother or of her child
Formal childcare was somewhat more likely to be used where the mother had a longstanding problem of ill health, or where one or more of the children had a persistent health problem.
There was some suggestion that formal childcare was associated with ill health where other social problems were also present in the family, and this could represent the impact of local authority childcare support policies. However, the numbers in the various sub-groups were too small to make a reliable conclusion possible.
2.3.4 Regional and local variations in demand
2.4 Main conclusion and summary
Available information concerning the costs of childcare proved inadequate for an analysis concerning the effects of costs on the demand for formal childcare.21
However, the analysis showed that the demand for formal childcare was influenced by the local availability of two kinds of childcare services:
• Childminder places - affecting formal childcare as a whole;
• Out of school club places - affecting formal childcare exclusive of childminding.
A similar influence was not demonstrated for day nursery places: the relationship was in the same direction, but not strong enough to be considered reliable.
All analyses netted-out the effects of numerous other potential influences on the demand for childcare, including those influencing the mother’s employment, the ages and numbers of her children, and family resources. It is therefore reasonable to interpret the findings as showing that lack of availability of childcare services was constraining the demand for childcare. Equivalently, the findings can be interpreted as indicating a latent demand for childcare, which was released by the availability of additional childcare services.
21
3 T
HE NATURE ANDS
COPE OFP
ROVISION3.1 Introduction
This chapter, and the following chapters, calls upon the findings from the interviews with key childcare organisations, focus group discussions, and the postal survey of providers. In particular, it sets out the nature and scope of the childcare services provided. As stated earlier, findings from the childminders surveyed and other categories of providers surveyed have been analysed separately. These two groups will be referred to in the report as childminders and childcare providers.
As discussed in Chapter 1 (Section1.4.2) the qualitative data is based on the findings from five focus groups conducted in three different regions. In addition, as mentioned in Chapter 1 (Section 1.4.3) it is not possible to get a nationally representative sample of childcare providers. Therefore, the survey of providers reported on here is not necessarily nationally representative. Care should be taken, therefore, when interpreting the findings of the survey.
3.1.1 Type of childcare offered by childcare providers
All survey respondents were asked about the range of childcare they provided22. The most common sort of provision was playgroups offered by three out of five providers, followed by day nurseries, supplied by a quarter. A sizeable minority also ran some type of out of school provision, especially after school care (Column 2 Table 3.1).
Table 3.1 Range and main type of childcare provided
Column percentages
22
Type of childcare provision
Range of childcare provided23
Main type of childcare provided
Playgroup/pre-school 60 56
Day nursery 24 23
Out of school care – breakfast clubs/before school
10 0.2
Out of school care – after school 2 11
Out of school care – school holiday or schemes
20 5
Weekend, later night, overnight 1 0.2
Crèche24 7 4
Base total number 1,087 1,087
Source: PSI Survey of Childcare Providers 1999
Three-quarters of the providers in this sample were involved in just one type of childcare while a quarter supplied more than one. In addition, just under one in five providers claimed that their organisation ran other childcare establishments, in addition to the one where the respondent worked.
These multiple providers were asked about their main form of provision. This is set out in the last column of Table 3.1 along with the provision of those offering just one type of childcare.
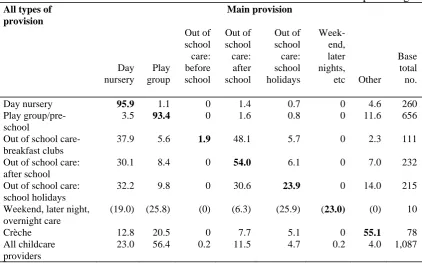
Table 3.2 illustrates the extent to which different types of childcare suppliers concentrated on a particular type of childcare provision. It shows that providers offering day nurseries were the most likely to focus exclusively on this type of childcare – the vast majority (95.9%) only supplied day nursery care. By contrast, organisations offering before school care and breakfast clubs were the least likely to only provide this type of care - under two one per cent of organisations provided it as their main form of provision (Table 3.2).
23
Multi-response so does not add up to 100%.
24
Table 3.2 Range of provision by main type of childcare provided25
Row percentages
All types of provision Main provision Day nursery Play group Out of school care: before school Out of school care: after school Out of school care: school holidays Week-end, later nights,
etc Other
Base total
no.
Day nursery 95.9 1.1 0 1.4 0.7 0 4.6 260
Play group/pre-school
3.5 93.4 0 1.6 0.8 0 11.6 656
Out of school care- breakfast clubs
37.9 5.6 1.9 48.1 5.7 0 2.3 111
Out of school care: after school
30.1 8.4 0 54.0 6.1 0 7.0 232
Out of school care: school holidays
32.2 9.8 0 30.6 23.9 0 14.0 215
Weekend, later night, overnight care
(19.0) (25.8) (0) (6.3) (25.9) (23.0) (0) 10
Crèche 12.8 20.5 0 7.7 5.1 0 55.1 78
All childcare providers
23.0 56.4 0.2 11.5 4.7 0.2 4.0 1,087
Source: PSI Survey of Childcare Providers 1999
Table 3.2 also shows which providers offered multiple provision and the type of provision. What is particularly interesting is the delivery of out of school care and the different patterns of delivery. Organisations involved in out of school care were likely to offer more than one type of out of school care. For example, nearly a half (48%) of all providers running before school care or breakfast clubs also provided after school care and saw after school care as their main provision. Nearly a third (30.6%) of all school holiday schemes were delivered by organisations also providing after school care. In addition, around a third of before and after school care and holiday schemes were provided by day nurseries.
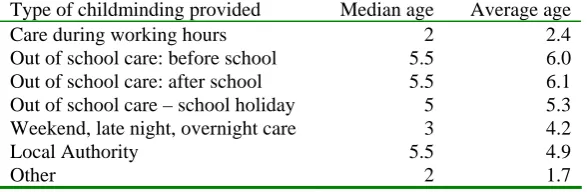
3.1.2 Type of childcare provided by childminders
Table 3.3 shows the full range of the sort of childminding that respondents could provide and the sort of