National Foundation for Educational Research
PARALLEL UNIVERSES AND PARALLEL
MEASURES: ESTIMATING THE RELIABILITY OF
TEST RESULTS
Dougal Hutchison
Tom Benton
OFQUAL/10/4709
July
2009
CONTENTS
Page No
Abstract 2
1. Introduction and background 3
2. Objectives of this report 5
3. What is measurement? 6
4. Sources of variation in a measurement 11
5. What is random variation and how does it arise? 14
6. Types of variation considered under reliability 16
7. Methods of calculating reliability: replication-based and model-based 19
8. Measures of reliability and measurement error 21
9. The public’s perception of measurement error or “the public’s” “perception
of measurement error”? 32
10. Nomenclature 35
11. Case study of reliability indices for a key stage 2 reading pre-test 38
12. Conclusions and suggestions 50
13. Reference list 53
14. Appendix: equations and formulae 59
15. Endnotes 64
Abstract
„Getting it right‟ is an important and increasingly contentious topic both in the
media and politically (Newton, 2009). It is important to be clear what is meant by reliability in the field of research and testing. The aim of this report is to help to provide as far as possible a framework to describe, interpret and assess reliability estimates from different sources. It discusses what is meant by measurement and its reliability, and outlines approaches to estimating it. It describes, in a relatively non-technical format, a range of statistics currently used or proposed for measuring reliability, under three headings, classical test theory (CTT), item response theory (IRT), and grading into a relatively small number of categories. An example of a recent investigation of reliability at key stage 2 is described. To keep the report as accessible as possible equations and formulae are not included in the main body, but listed in a separate appendix.
1.
Introduction and background
„Getting it right‟ is an important and increasingly contentious topic both in the
media and politically (Newton, 2009). It is important to be clear what is meant by
reliability in the field of research and testing. In everyday usage „reliable‟ is
defined as that which can be relied on. While this definition is somewhat circular, it does carry with it the implication that it can be relied upon to be right. The
technical definition is much narrower and can be viewed as the extent to which one would get the same answer under a (notional) repeat of the procedure. Reliability is described in Standards for Educational and Psychological Testing (AERA, APA, NCME, 1999) as
„the consistency of (…) measurements when the testing procedure is repeated on a population of individuals or groups.‟
We quote further from this useful publication to establish definitions,
„The usefulness of behavioural measurement presupposes that individuals and groups exhibit some degree of stability in their behaviour. However successive samples of behaviour from the same person are rarely identical in all pertinent respects. An individual’s performances, products and responses to sets of test questions vary in their quality and character from one occasion to another, even under strictly controlled conditions. This variability is reflected in the examinee’s scores. (…)
Because of this variation (…) an individual’s obtained score and the average score of a group will always reflect at least a small amount of measurement error.
To say that a score includes a component of error implies that there is a hypothetical error-free value that characterises an examinee at the time of testing. In classical test theory this error-free value is referred to as the person’s true score for the test of measurement procedure.’ (AERA, APA,
NCME, 1999)
In a wider application than simply educational and psychometric testing, error can be divided into systematic error or bias, and random error. Under the AERA et. al
definition given above measurement error is viewed solely as random fluctuation around a „true value‟, though Haertel (2006) and the National Institute of Standards
and Technology (Taylor and Kuyatt, 1994) make it clear that the distinction between error and systematic variation, and thus the operational meaning of reliability, varies according to the circumstances of the exercise. It will also be important here to distinguish between the everyday meaning and the specialist
meaning of „measurement error‟ used in testing and education research generally
(Hutchison, 2009; Newton, 2005). In everyday life „error‟ is a loaded term, while in scientific usage it relates to some kind of unexplained variation in a measurement, and the term is not a pejorative one.
Another approach, Generalizability Theory (see, e.g. Brennan, 2001), downplays the absolute distinction between systematic and random variation, preferring to analyse all variation, and emphasises that aspects of variation can be treated differently according to experimental design. Thus, for example, components of variation in a test score could be identified as being between pupils, between schools, between items, interactions between these and otherwise unexplained. Its strength lies in assessing the contribution of different sources of variation. We do not discuss this in detail here as it is assumed that it will be covered elsewhere in the papers commissioned for this exercise.
Under these broad definitions of reliability various methodologies and associated statistical calculations have been suggested for quantifying reliability. These alternative methodologies may approach the question of reliability from different directions and provide conflicting information (see, e.g. McDonald, 1985).
Furthermore the technical and mathematical details associated with each method can hide the underlying assumptions driving particular approaches.
2.
Objectives of this report
The aim of this report is to help to provide, as far as possible, a framework to describe, interpret and assess reliability estimates from different sources. Other useful descriptions of this topic may be found in Wiliam (2001), Black et. al (2008) and Rogosa (1999). We plan to produce a concise compendium of common
approaches to calculating reliability. As far as possible it has been written in non-technical language to allow decision makers to grasp the essentials of different approaches to reliability without the need to learn complex mathematics. In summarising different approaches to reliability we encompass the following questions:
What different approaches to alternative methodologies take to conceptualising „truth‟ and „error?
What assumptions do alternative methodologies make?
What are the strengths and weaknesses of different methodologies both in terms of operational ease and technical accuracy?
What are the factors that give rise to instability in results?
What aspects need to be included in a uniform framework for description of reliability findings?
3.
What is measurement?
Before attempting to define measurement error, it will be as well to be sure that we have a reasonable idea of what is meant by measurement. By measurement is meant a process, applied to an entity, that has the following three aspects,
a characteristic, a scale and
a means of assigning a number on the scale to that characteristic (Stevens, 1946).
Thus, if we consider that an individual has an identifiable skill such as reading ability, we can measure it by giving him/her a standard test. Measurement may also be required to fulfil other aims than simply assigning a number to a characteristic: for example Georg Rasch (1901980) and his followers considered that his 1-parameter logistic model implied a theory which enabled what they described as fundamental measurement in behavioural sciences (Wright & Stone, 1979)i.
Does the concept exist as a single clearly defined quantity?
Descartes stated „If something exists, it must exist to some extent, and if it exists to some extent, it must be measurable‟ii
. However the first clause of this brushes under that carpet a number of assumptions. Taking the example of reading ability, one can question whether in fact there is a single unidimensional concept such as reading abilityiii. On the one hand, reading ability corresponds to a concept that most people would accept as intuitive, and it would be generally agreed, for example, that on average reading ability is higher now in Britain than in the middle ages, or that 16-year-olds on the whole read better than 5-16-year-olds. On the other hand, it is well known that some individuals will perform better when a reading test assesses one dimension of reading, rather than another: for example the International Adult Literacy Survey (IALS) made separate assessments of Prose, Document and
Quantitative Literacy (Kirsch, 2001). Also, what is involved? Does reading ability include the ability to understand what is being read, rather than simply being able to decode the words? Even if we accept that the concept exists, there is still the
question of measuring it. The term constructs is typically used in this area rather than concepts, to emphasise that categories are deliberate creations chosen to organise experience into general law-like statements.
How much of the construct are we measuring?
No matter what one is aiming to measure, there will also be a series of steps, and probably discrepancies, between the construct and the measurement. Thus a cloze test, which comprises a number of sentences with blanks for the examinee to fill in, is very different from the everyday concept of a reading skill. Increasingly, for example in PISA (OECD, 2007), there is an attempt to make performance
assessments more like actual performance. It is possible to use more lifelike means of assessment in the classroom, but this can lead to questions of comparability especially if, as in part of the current National Curriculum Assessment in England, the measure is also used for accountability purposes.
The assessment of whether what is measured adds usefully to our knowledge of the characteristic in question is known as validity assessment (see, e.g. Kane, 2006). This is not to say that a valid measure is equivalent to the quantity being measured, but more that it is consistently related. Thus, a cloze test might be sufficiently closely related to actual everyday performance that it is legitimate to use this rather than any other more complex alternative. We are not discussing validity here, though this is an important consideration in educational measurement (Brennan, 2006).
How precise is the measurement?
Measurements are never going to be perfect, but the degree of precision associated can vary almost beyond the scope of human visualisationiv. In some areas
measurements can be made with such accuracy that the question of measurement error simply does not arise for all practical purposes. The standard avoirdupois pound is defined as 0.4535924277 Kg. (see Richards, Sears, Weir, & Zemansky, 1960) while atomic clocks are quoted as being correct to one second in one million years. At the other extreme, the age of the earth is quoted as having a range of 3,500,000,000 to 6,000,000,000 years with a mean in the area of 4,500,000,000 years (Encyclopaedia Britannica, 1981). Educational measurement is far from such extremes, but typically education measurements will be less precise than scientific ones.
Reliability
The construct of reliability in psychometric measurement is a very simple one: what happens if I make the same measurement again? There are many possible different ways in which one could make a measurement „again‟, and these are discussed in a
later section of this paper. The reliability of a test is the extent to which one gets the (notional) same answer under a (notional) repetition of the measurement. In
contrast with the everyday usage, this says nothing about the extent to which the measurement is correct. The inseparable converse of reliability is measurement error, the extent to which one gets a (notionally) different answer under a (notional) repetition of the measurement.
By a number of steps we have come a long way from the aim of trying to measure a construct. First, we define what we are trying to measure, but this is not to say that the construct is a justifiable one. Second, given that we accept this, any
measurement we can make is going to refer only to a selection, and probably a non-representative one, of the construct. Third, it is not certain that the measurement procedure we use will be unbiased. These three together essentially constitute validity. Fourth, and finally in this context, the construct of reliability considers to what extent results are consistent, regardless of validity. Factors which affect this consistency include using a sample of possible assessment items, and a sample of possible assessment occasions.
Other aspects
Before moving on to the next section, it will be useful to define three further distinctions.
Raw (additive) scoring and Item Response Theory
The type of scoring we are all familiar with from school days, simply adding up the marks to give a total score, is so intuitive as scarcely to require a name. However, to distinguish it from IRT approaches we refer to it as raw or additive scoring. Item response theory (IRT) approaches (see, e.g. Thissen and Wainer, 2001) assume that the probability of an examinee succeeding on an item in an assessment may be adequately summed up using a latent characteristic or trait of the examinee, together with characteristics of the item. In this context the trait would be referred to as the
ability or attainment of the individual. Generally a single dimension is used for each assessment. The relationship between the examinee‟s attainment and the
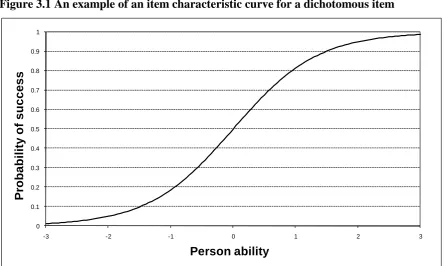
[image:10.595.107.552.241.507.2]probability of success for an item is described as the Item Characteristic Curve (ICC) for that item. Figure 3.1 shows an example of an item characteristic curve for a dichotomous [0,1] item with a difficulty equal to zero. As the ability increases from a value of -3 to +3, so the probability of succeeding increases from virtually zero to nearly unity.
Figure 3.1 An example of an item characteristic curve for a dichotomous item
0 0.1 0.2 0.3 0.4 0.5 0.6 0.7 0.8 0.9 1
-3 -2 -1 0 1 2 3
Pr o b a b il ity o f s u c c e s s Person ability
Norm referenced and criterion referenced.
Test scores may be roughly divided into norm-referenced and criterion
referenced. Norm-referenced interpretations locate an individual‟s score relative to the distribution of scores for some relevant comparison group. Criterion referenced interpretations, at least in theory, locate an examinee‟s position on some continuum of development or skill without reference to other individuals.
Conjunctive versus compensatory scoring
In some tests, especially criterion-referenced mastery tests, the requirement is that the examinee can succeed on all, or very nearly all, of the tasks, and certainly all of the important ones: an example of this would be the driving test. The original
conceptions of National Curriculum Assessment were of this form (Schagen and Hutchison, 1991). These would be described as conjunctive scoring (Green and Wigdor, 1991). By contrast, other tests would allow better performance on one area to compensate for poorer performance on another. These are described as
compensatory scoring. The archetypal version of this would be a total score model. The majority of education tests are of this form, though sometimes with some other criteria.
Most of the discussion here will relate to norm referenced tests with IRT or compensatory scoring. It is worth noting that some of the standard reliability estimation approaches, such as coefficient alpha, would not be applicable under many other conventions.
4.
Sources of variation in a measurement
A measurement involves assigning a number to a characteristic of an entity. This entity could be a piece of string, or the speed of light, or the performance of a pupil at key stage 2. An example of this last could be a measurement
of a specific characteristic of a specific entity
by a specific measuring entity, usually a person which takes place at a specific time
under specified conditions with a particular aim in view
using a specific measurement instrument
and transforming to the reported score in a specified way.
Thus, for example, if we see a score of 90, it could relate to the an assessment of the reading ability of Angela Brown, at age 11, using a cloze test, the test having been administered in her home classroom at 11.15 a.m. by a trained administrator with the caretaker mowing the lawn outside: results could be reported as
age-standardised scores, and intended to identify pupils with reading difficulties.
All of these are potential sources of variation in a measurement. Any or all of the details could have been changed and the result would in all probability have been different: for example the measurement could have been made of a different individual, by the classroom teacher, at a different time of day.
Specific characteristic.
A test could be of mathematics or of reading or another subject, and within a subject one could test different aspects. Thus for example the PISA mathematics tests are aimed to assess the pupil‟s grasp of mathematical principles rather than the ability to
carry out particular competences (Hutchison and Schagen, 2007)
Specific entity.
The test could be of any of the pupils in a class.
Specific measuring entity.
It could make a difference whether the test was administered by the pupil‟s own
teacher, by a different teacher, or by a trained administrator.
Specific measurement instrument.
There are a number of nationally standardised tests purporting to assess broadly the
same skills, but one would expect that results would be different in detail.
Assessments will also use only a sample of possible characteristics to be assessed.
Transforming to the reported score.
A test could be scored simply by adding the number of correct answers, or these could then be grouped or age-standardised. Alternatively an IRT method (Thissen and Wainer, 2001) could be used: (probably slightly) different results could be expected using 1-, 2-, or 3-parameter methods, and even between different packages carrying out the same methodv.
Takes place at a specific time.
Many people have a cyclical difference in performance by time of day- for example a post-lunch dip- or a longer cycle. So measurement taken in the afternoon is likely to be lower than near the start of the morning.
Under specified conditions.
Many such conditions are more a question of satisfying some yes/no criteria: the subject should be awake: the light should be good enough to see the test paper, etc. But other factors, such as the temperature of the room, the ambient noise, whether the test is high stakes or low stakes and so on, also will affect performance.
With a specific aim in view.
A test could be used to order the pupils in a class, so pupils would have different scores.
Changes in any or all of these would be expected give rise to changes in the
measurement. Even where it is assumed that we are using the same test or a parallel one on the same individual changes in the score are to be expected on a
re-administration. If in some way we were able to make a number of replicate
measurements of the length of a piece of string we would be likely to find that there was a degree of variation in the scores assigned in the later decimal places. We could assign this to random variation, knowing that there is a limit to human accuracy. However, it could be that there were other sources of variation in the
measure. Measurements could be made using cheap rulers, and the results would vary with the particular one used. It could also be that the length of the string itself varied, perhaps becoming shorter in humid weather. If we knew that one of the rulers was obviously inaccurate, we could discard it as being biased, or we could calibrate it to take account of the bias. If we used the same ruler on a number of occasions, then we would get the same bias each time and this would be described as systematic error. Conversely if height measurements were made by simply picking a ruler at random, then the differences between the rulers would be part of the random variation. Random variation, in effect, is what is left over after other defined factors are taken into account.
5.
What is random variation and how does it arise?
It is difficult to define randomness without using the words „random‟ (or equivalently „stochastic‟ or „by chance‟). The word „random‟ is defined in the
Dictionary of Statistical Terms (Marriott, 1990) as
„The word is used in senses ranging from “non-deterministic” (as in random
process) to “purely by chance”, “independently of other events” (as in “test of randomness”)’.
This is all rather circular. There are two main paradigms that can be used to explain how a random observation may arise.
Paradigm I
1) a process during the course of which an observation is created.
Paradigm II
2) random selection of a sample from a larger, frequently an infinite, group.
Paradigm I: Random process
Though it is difficult to define formally, everyone has some sort of a conception of what randomness means. A random process, they believe, is one which in some way „just happens‟, without any obvious cause, or if there is a precipitating event, it
does not cause the precise value observed. Processes such as tossing a coin or radioactive decay are often considered to be archetypes of this (though it is probable that tossing a coin is not actually a truly random process- see Diaconis, 2006).
Paradigm II: Random selection
”Something has happened, but you don‟t know what it is, do you, Mr Jones?”
Bob Dylan, slightly adapted
We all inevitably make decisions about a population based on a sample. For example even the most concerned parents are likely to choose a child‟s primary
school on the basis of a single visit. Similarly, couples frequently agree to get married on the basis of a relatively small sample of each other‟s behaviour. And so
on. Under this paradigm, when an element is selected, the randomness lies in the selection: the element itself could well be fixed.
Within the context of national assessment, and elsewhere, the concept of reliability has been extended beyond the aim of exact replication. Thus, later in this paper, we compare results from the live key stage 2 reading test with those from an anchor test, and with teacher assessment. Newton (2009) used NFER results to compare „live‟ test results for key stage 2 reading and writing with a pre-test in the same
topics for the subsequent year.
6
.
Types of variation considered under reliability
„It is not possible to step twice into the same river.‟ Heraclitus
Reliability is a measure of the stability of a result. In other words, one could say, „If I did it again, how similar would the result be?‟ The word „notional‟, or „notionally‟
could be included here to emphasise that in many situations it is not possible actually to repeat the process. Black and Champion (1976) define the term thus: „The reliability of a measuring instrument is defined as the ability of the instrument
to measure consistently the phenomenon it is designed to measure.‟
The ideal of a reliability measurement would be to carry out exactly the same measurement at exactly the same time with the same individuals. But it is not actually possible to repeat the process exactly. The construct is more in terms of some kind of parallel universe (Hawking, 1988). Given that, possibly aside from the world of quantum mechanics, one is unlikely to encounter parallel universes, some kind of loosening of the conditions is required. Three main approximations are described:
same (or parallel) test, same people; different time, different tests, same time, same people;
and same time, same stimulus, different people. Marker effects occupy a further category.
Test-retest reliability: the same (or parallel) testing instrument, same people, but at a different time.
In measuring the speed of light, the scientists endeavoured to get a more precise result by making the measurement a number of times, and averaging the result (Michaelson and Morley, 1887). This approach is not possible in the educational and behavioural sciences. If a respondent takes a test twice, then the second taking will be influenced by the first if the two tests are close, and if they are sufficiently far apart in time to avoid this, then there will have been maturation effects between the two times, probably improving performance. Test-retest correlations tend to decline as a function of the time between tests, the nature of what is being tested and what happens between tests.
Parallel (alternate forms) reliability
It would now be more usual to employ two parallel forms of a test, rather than try to re-administer the same test, with all the difficulties that this would entail. A set of strictly parallel forms are defined as tests that have identical test specifications, yield identical observed score definitions when administered to any (indefinitely large) population of examinees, and covary equally with each other and any other measure (Haertel, 2006).
Split half reliability and Cronbach’s alpha: different but parallel tests at the
same time, same people.
Split half reliability assumes that the test consists of two equivalent half-tests. These may be conceptualised by, for example, allocating alternate items to split half 1 and split half 2. The correlation between these, grossed up to take account of the smaller number of items in the half-tests, is taken as an indicator of the whole test reliability. The correlation to some extent depends on how the original test is divided into two parts. As described below Cronbach‟s alpha (Cronbach, 1951) is the mean of all possible such half-test divisions.
Cronbach‟s alpha and test retest reliability are estimating two different quantities,
since the former is essentially assessing the consistency between measures, and the latter the consistency over time. Results from the two approaches, perhaps
surprisingly, tend to be similar, encouraging confidence in both.
IRT models: same test, same time, different people.
To take the simplest example of an IRT model, the Rasch model assumes that all examinees with a given underlying score have the same probability, specific to that item, of passing any item in the test. This probability and its variability come from the distribution of responses in the population. The reliability of IRT models including the Rasch model is discussed below.
Marker effects
In some ways the situation where more than one marker marks a student essay, or more than one observer rates a performance do come close to the „ideal‟ situation
described above. The same performance is being rated in different ways. This only describes part of the instability of the assessment since it does not take account of possible instability in the performance of the examinee. Marker effects are not necessarily completely distinct from other unreliability influences, for example in a test-retest, where the two sets of answers are marked by different markers, or the same marker at a different time.
7.
Methods of calculating reliability:
replication-based and model-replication-based
As noted earlier, it is not possible to replicate exactly the same measurement at the same time with the same test on the same individual, so we can produce only an estimate of reliability. In the previous section we have classified reliability measures according to which of these „sames‟, people, time or instrument, is relaxed to
provide a working approximation. The second main dimension is whether the process used is direct (replication based) or imputation (model based).
Direct estimation of measurement error is, conceptually, rather straightforward. i. A quantity is measured
ii. The same quantity is measured again, in the same way iii. The two measurements are compared.
Imputed estimation of measurement error attempts to set up some statistical model, distinguishing between the systematic and random parts, and the measurement error variance is estimated from this. It is obviously quite dependent on the adequacy and nature of the model used.
Experience shows that as soon as one sets up an „ideal‟ dichotomy, it is found that
everything has to be classified as a mixture of the two extremes. Processes corresponding to this simple contrast are rare, and many will contain a mixture of the two. For example even the most simple of test-retest models assumes some kind of statistical model, albeit a very simple one.
Two examples of model-based reliability are the instrumental variables method and the standard error for the IRT model. The first of these is particularly used in econometrics (though see McDonald, 1985; Ecob and Goldstein, 1983) and
generally in the context of regression-type applications. A second example could be the standard error for the score for an IRT model. The result for this depends on this model being correct, or at least a sufficiently close representation of the original data. IRT standard errors, while conceptually analogous to reliability coefficients,
do not come in a single figure, but vary with the value of the score. If the 1-parameter model was a poorer fit to the data than a more general IRT model, then the estimated standard error would be too large at some points and too small at others, compared with the better-fitting general model.
8.
Measures of reliability and measurement error
Standardisation of measurement and reliability coefficients
It can be difficult to assign a measurement scale to a quantity. In some instances, such as weight or money, the obvious scale is essentially a question of counting. Two pounds (or Euros) are twice as much as one pound (or euro). In other instances constructs are measured according to their locus in the web of scientific constructs: thus the current linear scale of temperature is conceptually consistent with the expansion of metals with increasing temperature. It could alternatively have been defined in a scale that had a quadratic relation to the current scale, since the temperature of a gas is related to the square of the speed of the molecules it comprises. These options are not open to those making measurements in the educational and behavioural sciences, except in certain examples, such as public examinations in the UK, where the unit has a quasi-currency interpretation for such things as university entry or job applications. An alternative approach that has been attempted is to define the measurement qualities a scale should possess, such as additivity in some sense, and attempt to constrain the measurements to conform to this. The Rasch model aims to do this, though as noted above, its use is
controversial. In contrast, it is widely considered that any monotonic transformation of a result will be acceptable to the extent that it gives an interpretable conclusionvi. Even if we have established a scale, there is still the question of its interpretability. What does a measurement error variance of +/- 2 score points mean? In the absence of any other rule, interpretation can be aided when scores are expressed by
comparing the difference from the population mean to the population standard deviation. These are described as standardised scores or effect sizes (Schagen and Elliott, 2004), and help give a „feel‟ for the size of results.
Similarly, the estimated measurement error variance can be divided by the total population variance to give the ratio
where ρ is called the reliability coefficient. In words, this could be described as the proportion of the observed variation that corresponds to „true‟ variation as opposed
to measurement error. This formula contains two unknowns and thus is an attempt to estimate a ratio of two unknowns from observed scores.
Approaches differ between classical test theory (CTT) and item response theory (IRT), not least because the former deals with observed scores, and the latter deals with theoretical latent scores. The two are treated in turn.
Classical test theory.
Scores in CTT are typically produced by a simple, or weighted, summation of observed item scores, and the mathematical theory of this is based round entire test scores, though subtests, including item scores, are frequently employed in the estimation of reliability.
1. Split-half reliability.
The test is divided into two halves, and the correlation between the two is calculated and inflated to take account of the fact that the two half-tests are shorter than the original.
If the two halves are equivalent then this gives an estimate of the test reliability coefficient. The problem of course is that the halves are not necessarily equivalent, and that creating a different partition will give a different result: the half-correlation depends on the correlations between the items in the two half-tests, and making a different partition will mean that different inter-item correlations are included. Ways around this include making a random partition, or doing more than one such partition and taking the mean. In the limit, one could consider all possible such partitions and average these: while this would be statistically ideal, it would require a very large number of such partitions.
For this reason the split-half reliability has been largely superseded by Cronbach‟s alpha, which is in fact the mean of all possible splits.
2. Cronbach’s α.
This is probably the most commonly used of reliability measures for observed score tests these days. It is a function of the average covariance between items in the test.
It is thus apparently a measure of inter-item consistency. Why is this considered a measure of reliability? As discussed above, this is equivalent to the limiting condition of all possible split-half reliabilities. Thus it is effectively assessing the possibility of giving a parallel test, as discussed earlier.
Despite its near-ubiquitous application, the use of coefficient α to assess reliability has been widely and repeatedly criticised by psychometricians. One of the most recent of these critiques was that of Sijtsma, who stated that
„Alpha is a lower bound to the reliability, in many cases, even a gross
underestimate, and alpha cannot have a value that could be the reliability based on the usual assumptions about measurement error‟ (Sijtsma, 2009).
He goes on to state that
„Better alternatives exist, but are hardly known, let alone used to assess reliability‟. Unfortunately, while there is wide agreement among psychometricians that α is not
the answer, there is very little agreement about what is.
3. Greatest lower bound.
Sijtsma recommends the use of the greatest lower bound (glb). This statistic, as its name suggests, estimates the smallest reliability possible given the observable covariance matrix and assuming that the errors in each test item are uncorrelated. However his recommendation is criticised by Green and Yang (2009), Bentler (2009), and Revell and Zinbarg (2009).
4. Structural Equation Modelling.
Green and Yang (2009) recommend using Structural Equation Modelling of the test items and estimating scale reliability once a conceptually meaningful model has been established, and reporting a statistic they describe as ._SEM. Bentler (2009), too, recommends the use of a coefficient based on Structural Equation Modelling of the test items.
5. Coefficient .
McDonald (1985) and Revelle and Zinbarg (2009) recommend , the proportion of scale variance in a factor analysis associated with all factors or with the general factor respectively, though Green and Yang (2009) consider that because the general factor is likely to represent the construct that the scale is supposed to measure, blurs the distinctions between reliability and validity.
6. Kuder-Richardson (KR20).
This deals with dichotomous items and is essentially equivalent to Cronbach‟s
alpha, but the latter is more general as it also deals with non-dichotomous items. Again, this has been largely superseded by α.
7. KR21.
The formulae to calculate KR20 requires knowledge of the behaviour of individual items. A simpler formula is given by which uses whole-test information rather than item level. This was formerly much used as being simpler to calculate than other formulae, but with the advent of computers this justification is no longer valid and its use is not generally recommended. When only the total scores are available, for example historical data, or for confidentiality considerations, the KR21 formula is occasionally used.
8. Test-retest statistics.
The agency first administers a test to a group. Then, sometime later, they administer it again. The two sets of scores are correlated to give a test-retest
correlation estimate of reliability. The nub with test-retest reliability is determining how long to wait between the two administrations. If the interval is too short, then the subjects can remember the questions, and how they responded. In a classroom students are often being taught new skills in a topic and if the time interval is too long differences in test scores will be due to students having learned new skills. Typically these days a parallel test, rather than exactly the same one, is used.
9. Alternate assessments.
Because, as discussed in the previous section, it is not possible actually to re-administer the same test under the same conditions, the definition is couched in terms of parallel forms. In practice an alternate assessment, such as an anchor test or a teacher assessment, may be used as an approximation to a replicate. This is to some extent broadening the remit of reliability into areas normally viewed as validity.
10. Instrumental variables.
This typically is encountered in some kind of regression-type application, but, provided the relevant variables are available, it could well be used in more generally (See Hutchison, 2009). To begin with this method would require that we had two sets of test scores for pupils X and Y, both generally believed to contain
measurement error, and a third quantity, Z, (the instrumental variable) which is firstly correlated with the true quantity sought, but not with the measurement error within X. Finding such a variable is often a rather difficult task. If such conditions are not fulfilled, then the resulting estimate of the reliability coefficient can be quite biased.
It should be noted that this is equivalent to a somewhat different, and rather more general, definition of test reliability from the basic repeated test formulation. A systematic component of X, but one that was not related to Y, could be included in measurement error under this definition (McDonald, 1985, Hutchison, 2008). It is analogous to the uniqueness of a variable in a factor analysis.
11. Signal to noise ratio
A construct allied to reliability is the signal to noise ratio. It is generally used in communications and engineering and more generally in science to compare the amount of useful information to the ambient or non-relevant information. . Cronbach and Gleser (1964) and Brennan and Kane (1977) have advocated its use in educational measurement. The noise in a measurement procedure represents the degree of precision in the procedure, and corresponds to the measurement error. The noise power is defined as the expected value of squared noise. For a
referenced test the noise power is equal to the error variance in classical test theory and the signal-to-noise ratio is related inversely to the reliability coefficient.
Somewhat different definitions apply to criterion-referenced tests (see Brennan and Kane, 1977).
12. Standard error of measurement (SEM).
The reliability coefficient is reported as the ratio of two variances, and is by definition less than or equal to unity. If one wishes to increase the value of the reliability coefficient, then the obvious way of proceeding is to reduce the measurement error, which is usually done by increasing the length of the test by adding further items related to the existing ones. This can also be done by
increasing the size of the denominator, i.e. by increasing the amount of variation in the population tested. This would have the effect of making the test characteristics look better, but would not actually improve the performance of the test. It is alleged that in the earlier days of standardised assessment, test developers would increase the quoted reliability of a test by deliberately including a proportion of special education needs pupils in the test sample (Kamin, 1977): it goes without saying, of course, that reputable test development organisations would not engage in such practices.vii However it could arise inadvertently.
The standard error of measurement (SEM) instead simply refers to the level of error on the scale of the test itself. Broadly speaking it estimates the expected magnitude of the difference between pupils‟ true scores and their actual given scores. As it
does not contain the population variance denominator, it is not susceptible to being inflated or depressed according to the range of abilities within the sample taking the test.
Measures for IRT
1. (Fisher) Information Function
This was devised in connection with maximum likelihood estimation, and gives an indication of how „peaked‟ or discriminating the maximum likelihood function is at
that value of . See Stuart and Ord (2009) or Yen and Fitzpatrick (2006) for further information and precise formulae. Information is a function of , and varies with
.
the ability or attainment of the pupil. At first sight, it is not immediately obvious why this should be included in a review of reliability estimation. In fact, it is of considerable value in this context as it offers benefits for handling reliability information, being the inverse of the square of the standard error of estimation for the item. Item information functions may be added directly to give the test
information function.
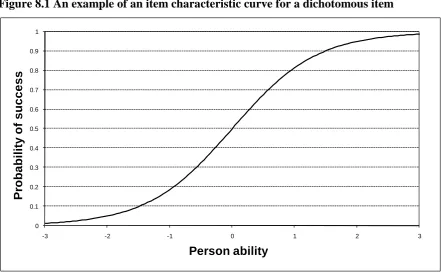
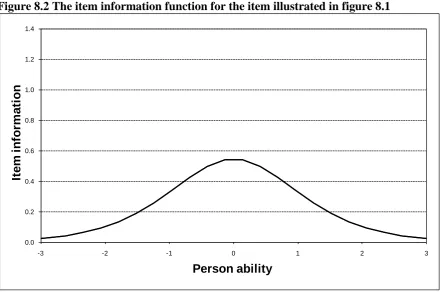
[image:28.595.108.550.469.741.2]An illustration of how this works is given by figures 8.1 and 8.2. Figure 8.1 shows how the expected score on a particular dichotomous item, difficulty 0.0, varies with pupil ability. For example a change in ability from 0 to 0.5 is related to an increase in the chances of getting the item correct from around 50% to around 70% - a relatively large increase. Figure 8.2 shoes the information function for this same item. Since the chances of getting the item correct increase dramatically between abilities of 0 and 0.5 this shows a relatively large amount of information being gained about pupils with abilities in this range. In contrast a change in ability from 2 to 2.5 is only related to a small increase in the chances of getting the item correct – from about 95% to about 98). As a result figure 8.2 shows a relatively small amount of information yielded about pupils with abilities in this range.
Figure 8.1 An example of an item characteristic curve for a dichotomous item
0 0.1 0.2 0.3 0.4 0.5 0.6 0.7 0.8 0.9 1
-3 -2 -1 0 1 2 3
[image:29.595.109.550.73.365.2]
Figure 8.2 The item information function for the item illustrated in figure 8.1
0.0 0.2 0.4 0.6 0.8 1.0 1.2 1.4
-3 -2 -1 0 1 2 3
It
e
m
i
n
fo
rm
a
ti
o
n
Person ability
2. Standard error of estimation.
The standard error of estimation for a test is comparable to the standard error of measurement in Classical Test Theory, but is more powerful, in that it changes with values of θ.
Unlike reliability coefficients, the Information Function and the Standard Error of Estimation both vary with the score, rather than attempting to provide a single measure for the entire range. The next two measures aim to provide a single statistic for the whole range.
3. Separation index.
This is a statistic developed in connection with the Rasch model (Linacre and
Wright, 2001; Andrich, 1988). In this, the standard error of measurement appears in the denominator. It gives an indication of how the actual inter-personal variation identified by the model compares in magnitude with the total variation. As such it is comparable with the signal to noise ratio discussed earlier (Andrich 1988). It can range from 0 to (plus) infinity.
4. Rasch reliability index (REL)
It is also possible to obtain an analogue of the reliability coefficient from a Rasch analysis. (Linacre and Wright, 2001).
Grading and Misclassifications
The statistics and approaches described so far assume some kind of continuous measurement. Even though, for the observed scores, a summed score is actually an ordered categorical measure, these are generally viewed as quasi-continuous, as they are considered sufficiently finely-grained to treat as continuous for analysis
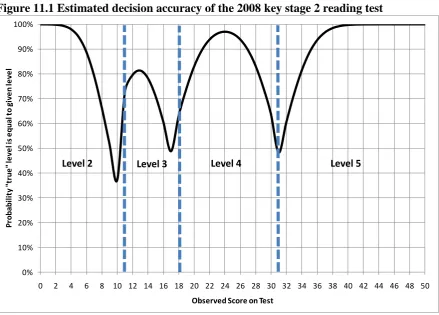
purposes. In much national curriculum work, results are reported in a relatively coarse-grained scale, with only a handful of possible values, though of course this arises from setting cut-points in a wider range of scores. For example, assessment results at key stage 2 are reported only as levels in categories 2-5. To emphasise the relatively small number of possible categories, we refer to this as grading. If an examinee is assigned to the wrong grade, then this is described as misclassification.
There are a range of approaches to estimating misclassification. National
Curriculum Assessment and, especially, public examination results are high stakes, and for this reason a test-retest reliability assessment is likely to prove infeasible. One alternative is to use mathematical models such as IRT analysis to generate estimates of the levels of misclassification. One example of how this can be done is provided by Hutchison and Schagen (1994). An IRT approach to calculating levels of misclassification is introduced in chapter 11.
Aside from statistical modelling, another approach is to compare two or more different ways of producing the grading, for example comparing the live assessment with an anchor test and with a teacher assessment (see later in this paper and
Newton, 2009). Using the results from different types of assessment is a wider type of variation in circumstances than is has been described so far in this paper.
In those instances where allocating scores to grades has taken place, there are a number of ways of quantifying reliability.
1. Coefficient alpha for the underlying scores.
Gradings for public examination and National Curriculum Assessment are typically produced by grouping scores on a much longer scale, using a defined set of cut-points. One simple and easily understood statistic for reliability would be the reliability coefficient for the underlying score. However as shown in the demonstration example later in this paper, this does not fully describe the
complexities of the process. In particular it does not describe the behaviour of the test near the cut points.
2. Reliability coefficient.
One could of course ignore the fact that such graded results are a long way from continuous, and estimate and report reliability coefficients as described above for continuous data, by correlating two administrations and this is occasionally done. Correlation is not the same as agreement. If every score in one measure was consistently higher by one grade than the other, correlation would be 1.0, but agreement would be nil. Similarly if one measure spread out the respondents more than another, there could still be a high correlation and very little agreement. It would be preferable to use a statistic which takes account of the measurement level (Stevens, 1946) of the data. It is also important to bear in mind that CTT-based approaches assume equal score measurement for all points, while the reliability of gradings varies with score, being potentially (substantially) larger around cut-points.
We now describe examples of coefficients to measure the reliability of grading.
3. Percent agreement.
When comparing two measures of overtly the same quantity, such as reading ability at age 11, the simplest and most obvious method is to describe the percentage of pupils who are awarded the same grade from both assessments. The drawback to this method is that, especially with a relatively small number of categories, there will be a substantial percentage of agreement simply by chance. There will also be difficulties if the vast majority of respondents are in one category.
4. Cohen’s kappa (Cohen, 1960).
In this, the degree of agreement is calculated after making allowance for the proportion of agreement between assessments to be expected by chance.
This does not allow for the extent of discrepancies between the two measures being compared. A discrepancy of one grade is not treated any differently from a
discrepancy of four or five.
5. Weighted kappa
This is a development of the basic kappa statistic with the larger differences weighted more highly than smaller ones.
While kappa, and weighted kappa, are generally considered preferable from a statistical point of view, percentage agreement is in many ways more intuitive, and easier to explain to non-statisticians, and its use still continues. Both kappa and weighted kappa require that the measures being compared have the same number of categories.
9.
The public’s perception of measurement error or “the
public’s” “perception of measurement error”?
Much has been made of possible difference in perception of measurement error between the public and measurement professionals. It has been suggested that the technical term „measurement error‟, with its specialised meaning as defined here, is
being misinterpreted in the media and by the public as implying some kind of mistake in the marking and scoring process which in turn implies culpability (see, e.g. Newton, 2005). Some recent research commissioned by Ofqual (Boyle, Opposs and Kinsella, 2009), indicates a more nuanced interpretation. Is there in fact „a public‟, and to the extent that there is, to what extent do they actually have views on
measurement error?
Boyle et al (2009) describe the results of investigations using a focus group approach which included teachers, students, parents, members of the general public, employers and examiners (Ipsos MORI, 2009). They report that there is no single way of looking at the inherent instability in examination results, and that, for example, the views of examination candidates differ from those of teachers, and both of these from those involved in the process of setting and administering exams. As far as conceptualisation of the measurement process is concerned, perhaps the most noteworthy insight was that those administering the focus group found that knowledge of the topic was extremely limited and they had to prime the group with background information to a substantial extent to enable them to develop opinions about the issues under discussion (Boyle et. al, 2009; Ipsos MORI, 2009). This is not particularly surprising: one would not expect that the general public would spend much time sitting around conceptualising measurement error.
Obviously the way of looking at the question would depend on the aspects that affected those involved. Measurement professionals would categorise measurement error into those on the one hand that are viewed as inevitable inconsistencies of human interpretation, and the decisions on borderline cases: and on the other hand those that are actually due to mistakes in the examination agencies. Those involved
as „consumers‟ appeared more likely to view the important dimensions as whether
the problems made a difference to the result, and whose fault any problems were.
This is not to say that non-professionals do not have any concept of a random element of instability in the examination process. The results from the focus group, anecdotal evidence and one‟s own experience suggest that those involved are well
aware, for example, that the material assessed in any given examination is only a subset of the possible topics and that this gives rise to an element of „luck‟ or randomness in the outcome. („I revised this, but it didn‟t “come up”.‟) Equally,
there is a perception that performance can vary over time for reasons other than knowledge („I had a bad day because of a headache/cold/hangover/personal circumstances‟). While there is this degree of understanding of apparently random
aspects to performance, there may be less acceptance of aspects where there may be an inherent variability, such as marking of essays. While it is accepted that there may be inconsistencies between markers, the reaction tends to be to recommend further marking to gain an agreed result (Boyle et. al, 2009).
One other aspect of differences between providers and consumers is observed especially in changes between occasions. Measurement specialists conceptualise this in terms of a „true value‟, with symmetrical variation about some function of the
measurement. Lay users, we believe, tend to think more in terms of a true value, but one which is frequently not attained because of negative outside influences.
All this discussion of where the responsibility lies for the reliability of a particular assessment distracts attention from a more important question. Is this good enough? And what do we want to do about it? Do we alter the framework to give a more secure measurement? Or do we decide that on balance things are better left as they are?
We consider one particular aspect, that of marking written scripts (“essays”). Some research (Hutchison, 2007) has suggested that on a five-point scale there is approximately a 40 per cent agreement between two highly trained markers. In isolation, this does not seem very good. What would we want to do about this? Note that these are highly trained markers, so the option of training them further is
unlikely to be worth exploring. A larger sample of written work would almost certainly give a more stable result, but how would this be implemented? Would it come from more essays in an examination setting, in which case the process, already criticised as too extensive, would become even longer? Or would it come from coursework, with its attendant questions of authenticity? Or from automated essay scoring, likely to be badly received by many education professionals and parents for validity reasons? Or might the reaction be that the scoring of a single essay was only one aspect, and that things were likely to even out over a wider span of assessments?
The main point to emphasise here is the importance of transparency in terms of reporting of public examination results. The aim of this would be to offer all involved the possibility of weighing up the benefits of a more reliable assessment system against the costs in terms of time that could be spent on teaching and learning, imposition on the young people concerned, and, in fact, cost, so that decisions could be taken on the best available evidence (see also Boyle et. al, 2009; Newton, 2005). To enable this, we consider that those bodies in charge of public exam boards should provide figures for the reliability of public examinations.
10. Nomenclature
There is an Anglophone tradition of using handy everyday words to express specific technical scientific or psychometric constructs, which can cause confusion among the unwary by carrying over some of the everyday attributes: thus for example the confusion of many pupils when introduced to the distinction between speed and velocity, or between force and pressure, or stress and strain. In the area being treated here, the two most commonly used expressions are reliability and
measurement error, both with everyday implications somewhat at variance with their technical meanings. The technical meanings are discussed more fully below, but essentially reliability in everyday usage implies trustworthiness, and that you are getting what you want, while in an education measurement context it simply means the extent to which one gets the same thing, whether it‟s what you want or not. On
the other hand in everyday usage, an error indicates a mistake and probably a degree of culpability (Newton, 2009; Hutchison, 2008), while the term measurement error in education testing refers specifically to a situation where the process has been carried out as well as intended. Thus, the implications to a lay audience of the term
reliability are perhaps too favourable to the result, while those of measurement
error are too negative. It may be that such usages are too deeply embedded in the consciousness of researchers worldwide to do anything about the terminology, but it may be useful here to discuss possible terms that can be used, and their implications.
The precise meanings of such terms are discussed below, but essentially they relate to the extent to which one would expect to get the same answer if an assessment were repeated as similarly as possible. Different aspects of the process are referred to by different types of terms. Thus we want to distinguish between the simple discrepancy of a single observation from the expected value, and some kind of overall measure of the magnitude of such differences. The raw difference for an individual is referred to as the error, while the reliability is measured as a function of the mean value of the squared discrepancies over the population. It will also be useful to distinguish between variation in a variable which is continuous (or treated as if it were), and a variable with a relatively small number of integer values.
Summary measures.
Reliability.
The term reliability is in pole position here because of the length of time it has been in use. However, as noted above, to the non-specialist ear it does carry with it an implicit greater degree of trustworthiness than it merits.
Stability
Stability would not carry with it the same connotations, simply a suggestion that the measurement had changed or not, without a pejorative aspect in this situation. On the other hand this appears to have different connections for experts in the area. One described it as „esoteric‟, and another suggested that it would apply only to
changes over time.
Consistency and Inconsistency.
These are used in connection with decision consistency, i.e. the extent to which the same decision would be made in two different attempts to grade a candidate. This usage seems to be a useful and generally accepted one. In the writers‟ view it is best
confined to a situation with a relatively small range of outcome results.
Precision and accuracy.
Precision relates to the exactness stated for a measurement, and refers to how closely actual or hypothetical replications are to each other. It is distinguished from
Accuracy which refers to how close they are to the true answer. Precision can also refer to the number of digits reported , i.e. a measurement of 5.1 has a greater degree of precision than one of 5.
Indeterminacy or indeterminateness indicates how precisely one is able to measure a situation or characteristic.
Possible alternatives.
In view of the disagreement about possible everyday words, it may be best to consider some alternatives from outside the normal range.
As an overall summary measure, there is much to be said for signal to noise ratio (SNR). It has an intuitive obviousness, and probably avoids the degree of value judgment associated with terms like reliability. On the other hand it has the drawback that it comes out in a different metric from the traditional widely used coefficients such as alpha. Better, perhaps would be proportion relevant variance (PRV) as a summary for the type of result currently occupied by a reliability
coefficient, and proportion systematic variance (PSV) for approaches which used
a structural equation modelling approach with more than one dimension. Any of
these recommendations except SNR would have to be accompanied by a statement
of the actual statistic used.
To replace standard error of measurement, an expression indicating the diffuse
nature of our knowledge of an individual‟s score is required. We suggest smear,
with a degree of hesitation. Alternatively, for its corollary, the term measurement
sharpness could be used.
Finally for grading, the expression decision consistency already used by Newton
(2009) seems to fit well.
11. Case study of reliability indices for a key stage 2
reading pre-test
This section is intended to give a flavour of how differences between alternative reliability indices work out in a practical situation, and to demonstrate how the different assumptions made by different methods can affect the results. Discussion is based on calculations of a number of the most common forms of reliability indices. Not all of the methods introduced earlier within the report are included in this case study. In particular, certain methods (such as instrumental variables) require extra data that is not available and others (such as those based on the Rasch model) are not appropriate as the model involved clearly does not fit the data in question.
Analysis is based on data collected in 2007 during pretesting of the 2008 key stage 2 reading test. This test was made up of 34 items allowing a total of 50 marks to be achieved. Full details on the process of pretesting are contained in reports submitted to the QCA (Twist et al 2007). For the sample of pupils involved in analysis, this test had a mean of 28.5 and a standard deviation of 9.1.
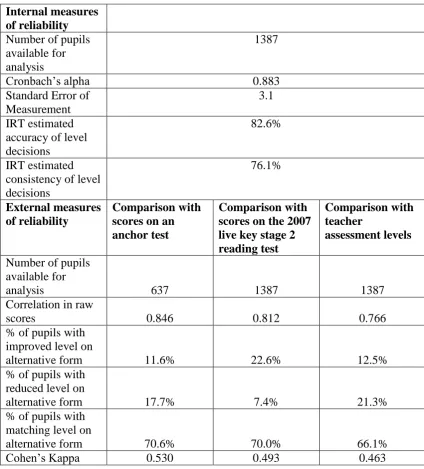
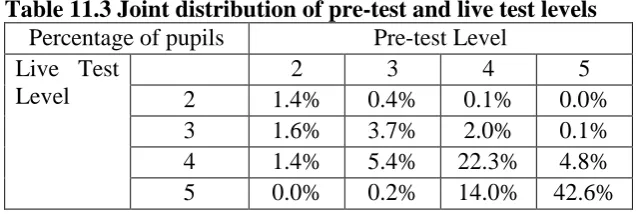
Table 11.1 shows a number of different reliability indices for the test in question. It should be noted that all of these figures were calculated using a sample of pupils from 60 schools who were broadly representative of all pupils who took the live key stage 2 reading test in summer 2007 in terms of final test levels.
Included within these indices are comparisons with teacher assessment (TA) levels. These are collected as part of the test development trials. Teachers of classes involved in the pre-test are asked to supply TA levels for all pupils for each of the three attainment targets of English (reading, writing and speaking & listening). This data is collected at or just after the pre-test. This means that for the vast majority of pupils, TAs have been provided before their national test results are returned to schools and also before teachers have to finalise their teacher assessment level for submission. For this reason the teacher assessment levels used in this analysis may
not match the final teacher assessment levels given to pupils at the end of key stage 2.
Table 11.1 Various reliability indices for the 2008 key stage 2 reading pre-test
Internal measures of reliability
Number of pupils available for analysis
1387
Cronbach‟s alpha 0.883 Standard Error of
Measurement
3.1
IRT estimated accuracy of level decisions
82.6%
IRT estimated consistency of level decisions
76.1%
External measures of reliability
Comparison with scores on an anchor test
Comparison with scores on the 2007 live key stage 2 reading test
Comparison with teacher
assessment levels
Number of pupils available for
analysis 637 1387 1387 Correlation in raw
scores 0.846 0.812 0.766 % of pupils with
improved level on
alternative form 11.6% 22.6% 12.5% % of pupils with
reduced level on
alternative form 17.7% 7.4% 21.3% % of pupils with
matching level on
alternative form 70.6% 70.0% 66.1% Cohen‟s Kappa 0.530 0.493 0.463
Each of the different reliability indices is considered in turn below. Detailed descriptions are included for IRT estimates of accuracy and consistency as these have not been fully introduced in earlier sections.
Cronbach’s Alpha
Cronbach‟s alpha for this test is calculated to be 0.883. This implies that over 88% of the variation in pupils‟ scores is due to variation in their true score and just 12%
is due to error variation. Equivalently it estimates that the correlation between this test and another exactly parallel test would be 0.883. This is generally considered a reasonably high reliability for a test of this length.
The most important assumption made in this calculation is that the test is measuring precisely the skills that it is intended to measure. It is possible for test to have a high Cronbach‟s alpha but in fact to be measuring the wrong construct very well.
Another important assumption in this reliability estimate (as well as subsequent estimates) is that the functioning of the test does not dramatically alter between pre-test and live pre-test conditions. Better estimates of internal reliability could be
generated if item level data from live test administrations was available. In other words it is not necessarily true that the high reliability under pre-test conditions translates into a high reliability when this test is delivered under live conditions.
The only source of random error explicitly captured in this estimate is test related error, that is, the variation in scores due to a particular selection of items being chosen to be in a test rather than another. Occasion related error is definitely not accounted for in this estimate as all items were taken at (almost) exactly the same time.
Marker related error is not explicitly taken account of in this estimate as in this case every item taken by a pupil is marked by the same marker. If marking had been arranged differently so that different items were marked by different markers for different pupils then it would be possible for Cronbach‟s alpha to take account of
variation between markers. However, it should be noted that, much of the variation between markers is non-systematic – that is, it largely does not manifest itself in markers consistently marking higher or lower than others (Benton 2006). Therefore it is reasonable to assume there is in fact some internal marker error. In other words across different items the same marker will sometimes mark higher than average
and in other cases will mark lower than average. For this reason a certain proportion of marker variation will be taken into account in any estimate of Cronbach‟s alpha.
Standard Error of Measurement
Using the formula supplied in the appendix we can combine Cronbach‟s alpha with the known standard deviation in scores for the test to calculate the standard error of measurement. This is estimated to be 3.1. Very roughly this means that the average absolute difference between pupils‟ true scores and their actual given scores is 3 marks.
Correlation with alternative forms of assessment
The alternative reliability measure that is most easily compared to Cronbach‟s alpha
is the correlation of the test with other forms of assessment. For the data set in question three alternative measures of reading ability were available:
Scores for a subgroup of pupils on a 50 mark anchor test taken directly after completion of the test we are interested in. The purpose of administering this test was for use in standard setting but it does provide an alternative measure of reliability for our purposes. The anchor test is parallel in form to the live test.
Scores on the live key stage 2 assessment in reading taken a few