“
EFFECTIVENESS OF CO-OP TO IMPROVE SHOPPING
SKILLS IN CHILDREN WITH LEARNING DISABILITY”
Dissertation submitted for
MASTER OF OCCUPATIONAL THERAPY
2015-2017
KMCH COLLEGE OF OCCCUPATIONAL THERAPY
THE TAMIL NADU DR. M.G.R MEDICAL UNIVERSITY
CHENNAI
TABLE OF CONTENTS
S.NO CONTENT PAGE NO
ABSTRACT
1
1 INTRODUCTION
2 OPERATIONAL DEFINITION 4
3 AIM AND OBJECTIVES 5
4 HYPOTHESES 6
5 RELATED LITERATURE 7
6 REVIEW OF LITERATURE 15
7 CONCEPTUAL FRAMEWORK 19
8 METHODOLOGY 22
9 DATA ANALYSIS AND RESULTS 31
10 DISCUSSION 52
11 CONCLUSION 58
12 LIMITATIONS AND RECOMMADATIONS 59
13 REFERENCES 60
TABLES AND GRAPHS
SL.NO TABLES TITLES
PAGE
NO
1 Descriptive statistics of the gender and age of the children32
2 Mean and standard deviation of Test of grocery shopping skills andTOGSS Components
33
3 Mean and standard deviation of Canadian occupational performance measure (performance and satisfaction component) and PQRS total
34
4 Mean and standard deviation of Performance Quality Rating Scale (PQRS) of performance component
35
5a Comparison of pre test and post test scores of Test of Grocery Shopping Skills (TOGSS)
36
5b Comparison of pretest and posttest of Test of Grocery Shopping Skills (TOGSS) accuracy and efficiency of item, size and price component and time taken to complete TOGSS.
37
5c Comparison of pretest and post test scores of COPM and PQRS total
39
5d Comparison of pretest and posttest of PQRS of performancecomponent
41
6 Comparison of effect size on TOGSS, COPM and PQRS scale between experimental and control groups
43
7a Comparison between experimental and control groups scores of TOGSS total
44
7b Comparison between experimental and control group of scores of TOGSS accuracy and efficiency of item, size and price component
46
7c Comparison between experimental and control group scores of COPM- performance and satisfaction components and PQRS TOTAL.
47
7d Comparison between experimental and control groups of scores of
SL.NO GRAPH TITLES
PAGE NO
1
Descriptive statistics of the gender of the children32
2
Descriptive statistics of the age of the children32
3
Comparison of pretest and post test of both groups to measure the TOGSS36
4
Comparison of pretest and post test of TOGSS accuracy and efficiency of item, size, and price component38
5
Mean score of pretest and posttest of time taken to complete TOGSS38
6
Comparison of Pretest and posttest of both groups to measure theperformance and the satisfaction level according to COPM
40
7
Comparison of pretest and posttest of PQRS performance component.42
8
Mean score of pretest and post test of both groups to measure theTOGSS
45
9
Comparison between pretest and posttest of both groups to measure the performance and the satisfaction level according to COPM and PQRS total48
10
Comparison of individual scores on PQRS50
ACKNOWLEDGEMENT
. Firstly, I would like to thank the GOD almighty and my dad LATE Mr.R.Karuna Karan
For His grace and blessing without his blessing I could not have begun or completed my study. I sincerely thank my mom Mrs. Umadevi .R, an iron lady and my ever loving brother, Mr. K. Naveenkumar , for their kindness, motivation and affection and for being pillars of strength when I needed it the most
I express my heart-felt gratitude to my project guide, Mrs. Sugi S. M. O. T (Adv. Paeds),
professor, KMCH College of Occupational Therapy, for her commitment, love, support and outstanding patience at each and every step of my project. I thank her again for teaching me most sincerely and benevolently. Without her help and guidance, I would not have been able to complete my project successfully.
I also immensely thank Mrs. Sujata Missal, M.SC (O.T), PGDR (OT), Principal, KMCH College of Occupational Therapy, for granting me permission to carry out this study.
I extend my sincere gratitude to our vice principal, Mr. S.G. Praveen, MOT (PSYCH)
for being very kind, supportive and extremely informative at the time of hardships throughout the project.
I also thank, , Mrs. Lynda Mary George, B.O.T., Professor, Ms.Kanipriya, M.O.T., Asst. Professor, Mr. Shiva Subramanium M.O.T., Asst. Professor, all the staff members of KMCH College Of Occupational Therapy for their guidance throughout my study.
My heartfelt thanks Principal of Rashmika Centre, Mrs. Elizabeth Suresh and COGNITO Academy Centre, Dr.Lakshmanan Clinical Psychologist, and all the staffs for their helping hands and cooperation throughout my study
Also I thank Pazamudhir Nilayam manager for allowing me to proceed study in their store and all the staffs working in stores were very cooperative
CERTIFICATE
This is to certify that the research work entitled “EFFECTIVENESS OF CO-OP TO IMPROVE SHOPPING SKILLS IN CHILDREN WITH LEARNING DISABILITY”
carried out by Reg. No.411513003, towards partial fulfillment of the requirements of Master of Occupational Therapy (Advanced OT in Pediatrics), at KMCH College of Occupational Therapy (2015-2017), under the Tamil Nadu Dr. M.G.R. Medical University, Chennai.
Project guide Principal
Mrs. Sugi.S. M.O.T. (Paeds), Mrs.Sujata Missal, M.Sc. (OT),
Professor, PGDR (OT),
KMCH College of Occupational Therapy KMCH College of Occupational Therapy
Clinical Guide
Dr. Rajendran K.M.B.B.S., M.D. (Paed),
Head of the Department – Department of Pediatrics Consultant Pediatrician and Neonatologist
Kovai Medical Center and Hospital, Coimbatore
Date of Submission
ABSTRACT
AIM
To find out effectiveness of CO-OP to improve shopping skills in children with learning
disabilityMETHODOLOGY
The study was conducted in Rashmika centre and Cognito Academy in Coimbatore for 36 sessions within 12 weeks. Totally 30 children diagnosed with learning disability based on inclusion and exclusion criteria were included in this study and children were divided into two groups 15 in experimental group and 15 in control group. Assessment tools like TOGSS, COPM and PQRS were used as outcome measures. Experimental group underwent regular occupational therapy and COOP intervention and control group underwent regular occupational therapy and money handling skills training for 36 sessions. Scores obtained were subjected to statistical analysis.
RESULTS
Statistical analysis using independent t-test to compare pre and post test scores between experimental and control group showed significant improvement in shopping skills. Statistical analysis of pretest and posttest scores of TOGSS where p is 0.001(<0.05), TOGSS accuracy and efficiency of item, size, price, and time component where p is 0.001 (<0.05), COPM and PQRS [where p is 0.001(<0.05)], of PQRS of performance component in reading list, item, size, and price and money handling component where p is 0.001and 0.000 (<0.05). Effect size of TOGSS, COPM and PQRS was increased in experimental group.
CONCLUSION
COOP approach showed significant improvement in shopping skills for learning disability children, learning disability children were satisfied with their performance. Thus COOP approach is effective in improving shopping skills for learning disability children.
CANADIAN
OCCUPATIONAL
PERFORMANCE
MEASURE
Authors:
Mary Law,Sue Baptiste, Anne Carswell, Mary Ann McColl,Helene Polatajko, Nancy Pollock
The Canadian Occupational Performance Measure (COPM) is an individualized measure designed for use by occupational therapists to detect self-perceivedchange in occupational performance problemsovertime.
Therapist:
Facility/Agency:
Program:
published by CAOT Publications ACE
Printed in Canada
@ M. Law, S. Baptiste, A. Carswell, M.A. McColl, H. Polatajko, N. Pollock, 2000
Client Name:
Age: Gender: 10#:
Respondent (if not client):
Date of Assessment: Planned Date of Date of Reassessment:
STEP 1:
IDENTIFICATION OF OCCUPATIONALPERFORMANCE ISSUES
To identify occupational performance problems, concerns and issues, interview the client, asking about daily activities in self-care, productivity and leisure. Ask clients to identify daily activities which they want to do, need to do or are expected to do by encouraging them to think about a typical day. Then ask the client to identify which of these activities are difficult for them to do now to their satisfaction. Record these activity problems in Steps 1A, 18, or 1C.
STEP 2: RATING IMPORTANCE
Using the scoring card provided, ask the client to rate, on a scale of 1 to 10, the importance of each activity. Place the ratings in the corresponding boxes in Steps 1A, 18, or 1C.
STEP 1A: Self-care IMPORTANCE
Personal Care
(e.g., dressing, bathing, feeding, hygiene)
Functional Mobility (e.g., transfers, indoor, outdoor)
Community Management (e.g., transportation, shopping, finances)
STEP 1B: Productivity
Paid/Unpaid Work
(e.g., finding/keeping a job, volunteering)
Household Management (e.g., cleaning,
laundry, cooking)
STEP1C: leisure IMPORTANCE Quiet Recreation (e.g., hobbies, crafts, reading) Active Recreation (e.g., sports, outings, travel) Socialization (e.g., visiting, phone calls, parties, correspondence)
STEPS 3 & 4: SCORING
-
INITIAL ASSESSMENT and REASSESSMENTConfirm with the client the 5 most important problems and record them below. Using the scoring cards, ask the client to rate each problem on performance and satisfaction, then calculate the total scores. Total scores are calculated by adding together the performance or satisfaction scores for all problems and dividing by the number of problems. At reassessment, the client scores each problem again for performance and satisfaction. Calculate the new scores and the change score.
Initial Assessment: Reassessment:
OCCUPATIONAL PERFORMANCE PROBLEMS:
PERFORMANCE 1 SATISFACTION 1 PERFORMANCE 2 SATISFACTION 2
1. 2. 3. 4. 5. SCORING: PERFORMANCE SCORE 1 SATISFACTION SCORE 1
PERFORMANCE ~ SATISFACTION SCORE 2
Total score
Total performance or satisfaction
scores
/
/
/
/
=
# of problems - rI ,I
- I I
L J
r ,
- I I
- I I
L J c , , , , , = : : L j r l
= L j
c ,
CHANGE IN PERFORMANCE = Performance Score 2
l
j
r ,
Performance
Score
1:
:
=L J
D
D
CHANGE IN SATISFACTION = Satisfaction Score 2
c , , , , , , , , , , , , ,
" n ~
r '
ADDITIONAL NOTES AND BACKGROUND INFORMATION
Initial Assessment:
1
INTRODUCTION
Occupation has been defined as “daily activities that reflect cultural values, provides structure to living and meaning to individuals; these activities meet human needs for self-care, enjoyment, and participation in society” 1
Occupational therapy practioners consider the many types of occupations in which clients might engage. The broad range of activities or occupations are sorted into categories called “areas of occupation”, they are activities of daily living(ADL), instrumental activities of daily living (IADL), rest and sleep, education, work , play, leisure and social participation.
In occupational therapy practice framework (OTPF), AOTA defines IADLs as “activities that are oriented toward interacting with environment and that are often complex in nature.” IADL include 11 activity categories as care of others, care of pets, child rearing, communication device use, community mobility, financial management, health and maintenance, home establishment and management, meal preparation and clean up, safety procedures and emergency responses, shopping.2
Children with learning disability may have difficulty in some or all of the activities of reading, writing, and arithmetic. This can present them with numerous obstacles in the area of IADL (instrumental activities of daily living). For example, clients with reading deficits may have difficulty with community mobility (using public transportation) because they are unable to read bus schedules. If clients have difficulty with writing or arithmetic, they may have difficulty with financial management (not able to write what they need to shop or to shop independently).3 Grocery shopping is a weekly routine for many; is actually composed of multiple activities (Mechling & Gast, 2003). Mechling and Gast (2003)4 outlined these activities as
(a) Identifying items to purchase, (b) Moving around a store,
(c) Selecting the appropriate item, (d) Addressing prices, and
2
A research article published in Indian Journal of Occupational therapy in the year 2012 reports that children with learning disability were more dependent in shopping skills than typical children Diane Cotterill,5 (2015) found that shopping experience promotes independence, choice, and engagement in a valued occupation to meet leisure and self care needs and opportunities for social and recreational experience.
Shopping experience will promote cognitive and social development and understanding sequences of events involved in shopping is clearly one of the most important aspects of transaction knowledge.6
The Cognitive Orientation to Daily Occupational Performance (CO-OP) approach was used within this study as “a client-centered, performance-based, problem solving, intervention that enables skill acquisition through a process of strategy use and guided discovery.”7
Children with Learning disability have normal intelligence but they will have difficulties in learning and using academic skills.
COOP is a performance-based approach that emphasizes the importance of enabling the adolescent to identify, develop and utilize cognitive strategies to manage their chosen occupational life skill goals more effectively 8
CO-OP developed as an intervention approach as a result of research being performed with children with Developmental Coordination Disorder (DCD), Cognitive Orientation to daily Occupational Performance (COOP) is an individualized, client-centered approach focused on strategy-based skill acquisition7
3
RESEARCH QUESTION
4
OPERATIONAL DEFINITION
SHOPPING
Preparing shopping lists (grocery and other); selecting, purchasing, and transporting items; selecting method of payment; and completing money transactions.
OCCUPATION
Occupation is everything people do to occupy themselves, including looking after themselves…enjoying life…and contributing to the social and economic fabric of their communities” 1
COGNITION
Mentalaction or process of acquiring knowledge through thought, experience, and the senses
SKILL ACQUISITION
The process of learning to perform task or set of tasks
CLIENT CENTERED THERAPY
The client will take an active role in his or her therapy with the therapist being nondirective and supportive.
PROBLEM SOLVING
5
AIM AND OBJECTIVES
AIM
To find out effectiveness of co-op to improve shopping skills in children with learning
disabilityObjectives
To improve shopping skills in children with learning disability by using CO-OP approach.
6
HYPOTHESES
HYPOTHESIS
CO-OP will be effective to improve shopping skills in children with learning disability.
NULL HYPOTHESIS
7
RELATED LITERATURE
DEFINITION OF LEARNING DISABILITY
The APA criterion says a specific learning disorder diagnosis “requires persistent difficulties in reading, writing, arithmetic or mathematical reasoning skills during formal years of schooling. Current academic skills must be well below the average range of scores in culturally and linguistically appropriate tests of reading, writing, or mathematics. The individual’s difficulties must not be better explained by developmental, neurological, and sensory (vision or hearing), or motor disorders and must significantly interfere with academic achievement, occupational performance, or activities of daily living.”
SHOPPING KNOWLEDGE AND SKILLS
We use the term “shopping skills” to refer to wide array of abilities used for comparing product value prior to purchase.
Children are frequent visitors to retail stores at a young age. Convenience stores, discount stores, and supermarkets are the favorites of younger children (5–9 years), while specialty stores, such as toy or sporting good stores, are favorites with older children (10–12 years; McNeal and McDaniel 1981). By the time a child reaches middle childhood, s/he is visiting and making purchases in an average of 5.2 stores per week, or over 270 shopping visits per year (McNeal 1992).
Research reported between preschool or first or second grade children learns and understand fast where money comes from and its role in transaction in market place also learns to identify coins and bill value.
These shopping experiences, coupled with developments in cognitive and social reasoning.
DEVELOPMENT OF SHOPPING SKILLS
McNeal (1964) reports interesting developments between the ages of 5 and 9 years of age. At age 5, children see stores as a source for snacks and sweets, but are unsure of why stores exist except to fulfill their own needs for these products.
8
At age 9, shopping is seen as a “necessary part of life,” accompanied by a much greater understanding that retail stores are owned by people to sell goods at a profit.
The perceptual stage, where children have an egocentric perspective
To the analytical stage, where children have the ability to reason from another person’s perspective, such as retailers who have a profit motive detailed knowledge about retail stores also expands during this age period.
In a study, McNeal (1992) asked children in second, third, and fourth grade to draw pictures of “what comes to mind when you think about going shopping.” Findings from a content analysis of the pictures supports the fact that older children understand the process and purpose of shopping and include a variety of retailers (supermarkets, specialty stores, discount and department stores) in their depictions. Children’s drawings reveal that their shopping experiences have resulted in a good deal of knowledge about aspects of store layouts, product offerings, brands, and the like. As McNeal concludes : “By the time children are in the third and fourth grades, they can provide detailed descriptions of a Kmart or Kroger store, including store layouts, product and brand offerings of items for children and their households, and names and characteristics of some people who work in stores.”
9 INTERVENTION FOR SHOPPING SKILLS COMMUNITY BASED INSTRUCTION
Community-Based Instruction (CBI)=Regular and systematic instruction in meaningful, functional, age appropriate skills in integrated community settings, using naturally occurring materials and situations, designed to help the student to acquire and generalize life-skills that enhance his/her opportunities for meaningful experiences and relationships within the general community. Instruction is driven by individual strengths and needs, using consistent teaching strategies, as well as accommodations designed to enhance the student’s participation in typical activities. Home settings or area surroundings such as shopping centers, convenience stores and/or grocery stores, as well as community resources such as public libraries and post offices; take on importance as potential instructional settings. Also, students may learn important skills such as travel training, pedestrian skills, money use and management, leisure skills, and restaurant use. For older students, the community also includes vocational settings.
CBI is designed to increase independent living and social interactions for students with cognitive disabilities, careful planning must take place prior to beginning instruction. Educational staffs are charged with determining the student’s needs and matching these needs with the proper instructional setting. Educators must take into account what family members view as important skills for both current and future environments.
COGNITIVE ORIENTATION OF DAILY OCCUPATIONAL PERFORMANCE(CO-OP) The co-op objectives
The co-op protocol was designed to meet four specific objectives.
Skill Acquisition
10 Cognitive strategy use
It is instrumental to skill acquisition in the co-op approach. Thus the second objective of co-op is to teach children to use strategies to solve their performance problems. Children are actively taught a problem- solving strategy and are enabled to discover additional strategies that will support their skill acquisition and performance competence.
Generalization of learning
Beyond the therapy situation is of key concern in a learning- based approach such as co-op. thus the third objective of the coop approach is to have the children use their newly learned skills and strategies outside of therapy, without the help of the therapist in real world settings.
Transfer of learning
Skills to similar skills are the fourth and final objective of co-op. it is important that children learn to adapt their skills and strategies to the demands of new skills that they encounter in everyday life.
The seven key features of co-op
Each of the seven key features is essential to co-op’s effectiveness. Together the key features define CO-OP as,
A client-centered, performance – based, problem solving approach that use strategies, identified through a process of guided discovery, to enable skill acquisition
Cognitive Orientation to Daily Occupational Performance (CO-OP)
11 Client- chosen goals
CO-OP is a performance – based approach with the primary objective being skill acquisition. The child learns to perform three specific skills during CO-OP intervention. These skills referred to as GOALS, are the focal point of the intervention and are the vehicle for addressing the other three objectives of CO-OP.
The goals are set in collaboration with the child and great care is taken to ensure that Goals are the ones that the child wants to, needs to or is expected to acquire. In the CO-OP approach the child’s perspective is of central importance, beginning with the process of setting child- chosen goal, and continuing through the intervention.
Dynamic performance analysis (DPA)
Dynamic performance analysis is used in CO-OP intervention to support skill acquisition and the identification of the appropriate strategies for successful performance. It is initiated during baseline, when the child first performs his goal skill for the therapist, and continues throughout the treatment. The objective is twofold: to identify performance problems or breakdown, and to identify and test potential strategies to solve the performance problems.
Cognitive strategy use
In CO-OP, children are taught to think their way through a performance problem; to identify a strategy to solve that problem, and then to implement it. The CO-OP approach is highly verbal. The use of talk and self talk is so important to CO-OP that it was originally called verbal- self guidance. (Wilcox and Polatajko, 1993, 1994)
Throughout Through modeling, the therapist teaches the child to talk through the solution of a performance problem and to talk himself through the actual performance i.e., verbal self guidance. The CO-OP approach uses strategies to facilitate this process of ‘talking through’. The strategies help the child engage in problem solving a performance issue and monitoring the outcome. In other words the strategies promote Meta cognition.
12
The COOP global strategy and its Meta cognitive – functions
Global strategy
Promoting
Self talk Meta cognitive functions
Goal What do I want to do? Self-interrogation
Plan How am I going to do it? Self –monitor
Do Do it ( carry out the plan) Self observation
Check How well did my plan work?
Self-evaluation Self –reinforcement
Global strategy: goal- plan- do- check
A global cognitive strategy, also referred to as an executive strategy, is a higher order strategy that is used to control and co-ordinate other strategies (Pressely et al., 1987). The global strategy used in CO-OP is the Goal- plan- do- check strategy developed by a camp of colleagues (1976) and used by Meichenbaum (1977-1991). It is a problem solving strategy that helps to structure the conversation about skill performance.
13 Domain specific strategies
Domain specific strategies (DSS) are strategies that are specific to a particular task or part of a task. While the global strategy provides a general frame work that is used throughout the intervention ( and after) and is applied to the acquisition of all skills by all children , the domain specific strategies are often used only for a short time and are task, child, and situation specific. Further, while the global strategy is specified a prior, domain specific strategies are not. They are introduced to solve specific performance issues as they arise. They are tailor made for each child, in each situation. The domain specific strategies one child uses to learn a specific skill may be different from those used by another child to learn the same skill. Similarly, the same child may use several different DSS’s while learning a skill.
Guided discovery
Guided discovery is a process created for use in CO-OP to make certain that children discover the strategies that will solve their performance problems, themselves. While it is possible to use strategies without using guided discovery.
Guided discovery is an important learning concept. As well, it draws on Meichenbaum (1977,1991) scaffolding techniques, and the meditational techniques of Feuerstein and colleagues ( Feuersyein, rand, Hoffman & miller, 1980; haywood,1987,1988). Guided discovery, where the adult leads the child to discover answers to problems, has been shown to be more effective than discovery learning, where the child is left to discover the answer on his own (Collins & stevens, 1982)
Enabling principles
14
treatment, because treatment implies that things are done to or for someone rather than with someone.
The enabling principles are an integral part of the approach, and are used throughout the intervention. They are captured in four imperatives:
Make it fun!
Promote learning!
Work towards independence!
Promote generalization and transfer!
Parent or significant other involvement
Both parents and health care professional have identified parent involvement as one of the most important aspects of care, and have highlighted parent involvement as a priority in the development of health services (rosenbaum, king, & Cadman, 1992). In CO-OP, parents or significant others are called on to be active supporters of the intervention process. This is the sixth key feature of CO-OP.
The primary role of parents or significant others is to support the child in the acquisition of new skills and to facilitate the generalization and transfer of these. Throughout the intervention, the therapist shares information with the parents or significant others, so that they can celebrate the child’s successes with him and support his use of newly learned skills and strategies in environments beyond the intervention sessions.
15
REVIEW OF LITERATURE
Richa sachdeva (M.O.T) in 2012 did a study to compare the money handling skills of children with learning disability and children with typical development.In this study, author has taken 139 children with typical development and 31 with learning disability aged 10-14 years
studying in integrated schools. The children were divided into two groups based on their standards an age Group 1- 5th and 6th std (10-11 years), Group 2- 7th, 8th and 9th std (13-14
years). A student questionnaire on financial community living skills was developed and administered on the children; author found that children with typical development are more independent than the children with learning disability of the same age and none of children with typical development reported to have difficulty in making preference.
Diane Cotterill(2015) and colleagues, did a study to explore the challenge of managing finances for people with learning difficulties and to understand the supermarket shopping experiences of people with learning disabilities. They have taken two focus groups consisting of people with learning disabilities and a survey of staff working with people with learning disabilities. Findings from the focus groups and surveys identified a number of themes and sub-themes. Theme 1- They found shopping experience promotes independence, choice, engagement in a valued occupation to meet leisure and self care needs and opportunities for social and recreational experience. Theme 2- the environmental barriers to supermarket shopping experiences Theme 3: Personal barriers.
16
Kevin M. Ayres, John Langone, Richard T. Boon, and Audrey Norman the University of Georgia, 2006, did a study to investigate use of computers and video technologies to teach students to correctly make purchases in a community grocery store using the dollar plus purchasing strategy. Four middle school students diagnosed with intellectual disabilities participated in this study. A multiple probe across participant’s research design was used to
evaluate the effectiveness of the treatment. Author found that the program was effective at teaching the dollar plus purchasing strategy to three out of four participants and promoted generalization to the natural environment.
Rajul etan daftary MSc (O.T) and Shailaja Jaywant Msc (OT) 2015conducted a study to explore the efficacy of a cognitive orientation to daily occupational performance approach in improving handwriting skill in school going children. In this study they have taken 8 children between age 7-9 years with IQ>90, referred to outpatient department of occupational therapy for handwriting performance problems were enrolled in this study. ETCH tests was used as outcome measures. Each child was seen individually for 10 sessions each consisting of one hour over the period of 2.5 months. During the intervention session, coop approach i.e., plan, do, check. Method was used to improve handwriting skills in these children. Result showed all the 8 children had significant improvement on all the 5 components of ETCH test.
17
Parent and child performance and satisfaction ratings on the COPM improved from baseline to week 10 and all goals were achieved at or above the expected outcome. No significant changes were reported for the control group in impairment and activity (participation was not measured for this group.
Shanon phelan Laura steinke Angela Mandich 2009 did a study to investigate a new treatment approach (coop) to treating children with PDD. COOP emphasizes problem solving strategies and guided discovery of child and task specification strategies. Three goals were established in collaboration with parents and the child. Pre and post measures of parents perceptions of child performance were identified using COPM. Repeated measures were taken using clinical observations, video analysis, and the performance quality rating scale (PQRS) .In this study they found that improved COPM ratings of performance and satisfaction were observed and these results were paralleled by improved PQRSscores.
Deirdre R. Dawson Arvinder Gaya Anne Hunt Brian Levine Carolyn Lemsky Helene J.Polatajko 2009, did a single-case design study used with 3 adults, 5 to 20 years post-TBI and their self-identified significant others. Assessments included neuropsychological tests and the Canadian Occupational Performance Measure. The intervention entailed guiding participants to use a meta-cognitive problem-solving strategy to perform self-identified daily tasks that they needed and wanted to do and with which they were having difficulties. The intervention occurred over 20 one-hour sessions in participants’ environments and the result
found that the CO-OP approach has the potential to improve performance in daily functioning for adults with executive dysfunction following TBI.
18
children were able to engage in CO-OP intervention to successfully improve their occupational performance.
Shannon Taylor, Nora Fayed, Angela Mandich 2007, did a single-case design study to determine the effectiveness of using the CO-OP approach with children ages 5 to 7 years. Four children chose three different goals to work on during therapy. Child and parent Canadian Occupational Performance Measure ratings and performance observation ratings at follow-up demonstrated the effectiveness of the CO-OP approach, supporting the use of the CO-OP with younger children and suggesting further research on the CO-OP with younger children is warranted.
19
CONCEPTUAL FRAMEWORK
This study is focused on CO-OP (cognitive oriented daily occupational performance).CO-OP is “a client-centered, performance based problem solving approach that enables skill acquisition through a process of strategy use and guided discovery. COOP intervention targets occupations, performance and participation that are purposeful and meaningful to the child in context.7
CO-OP approach is derived from the Canadian Model of Occupational Performance and Engagement (CMOP-E) was founded by Polatajko, and Craik in 2007. This model was a further expansion of the Canadian Model of Occupational Performance (CMOP) that was developed by the Canadian Association of Occupational Therapists (CAOT) in 1997. The model identifies the main domains that the profession has an interest in. Engagement was added as a conceptual advancement on the original model as it was identified as an important aspect of human occupation. This advancement was necessitated by the current developments and improvements in knowledge of occupation-based, client centered and evidence-based occupational therapy practice.
In CO-OP, a child-centered or client centered approach is taken and children are encouraged to select their own goals for intervention. At the age at which children participate in CO-OP, their metacognitive skills are developed sufficiently for them to be able to consider their task performance across situations. They are motivated to work on achieving goals that they have set personal. This study focuses on child-chosen goals as an important aspect. Bandura has suggested that children’s actual experiences performing an activity contribute most significantly to their self-perceptions.
COOP approach is a verbally based, individualized approach focused on guiding children to discover and learn cognitive strategies to solve motor problems. It is based on theories such as problem solving, performance based, learning theory and cognitive theories
20
CO-OP
MOTOR LEARNING AND PERFOMANCE EVIDENCE BASED OCCUPATION CENTERED CLIENT CENTERED PERFORMANCE BASED PROBLEM SOLVING Focusing on child-chosen goals
Children are motivated to work on achieving goals
a child can learn and regulate his behavior by instructing himself to identify a goal, develop a plan, enact the plan, and evaluate its success
The interaction of the Individual
The task and The environment
Self-instructional steps (1) Discovery of the problem;
(2) Investigation of the problem;
(3) Selection of alternative solutions;
(4) Attempt to solve the problem;
21 EXPERIMENTAL GROUP INTRODUCING COOP CLIENT CENTERED PERFORMANCE BASED PROBLEM SOLVING
FRAME
WORK
CMOP-E MODEL COOP OBJECTIVES 1 .SKILLACQUISTION 2. STRATEGY USE 3. GENERALIZATION 4. TRANSFER
Establishing contact with school authority and parents.
Orient teachers and parents about COOP
Identify client goals
Administer assessment goal
Initiate the cognitive strategy process
Activities and practices related to shopping skills
Performing different skills
Verify that goals have been met
Focusing on the shopping task
Child practice all fun, creative activities to specific shopping skills Demonstration, verbal guidance and reinforcement
Using cognitive strategies in a different situation
Self talk and practice the shopping task Identify/plan strategies Dynamic performance analysis Facilitate discovery, skill acquisition, and performance.
Guided discovery
Engaging the child
22
METHODOLOGY
PLACE OF STUDY
KMCH occupational therapy department and occupational therapy centers in and around Coimbatore
To administer TOGSS tool - Pazamudhir plus super market at Nehru nagar
RESEARCH DESIGN
Quasi experimental (two group pretest and post test design)
POPULATION
Children diagnosed with learning disability
Within the age group 10-14 years
SAMPLE SIZE- 30
15 experimental groups
15 control groups
SAMPLING TECHNIQUE
Convenient sampling technique
SELECTION CRITERIA Inclusion criteria
Children diagnosed with learning disability by psychiatrist
Children within the age group of 10-14 years
Both boys and girls are included
Willingness to participate
Exclusion criteria
Children with physical dysfunction
23 VARIABLES
Independent variable
CO-OP (cognitive oriented daily occupational performance)
Dependent variable
Shopping skills
Extraneous variable
Children’s receiving occupational therapy regarding money handling and shopping skills
Environmental exposure
Social and communication skills
TOOLS
1) TOGSS (The Test of Grocery Shopping Skills)
2) COPM (Canadian occupational performance measure) 3) PQRS (performance quality rating scale)
1) The Test of Grocery Shopping Skills (TOGSS)
It is used to assess a performance of one’s ability to shop in the community. It looks at ones executive functioning; specifically the ability to locate and select specific items at the lowest price in a natural environment.
Scoring Procedures:
TOGSS consists of 10 items Each item receives 3 scores.
24
Score 0 if the item selected is not accurate, if the size is not correct or if the item is not lowest price
A score is obtained based on the person’s ability to efficiently and accurately find the correct items and the lowest price. There are three subscales scores:
Accuracy: the person’s ability to find the correct item at the required size and lowest price.
Time : how long it took the person to find the item.
Redundancy: the number of aisles the person entered to look for items and how many times a person returned to the same aisle
The therapist also uses observation to assess the strategies the person uses to shop (e.g., scanning overhead signs, asking for help, scanning shelves, checking prices Tally the total of accuracy scores. Add all the item scores, size scores and price scores and place in the total box. There are 30 possible points. Total the time taken to complete the task. (Enter the starting and stopping times.) Identify the minimum number of aisles that must be entered to obtain all items. Subtract this number from the actual number of aisles entered to determine the redundancy score. (Redundancy = actual number of aisles entered – minimum number of aisles needed to find items.) Tally the total number of times participant asked for help Tally the number of times unsolicited help was offered Tally the number of times participant parked the cart
Occupational therapists and other Rehabilitation professional are qualified to use this tool. Need a thorough knowledge of testing manual and instructions before giving test
Reliability: Inter-rater and Test-retest were significant. They provided stability and equivalence.
Inter-rater Reliability _0.99 Test-retest between the two forms _0.64-0.83_
25
Content Validity: Developed following observation and interview with people who have severe mental illness to determine the various aspects of grocery shopping that proved to be important and yet difficult.
Time required administering: Typically 20 – 30 minutes
2) Canadian occupational performance measure (Mary law et al., COPM , 3rd edition),is a criterion based measures of occupational performance in which clients rate the level of importance of, performance of, and satisfaction with goals in self-care, productivity, and leisure on a 10-point scale. A change of 2 or more points in the mean score on the COPM has been reported to indicate clinically significant change. The COPM was developed to detect change in self perception of occupational performance and satisfaction over time in person with variety of disabilities.
Administration and scoring of COPM
The COPM is an instrument administered in a four step process using a semi structured interview conducted by the therapist together with the client and/ or caregiver. The five steps are
Step1: Problem definition Step2: Problem weighting Step3: Scoring
Step4: Re-assessment
Reliability= 0.63 and 0.84
Test retest reliability= 0.79 and 0.75
Internal consistency for performance = 0.41- 0.56 and satisfaction=0.71
26
It is a criterion –referenced performance- based observation rating scale. Quality of task performance is rated according to a 10 point scale based on the competency of the performance with a score of 1 indicative of the child being unable to perform the task even in part and score of 10 indicating competent performance.
PROCEDURE
Approval from the ethical committee, consent from parents and permission from the institutional head
Administration TOGSS, COPM and PQRS scale, prior to the intervention
They were assigned to experimental group and control groups
Regular occupational therapy and COOP intervention were given to experimental group
The duration of the intervention was 12 weeks, 36 sessions, thrice in a week
Regular occupational therapy and money concept training were given to control group
The duration of each session is 45 minutes to 1 hour
27
COOP INTERVENTION PROTOCOL
Prior to therapy Preparation
1.establish contact with parents
2.orient parents to cognitive orientation to daily occupational performance (coop)
3.contract with parents to ensure resources and support 4.provide daily activity log
5. check for child/ parent and therapist prerequisites Assessment
6. review child’s completed activity log
7. administer Canadian occupational performance (COPM) and identifying goals
8. baseline child’s performance using the performance quality rating scale( PQRS)
Session 1 INTRODUCTON OF GLOBAL COGNITIVE STRATEGY
9. introduce global cognitive strategy: goal-plan-do-check
1. therapist introduce the puppet, commander goal plan do check 2. therapist maps goal-plan-do-check
3. child maps goal-plan-do-check to a familiar task
4. parents observe session and discuss application of GPDC at home
Session 2-36 Acquisition- all child identified goals were tackled in this sessions 10. conduct dynamic performance analysis: ongoing
11. facilitate the child’s acquisition and application of the global cognitive strategy: goal-plan-do-check
12. Guided discovery of domain specific strategies (DSS) and mediate their application to skill acquisition.
13. Apply enabling principles.
14.teach parents / caregivers about goal-plan-do-check and applicable domain specific strategies
15. educate parents/caregiver about their ongoing role in facilitating cognitive strategy use to promote skill acquisition
Post test Consolidation
16.readminister COPM
17. Re administer baseline , using TOGSS, PQRS
28 PRE TEST
Child Taken the Items which was not Given in the List
Problem In Getting Correct Change Has difficult in reading the list
29
COLLAGE AVTIVITY
GROCERY ITEM SEARCHING ACTIVITY
30
Post test
A) The child was able to take the correct item which was given in the list without any assistance.
C) The child was able to see the price in the items.
31
DATA ANALYSIS AND RESULTS
In this study the data was collected using the TOGSS (Item, Size, and Price), COPM (Performance and Satisfaction), and PQRS Scale before and after the intervention. The data was subjected to statistical analysis by the statistical package for social sciences (SPSS) software version 20
Descriptive statistics was used to find out the mean, SD, minimum and maximum score is shown in table 1,2,3,and 4
Mean difference was calculated by subtracting the post test mean values from the pretest mean values to find out the effectiveness of therapy
Effect size was calculated by dividing the mean change in score by the SD of baseline scores in children who had received an intervention and were expected to change. Effect size is interpreted according to criteria set by Cohen’s d. An effect size of 0.0- 0.2 was interpreted as small, 0.3-0.5 as medium, 0.6-2or >2 as greater. Is shown in table 6
d= M1-M2/S.D
Where M1 – M2 is mean difference
Non parametric test:
Comparison of the pretest and posttest
Wilcoxon-signed rank test was used to compare within the group to prove effectiveness of COOP intervention over the regular is shown in table 5(5a, 5b, 5c, and 5d)
Comparison between the experimental and the control group
32
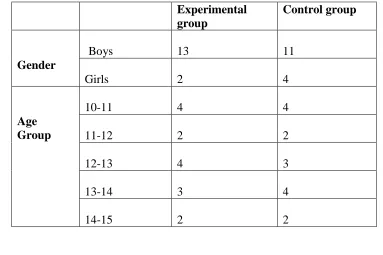
Table 1: Descriptive statistics of the gender and age of the children Experimental
group
Control group
Gender
Boys 13 11
Girls 2 4
Age Group
10-11 4 4
11-12 2 2
12-13 4 3
13-14 3 4
14-15 2 2
Graph 1: Descriptive statistics of the gender of the children
Graph 2: Descriptive statistics of the age of the children
Experimental
male
female
Control
male
female
experimental
10 to 11
11 to 12
12 to 13
13 to 14
14 to 15
control
10 to 11
11 to 12
12 to 13
13 to 14
33
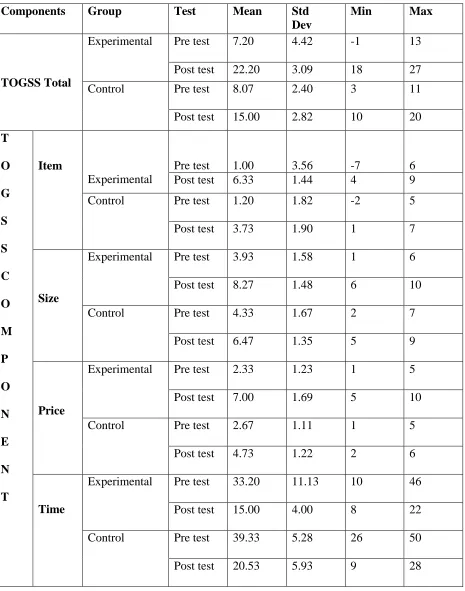
Table 2: Mean and standard deviation of Test of grocery shopping skills and TOGSS Components
Components Group Test Mean Std
Dev
Min Max
TOGSS Total
Experimental Pre test 7.20 4.42 -1 13
Post test 22.20 3.09 18 27
Control Pre test 8.07 2.40 3 11
Post test 15.00 2.82 10 20
T O G S S C O M P O N E N T Item Experimental
Pre test 1.00 3.56 -7 6
Post test 6.33 1.44 4 9
Control Pre test 1.20 1.82 -2 5
Post test 3.73 1.90 1 7
Size
Experimental Pre test 3.93 1.58 1 6
Post test 8.27 1.48 6 10
Control Pre test 4.33 1.67 2 7
Post test 6.47 1.35 5 9
Price
Experimental Pre test 2.33 1.23 1 5
Post test 7.00 1.69 5 10
Control Pre test 2.67 1.11 1 5
Post test 4.73 1.22 2 6
Time
Experimental Pre test 33.20 11.13 10 46
Post test 15.00 4.00 8 22
Control Pre test 39.33 5.28 26 50
34
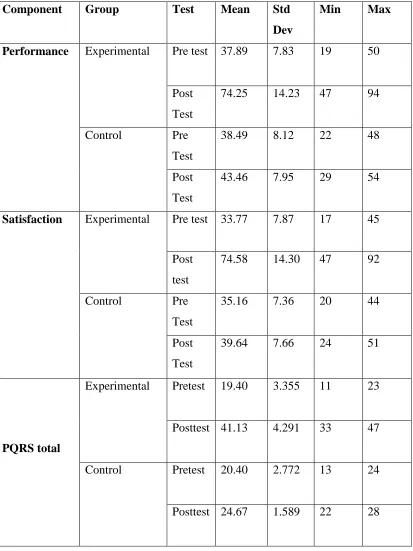
Table 3: Mean and standard deviation of Canadian occupational performance measure (performance and satisfaction component) and PQRS total
Component Group Test Mean Std
Dev
Min Max
Performance Experimental Pre test 37.89 7.83 19 50
Post Test
74.25 14.23 47 94
Control Pre
Test
38.49 8.12 22 48
Post Test
43.46 7.95 29 54
Satisfaction Experimental Pre test 33.77 7.87 17 45
Post test
74.58 14.30 47 92
Control Pre
Test
35.16 7.36 20 44
Post Test
39.64 7.66 24 51
PQRS total
Experimental Pretest 19.40 3.355 11 23
Posttest 41.13 4.291 33 47
Control Pretest 20.40 2.772 13 24
35
Table 4: Mean and standard deviation of Performance Quality Rating Scale (PQRS) of performance component
Components Group Test Mean Std
deviation
Min Max
Reading list
Experimental
Pretest 3.93 1.66 1 7
Posttest 8.07 1.22 6 10
Control Pretest 4.20 0.86 3 5
Posttest 5.33 0.61 5 7
Item
Experimental Pretest 3.47 1.12 2 5
Posttest 8.33 0.90 7 10
Control Pretest 4.00 0.53 3 5
Posttest 4.33 0.61 4 6
Size
Experimental Pretest 3.73 1.03 2 5
Posttest 8.07 0.96 7 10
Control Pretest 3.87 0.99 2 5
Posttest 4.80 0.41 4 5
Price
Experimental Pretest 3.47 1.24 1 6
Posttest 8.07 1.03 6 10
Control Pretest 3.87 0.83 2 5
Posttest 4.93 0.25 4 5
Money handling
Experimental Pretest 4.80 1.01 3 7
Posttest 8.53 1.06 6 10
Control Pretest 4.40 1.12 2 6
36
TABLE5: COMPARISON OF PRE-TEST and POST TEST
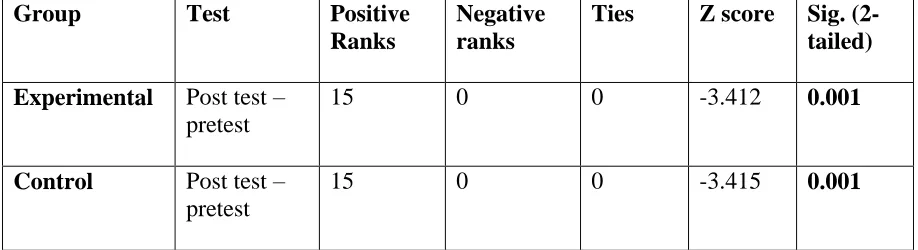
Table 5a: Comparison of pre test and post test scores of Test of Grocery Shopping Skills (TOGSS)
Group Test Positive
Ranks
Negative ranks
Ties Z score Sig. (2-tailed) Experimental Post test –
pretest
15 0 0 -3.412 0.001
Control Post test – pretest
15 0 0 -3.415 0.001
The result shows that there is a significant difference in both experimental group and control group where p is 0.001.
According to the scale high score indicates good/better performance .Thus positive rank indicates (posttest score- pretest score) improvement and vice versa, while ties indicates no improvement.
Positive rank indicates that all children in control and experimental group showed improvement after intervention.
Graph 3: Comparison of pretest and post test of both groups to measure the TOGSS
0 5 10 15 20 25
experimental control
7.20
22.20
8.07
[image:47.612.95.518.464.713.2]37
Table 5b: Comparison of pretest and posttest of Test of Grocery Shopping Skills (TOGSS) accuracy and efficiency of item, size and price component and time taken to complete TOGSS.
Group
Components Test Positive ranks
Negative ranks
Ties Z score Sig. ( 2 tailed)
Experimental
Item Post
test- pre test
15 0 0 -3.41 .001
Size Post
test-pre test
14 0 1 -3.30 .001
Price Post
test-pre test
15 0 0 -3.41 .001
Time Post
test-pre test
1 14 0 -3.35 .001
Control
Item Post
test- pre test
12 1 2 -3.09 .002
Size Post
test- pretest
12 2 1 -2.90 .004
Price Post
test- pretest
12 1 2 -2.67 .008
Time Post
test- pretest
0 15 0 -3.41 .001
The result shows there is a highly significant difference in item, size, price and time component of TOGSS of the experimental group and control group where p value is (<0.05)
According to the scale high score indicates good performance. Thus positive ranks in item size, and price, indicate (post test score- pre test score) improvement and vice versa, while ties indicates no improvement and negative ranks in time indicate (post test score – pre test score) improvement and vice versa, while ties indicates no improvement.
38
Graph 4 and 5shows the pictorial representation of these comparisons.
Graph 4: Comparison of pretest and post test of TOGSS accuracy and efficiency of item, size, and price component
Graph 5: Mean score of pretest and posttest of time taken to complete TOGSS
Note:
Graph 4: The post values of experimental group are much higher than post test values of control group. 0 1 2 3 4 5 6 7 8 9
experimental control experimental control experimental control
pretest
posttest
ITEM SIZE PRICE
39
[image:50.612.72.571.135.448.2]Graph 5: The post values of experimental group are lesser than post test values of control group,
Table 5c: Comparison of pretest and post test scores of COPM and PQRS total
Group Test
components
Test Positive ranks
Negative ranks
ties Z score Sig. ( 2 -tailed)
Experiment al
Performance
Post test-
Pretest 15 0 0 -3.409 0.001
Satisfaction
Post test-
Pretest 15 0 0 -3.408 0.001
PQRS total
Post test- Pretest
15 0 0 -3.417 0.001
Control
Performance
Post
test-pretest 15 0 0 -3.408 0.001
Satisfaction
Post test-
Pretest 15 0 0 -3.409 0.001
PQRS total
Post test- Pretest
14 0 1 -3.307 0.001
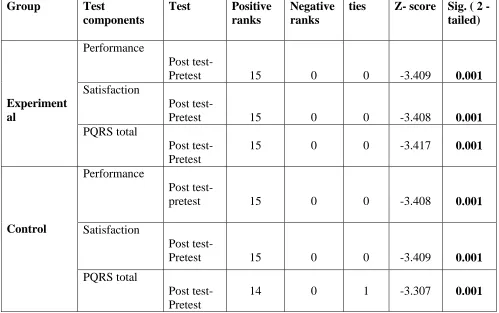
There is a significant difference in performance and satisfaction component of COPM in both experimental and control group where p value is (<0.05).
According to the scale high score indicates good performance. Thus positive ranks indicate (post test score- pre test score) improvement and vice versa, while ties indicate no improvement. The positive rank in experimental group indicates that all children showed improvement in performance, satisfaction and PQRS total after COOP intervention and in control group expect one children in PQRS- ties all children shows improvement in performance, satisfaction and PQRS total
40 Graph 6:
Comparison of pretest and posttest of both groups to measure the performance and the satisfaction level according to COPM
Note: The post test values of experimental group are much higher than post test values of control group.
0 10 20 30 40 50 60 70 80
experimental control experimental control experimental control
pretest
posttest
PERFORMANCE SATISFACTION
37.89 74.25
38.49 43.46
33.77 74.58
35.16 39.64
19.40 41.13
41
Table 5d: Comparison of pretest and posttest of PQRS of performance component Group Components Test Positive
ranks
Negative ranks
Ties z-score Sig.(2- tailed)
Experimental
Reading list Posttest-pretest
15 0 0 -3.42 .001
Item
Posttest-pretest
15 0 0 -3.47 .001
Size
Posttest-pretest
15 0 0 -3.44 .001
Price
Posttest-pretest
15 0 0 -3.43 .001
Money handling
Posttest-pretest
15 0 0 -3.48 .001
Control
Reading list Posttest-pretest
10 0 5 -3.48 .004
Item
Posttest-pretest
5 0 10 -2.23 .025
size
Posttest-pretest
10 0 5 -2.88 .004
price
Posttest-pretest
11 0 4 -3.02 .002
Money handling
Posttest-pretest
8 0 7 -2.56 .010
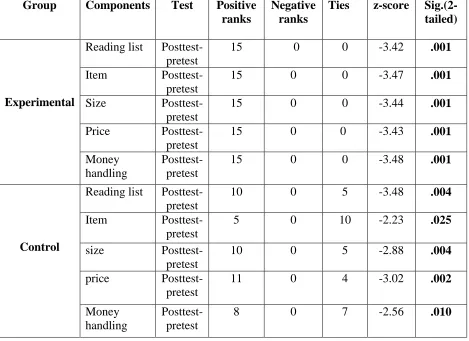
The result shows there is a significant difference in reading list, item, size, price and money handling of the experimental group where p value is (<0.05)
According to the scale high score indicates good performance. Thus positive ranks indicates (post test score- pre test score) improvement and vice versa, while ties indicates no improvement It can be noted that all children in experimental group showed improvement, where as in control group few children detoriation and no improvement.
42
Graph 7: Comparison of pre test and post test of PQRS performance component.
0 1 2 3 4 5 6 7 8 9
pretest
posttest
readng list item size
price money handling
3.93 8.07
4.20 5.33
3.47 8.33
4 4.33
8.07
3.73 3.87
4.80
3.47 8.07
3.87
4.93 4.80 8.53
43
[image:54.612.69.585.183.618.2]COMPARISON OF EFFECT SIZE
Table 6: Comparison of effect size on TOGSS, COPM and PQRS scale between experimental and control groups
Scale
Control Experimental
Test Mean Std deviati on Mean differe nce Effect size
Mean Std deviati on Mean differe nce Effect Size
TOGSS Pre
Test
8.07 2.40
6.93 2.8
7.20 4.42
15 3.38
Post test
15.00 2.82 22.20 3.09
COPM Performance
Pre test
38.49 8.12
4.97 0.6
37.89 7.83
36.36 4.64
Post test
43.46 7.95 74.25 14.23
Satisfaction Pre test
35.16 7.36
4.48 0.6
33.77 7.87
9.69 1.23
Post test
39.64 7.66 43.46 7.95
PQRS Pre
test
20.40 2.77
4.27 1.5
19.40 3.35
21.73 6.4
Post Test
24.67 1.58 41.13 4.29
44
[image:55.612.74.539.161.347.2]TABLE 7: COMPARISON BETWEEN EXPERIMENTAL AND CONTROL GROUPS Table 7a: Comparison between experimental and control groups scores of TOGSS total
Test Group N Mean
rank
Sum of ranks
U score Sig (2-tailed)
Pre test Experimental
15 15.03 225.50
105.5 .770
Control
15 15.97 239.50
Post test Experimental 15
22.57 338.50
6.5 .000
Control
15 8.43 126.50
The pretest of TOGSS shows that there is no significant where p is (>0.05). This indicates that there is homogeneity of the group and thus post test scores can be compared
There is a significant difference in the post test of TOGSS scale where p is 0.000(<0.05). This indicate that there is improvement in post test
45
Graph 8: Mean score of pretest and post test of both groups to measure the TOGSS
Graph shows that the post test values of experimental values are much higher than post test values of control group
0 5 10 15 20 25
experimental control experimental control
pre test post test
7.20
22.20
8.07
46
Table 7b: Comparison between experimental and control group of scores of TOGSS accuracy and efficiency of item, size and price component
Test Component Group N Mean
rank
Sum of ranks
U score Sig. (2-tailed)
Pre test
Item Experimental 15 16.33 245.00 100.00 .599
Control 15 14.67 220.00
Size Experimental 15 14.63 219.50 99.50 .584
Control 15 16.37 245.50
Price Experimental 15 14.03 210.50 90.50 .344
Control 15 16.97 254.50
Time Experimental 15 13.37 200.50 80.50 .183
Control 15 17.63 264.50
Post test
Item Experimental 15 20.80 312.00 33.00 .001
Control 15 10.20 153.00
Size Experimental 15 20.23 303.50 41.50 .003
Control 15 10.77 161.50
Price Experimental 15 20.80 312.00 33.00 .001
Control 15 10.20 153.00
Time Experimental 15 11.43 171.50 51.50 .011
Control 15 19.57 294.50
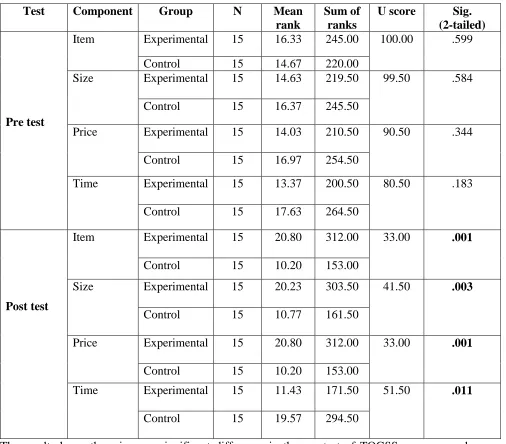
The result shows there is a no significant difference in the pre test of TOGSS accuracy and efficiency of item, size and price component where p value is (>0.05). This indicates that there is homogeneity of the group and thus post test scores can be compared.
47
Table 7c: Comparison between experimental and control group scores of COPM- performance and satisfaction components and PQRS TOTAL.
Component Test Group N Mean
rank
Sum of ranks
U score Sig. (2-tailed) Pre test performance Experimental 15 15.07 226.00
106.000 .787
Control 15 15.93 239.00
Satisfaction Experimental 15 14.67 220.00 100.00 .604
Control 15 16.33 245.00
PQRS total Experimental 15 14.20 213.00 93.00 .413
Control 15 16.80 252.00
Post test Performance Experimental 15 22.50 337.50 7.500 .000
Control 15 8.50 127.50
Satisfaction Experimental 15 22.93 344.00 1.00 .000
Control 15 8.07 121.00
PQRS total Experimental 15 23.00 345.00 .000 .000
Control 15 8.00 120.00
The result shows there is no significant difference in the pre test of both performance and satisfaction component of COPM and PQRS total where p value is (>0.05). This indicates that there is homogeneity of the group and thus post test scores can be compared.
48
Graph 9: Comparison between pretest and posttest of both groups to measure the performance and the satisfaction level according to COPM and PQRS total.
It is noted the post values of experimental group are much higher than control group,
0 10 20 30 40 50 60 70 80
COPM & PQRS total
experime ntal control
experime ntal control
experime ntal control
experime ntal control
experime ntal control
49
Table 7d: Comparison between experimental and control groups of scores of PQRS of performance component
Test Components Group N Mean
rank
Sum of ranks
U score Sig.(2-tailed)
Pre test
Reading list Experimental 15 14.80 222.00 102.00 .651
Control 15 16.20 243.00
Item Experimental 15 13.50 202.50 82.50 .174
Control 15 17.50 262.50
Size Experimental 15 15.00 225.00 105.00 .746
Control 15 16.00 240.00
Price Experimental 15 13.83 207.50 87.50 .270
Control 15 17.17 257.50
Money handling
Experimental 15 16.60 249.00 96.00 .438
Control 15 14.40 216.00
Post test
Reading list
Experimental 15 22.67 340.00 5.00 .000
Control 15 8.33 125.00
Item Experimental 15 23.00 345.00 .000 .000
Control 15 8.00 120.00
Size Experimental 15 23.00 345.00 .000 .000
Control 15 8.00 120.00
Price Experimental 15 23.00 345.00 .000 .000
Control 15 8.00 120.00
Money handling
Experimental 15 22.83 342.50 2.50 .000
Control 15 8.17 122.50
The result shows there is no significant difference in the pre test of PQRS performance component where p value is (>0.05). This indicates that there is homogeneity of the group and thus post test scores can be compared.
50
Graph 10: Comparison of individual scores on PQRS
This graph shows that the post test values of each child in experimental group had shown more improvement than control group.
0 5 10 15 20 25 30 35 40 45 50
1 2 3 4 5 6 7 8 9 10 11 12 13 14 15
pretestexp
posttestexp
pretestcon
posttestcon
51
Graph 11:Scores of PQRS from 1st week to 12 weeks of experimental group
The graphs shows all the children PQRS values were increased from pretest, 1week -12 week to posttest indicate COOP was effective.
0 5 10 15 20 25 30 35 40 45 50
sub1
sub2
sub3
sub4
sub5
sub6
sub7
sub8
sub9
sub10
sub11
sub12
sub13
sub14
52
DISCUSSION
The study was conducted in Rashmika centre and Cognito Academy in Coimbatore for 36 sessions within 12 weeks. Totally 30 children diagnosed with learning disability based on inclusion and exclusion criteria were included in this study and children were divided into two groups 15 in experimental group and 15 in control group. Assessment tools like TOGSS, COPM and PQRS were used as outcome measures. Experimental group underwent regular occupational therapy and COOP intervention and control group underwent regular occupational therapy and money handling skills training for 36 sessions.
The mean age of children in experimental group was 9.96 and the mean age of children in control group was 9.96, 24 boys and 6 girls was included in both the group.
The shopping skills of chil