“The disadvantage of
being young in today’s
labour market can only
be overcome through a
new educational
offer…”
YOUTH LABOUR’S LOST
Matt Grist
Jonathan Birdwell
Thomas Gregory
Jenny Ousbey
Youth employment is currently in crisis, with nearly a millionyoung people registered unemployed. Yet beneath a recession-driven short-term squeeze on job creation lies a potentially more serious problem: the steady rise of youth unemployment as a share of total unemployment over the last 20 years. Arguments that this rise is due to competition from immigrant labour and older workers are inconclusive. More plausibly it seems there exists a ‘young person’s penalty’, whereby younger workers are held back by the fact they lack experience, yet they are pushed through a system that often does little to make up for this.
Youth Labour’s Lostdraws on quantitative analysis from a range of sources, including the Longitudinal Study of Young People in England and education and employment data from the Office for National Statistics. It also draws on qualitative research with young people and UK employers. Through these two lenses researchers identify the salient patterns in the UK’s youth labour market, and attempt to isolate the
underlying causes of its long-term problem with youth unemployment.
In order to reverse the growing trend of youth joblessness, this pamphlet suggests that there are four crucial areas of intervention: post-16 vocational education; incentives to work; one-to-one job search advice; and targeted programmes for young people with personal problems. Government is moving in the right direction on all these fronts, but unless it is both more consistent and more radical in presenting a new offer for young people, the UK will continue to see its youth’s labour lost.
Matt Grist and Jonathan Birdwell are senior researchers at Demos. Thomas Gregory and Jenny Ousbey are junior associates at Demos.
Youth Lab
our’
s Lost
|
Matt Grist · Jonathan Bir
dwell · Thomas Gr
egory · Jenny Ousb
ey
traditional, ‘ivory tower’ model of policy making by giving a voice to people and communities. We work together with the groups and individuals who are the focus of our research, including them in citizens’ juries, deliberative workshops, focus groups and ethnographic research. Through our high quality and socially responsible research, Demos has established itself as the leading independent think-tank in British politics. In 2011, our work is focused on five programmes: Family and Society; Public Services and Welfare; Violence and Extremism; Public Interest and Political Economy. We also have two political research programmes: the Progressive Conservatism Project and Open Left, investigating the future of the centre-Right and centre-Left.
First published in 2011 © Demos. Some rights reserved
Magdalen House, 136 Tooley Street, London, SE1 2TU, UK
ISBN 978 1 906693 84 8 Series design by modernactivity Typeset by Chat Noir Design, Charente Printed by Lecturis, Eindhoven
Set in Gotham Rounded and Baskerville 10
Matt Grist
Open access. Some rights reserved.
As the publisher of this work, Demos wants to encourage the circulation of our work as widely as possible while retaining the copyright. We therefore have an open access policy which enables anyone to access our content online without charge.
Anyone can download, save, perform or distribute this work in any format, including translation, without written permission. This is subject to the terms of the Demos licence found at the back of this publication. Its main conditions are:
· Demos and the author(s) are credited
· This summary and the address www.demos.co.ukare displayed · The text is not altered and is used in full
· The work is not resold
· A copy of the work or link to its use online is sent to Demos
You are welcome to ask for permission to use this work for purposes other than those covered by the licence. Demos gratefully acknowledges the work of Creative Commons in inspiring our approach to copyright. To find out more go to
Acknowledgements 7
Executive summary
91 The state of youth unemployment
192 Transitions
393 The NEETs
574 Getting into work
715 Conclusion and policy recommendations
95Glossary
109Appendix 1 Understanding and defining
unemployment
111Appendix 2 Post-16 education maps for
16–18-year-olds
115Appendix 3 Savings for employer per
employee of waiving national insurance and
creating a national insurance credit from the
rising government receipts
119Notes 121
Acknowledgements
We are very grateful for the generous support of the Foyer Federation, without which this project would not have been possible. In particular, we would like to thank Steve Hillman for all of his support, guidance and feedback, and Tom Johnson for helping to coordinate the focus groups.
We would also like to extend our sincere thanks and appreciation to all those people who participated in the research. They include all the young people we spoke to at the Foyer Federation in Braintree and Ravenshead. We would also like to thank everyone who assisted us with the employer case studies, in particular the staff at B&Q Waltham Forest, their manager Erik Kerr, human resources director at B&Q Liz Bell, Network Rail’s head of resourcing Adrian Thomas, former apprentice (and now senior technical officer) Daniel Mahoney and head of media campaigns Kate Snowden. Many thanks also to Dr David Etherington and January Hendeliowitz for taking the time to respond to our queries and providing very useful information for the report.
At Demos, as ever, there are many who provided fantastic help along the way. Huge thanks are due to Phillida Cheetham who conducted the focus groups at the Foyer Federation and provided excellent background research to inform the report. We would also like to thank Camilla Gruffydd-Jones and Jeeta Patel for all their invaluable research and support on this project. Thanks are due to Claudia Wood for her excellent feedback on earlier versions of the report. Finally, thank you to Beatrice Karol Burks and Ralph Scott for seeing the report through to
publication.
Any errors or omissions remain our own.
Executive summary
Before the financial crisis hit, youth unemployment had already been on the rise. In fact, UK youth unemployment has risen consistently as a share of total unemployment for the past 20 years. Experts are divided as to why this is. Some blame pressure from globalisation and immigration, while others blame the rise in employment rates of older workers.1Both of these
explana-tions have been shown to be less than convincing.2
The young person’s penalty
In this report, we present new research into the issue of youth unemployment in the UK. Rather than potential macro-economic and global causes, we are concerned with the way the education system and labour market have been shaped by policy so as to produce what we describe as a young person’s penalty. As we argue, and the figures attest, young people face a disadvan-tage in the labour market. This penalty is, on the one hand, natural: young people lack work experience relative to older workers, and experience is one of the most powerful forms of currency in the labour market. However, this penalty exists also because policy has not been closely enough moulded around the needs of young people. Too often young people have had to fit into a bureaucratic system, rather than have that system fit around them.
This misdirection of policy has occurred in the following four areas:
· the provision of post-16 vocational education · incentives to work
· policy aimed at young people disengaged from education and the labour market
Executive summary
The provision of post-16 vocational education
The quest, undertaken by the last government, to create a single qualifications framework (the Qualifications Credit Framework) populated by flexible, ‘modular’ qualifications has encouraged further education institutions to offer short, often unconnected courses (often national vocational qualifications; NVQs), which do not add up to balanced, long-duration curricula that cumulatively develop skills.
This trend towards bureaucratic tidiness trumping students’ needs started in the late 1980s with the Youth Training Scheme (YTS) and the development of NVQs. Under the then Conservative government, too much time was spent on writing descriptions of skills, and too little attention paid to the practice of teaching them, or whether what was being learned was valuable.3
Moreover, funding arrangements under the last government compounded the negative impact. Through paying ‘training providers’ on the completion of courses the Labour government encouraged the offer of easy rather than challenging courses. And through paying per qualification rather than per student, they encouraged institutions to focus on how many qualifica-tions they could get young people to take, rather than on what combination of courses would provide a balanced education.
In addition to poor provision of curricula, the advice given to young people on what vocational courses to take under the last three governments became almost completely disconnected from which ones were valuable in the labour market. Rather than helping young people prepare themselves best for the labour market, advice on what to study became based on bureaucratic frameworks and funding models.
Incentives to work
on entering work. The new Universal Credit aims to correct this problem and improve incentives to work. However, young people are also disincentivised by lower minimum wages. In the case of 16–17-year-olds, largely doing part-time work and almost always living at home, lower wages are mitigated by lower living costs. But for 18–20-year-olds, currently offered a wage of £4.98 per hour as opposed to the full rate of £6.08, there may well be no such mitigation. For this age group, the incentive to work is reduced at a time when many of them should be gaining valuable work experience.
Job search support
One important element in any policy framework for youth unemployment is one-to-one job search support. In the UK, governments have realised the importance of providing one-to-one advice but have not gone-to-one far enough in making it available as early as possible. The Labour Government’s New Deal for Young People (NDYP) offered one-to-one support, but entry to the scheme only began once a young person had been unemployed for six months.4The new Work Programme offers
one-to-one support after three months to young people con-sidered ‘at risk’, but delays this support until nine months for all other 18–24-year-olds (compared with 12 months for 24–60-year-olds, and six months for the over-60s).
Policy aimed at young people disengaged from education and the labour market
The headline measure for young people who are neither working nor in education is that of being not in employment, education or training – NEET. This measure was first introduced for 16–17-year-olds who had dropped out of education but were not in employment. Over the years the definition has been expanded to include the entire 16–24 cohort not in education or employment, and as a result, has lost much of its power in helpfully targeting policy.
The NEET category is now too broad and is defined (unhelpfully) by what people are not doing (not working or taking part in education or training), rather than what they are doing. A 17-year-old with no GCSEs, no post-16 training and no job is counted as NEET alongside a 24-year-old with a degree, who is married and staying at home to look after his or her family. This broadness can lead to stigmatisation and bad policy.
Our research
In this report we try to get behind the headlines about youth unemployment and assess what can be done to tackle it, all the time bearing in mind the mistakes of past policy. Based on quantitative analysis from a range of sources, including the Longitudinal Study of Young People in England (LSYPE), education and employment data from the Office for National Statistics (ONS) and qualitative research with young people and UK employers, we draw the following conclusions:
Executive summary
· While total unemployment steadily declined since the 1990s up until the recent recession, youth unemployment as a proportion of total unemployment continued to rise during this period, underlining the changing nature of the labour market.
· Economic definitions often obscure the real labour market status of young people, especially as a result of increasing educational participation: once we unpick the somewhat confusing
ONS statistics unemployment for 16–17-year-olds has doubled over the past 20 years.
· Despite the youth unemployment rate being lower in the UK than in many other developed countries, as a proportion of total unemployment it is substantially higher than comparable nations such as France and Germany: one in three unemployed people were aged 15–24 in the UK, compared with one in four in France and the USA, and one in six in Germany.5
· Young people’s pathways through education and employment are marked by ‘churn’ and flux, with those pursuing lower level vocational qualifications post-16 more likely to change between education, employment and unemployment. Once in
employment a young person will on average change their job 3.5 times in their first 11 years of work.6The churn and flux of young
people’s educational pathways suggests that young people are not getting the right advice and guidance, and that the quality of the courses they are taking is poor. The frequency of job change is more a fact of the current labour market. Such volatility suggests that many young people need a broad base of skills that will allow them to navigate a flexible market, rather than sector specific training.7
· Too few young people with poor attainment at 16 go on to achieve core qualifications in maths and English, gain work experience, or do apprenticeships.
· OECD and HESA data suggest that a full-time university degree is still, on average, providing better protection in the current labour market than any other qualification. It is unclear whether this is because of a bias among employers, or whether those going to university are generally more employable. Whatever the case, although degrees do not any more always guarantee higher income, they do seem to provide better protection against unemployment on average.
From our focus groups with unemployed young people we found that:
reasons other than career development. Some said that it was because Connexions and college staff needed to fill places on specific courses. Others pointed out that parents receive benefits if their children stay in college post-16.
· Financial hardship is a pressing issue for many young people. Without the cushion of parental support, young people can be quickly plunged into debt. Several of the young people we spoke to were in debt having had their housing benefit suddenly revoked. This normally followed a change in circumstances such as going off jobseeker’s allowance to take up a minimum wage job, or a college course coming to an end.
· The majority of young people were a long way from the stereo-type of being NEET. Rather than being feckless and workshy, these young people were often eager to work, and ambitious for their futures, but a lack of guidance left many with unrealistic aspirations and few good qualifications. These young people found it hard to imagine a middle ground on which they would be able to use their talents while earning a living.
Executive summary
From our employer case studies we found that:
· In a service sector setting, where many are working part-time, a mixed workforce including old and young employees is ideal. Young people are seen as having more energy, being better at taking direction and better with technology. However, they are less good at customer communication, more likely to call in sick, and less likely to stay in a job for a long period of time. In areas where young employees are not so strong, they are able to learn from older employees – and vice versa.
· Investment in young people through employment and training at an early stage can be mutually beneficial to employers and employees, particularly those employers with very specific skills needs (e.g. engineering).
· The Government needs to continue promoting apprenticeships as an alternative to university and a pathway to sustainable and well-paid employment. This is needed to counteract the cultural bias that leads to parents and students viewing a ‘third rate university’ as more appealing than a ‘first rate apprenticeship’.
Policy recommendations
We present a number of policy recommendations aimed at introducing practical measures that serve the needs of young people, rather than serving bureaucratic concerns, or ideological agendas. We have based our recommendations on evidence about what is proven to protect young people against unemployment, and on what unemployed young people have themselves told us about their predicaments. There are no easy answers, but nevertheless a series of measures can restack the cards more in favour of young people, and start to reverse the long-term rise in UK youth unemployment.
We recommend that the Government should:
· stipulate that publicly funded further education institutions offer flexible learning options– as much as possible should be done to help young people who are studying to work part time, which would decrease youth unemployment while also providing valuable work experience and supplementary income
· continue to promote apprenticeships as a high quality pathway from school to employment that doesn’t necessarily entail university– the current Government has put apprenticeships at the heart of its vocational education and youth unemployment strategy by increasing numbers and investment, but there remain a number of barriers for businesses offering apprenticeships, and cultural biases in favour of university; information, advice and guidance on apprenticeships must reach schools and students much earlier
further education institutions should be incentivised to offer coherent two-year curricula that combine core skills in maths and English with occupationally specific skills, generic transferable work skills, and some academic knowledge – good, well-designed curricula that enhance a wide range of useful skills · aim to raise the cap on student numbers so that more of those young
people who want to study full time for a degree, and possess the requisite aptitude, can do so – this policy is dependent on many other changes to the funding and oversight of higher education, which cannot be detailed here (see forthcoming Demos paper Future Universities8); our research shows that those with degrees
achieved through full-time study are considerably better protected against unemployment than those without on average · guarantee access to the National Careers Advice Service for 14–16-year-olds, and hold schools accountable for providing high quality guidance – careers advice in schools is patchy at best, biased at worst; the establishment of the new National Careers Advice Service (NCAS) and the closing of the poorly performing Connexions may be a step forward, but the Government must commit to holding schools to account for their duty to provide high quality advice and guidance early enough to make a difference
· make one-to-one job search advice mandatory after three months of unemployment for young people, and available after two months for those deemed ‘at risk’ – a crucial factor in getting young people into work is one-to-one support that is tailored to individual needs; countries like Denmark, which have low youth
unemployment rates and take the problem very seriously, invest in such one-to-one support
· continue to invest in voluntary and charitable sector organisations that work with young people at risk of becoming disengaged from education and the job market because of personal issues – some young people have poor qualifications, debts and live in areas of low employment, but others are also held back by personal issues resulting from deprivation, unhappy home lives and mental health problems; targeted interventions that build life-readiness as well as work-readiness are required for these young people · stop measuring ‘NEETs’ – the term NEET has become unhelpful:
NEETs are a diverse bunch, comprising gap year students, lone
parents and prisoners (to name a few), as well as unemployed people; the rise in the participation age to 18 in 2015 offers an opportunity for the ONS to stop measuring NEETs
· raise the minimum wage for 18–20-year-olds to the full rate of £6.08 an hour by 2015 – a rise in the minimum wage would incentivise work and provide greater financial stability for young people who find themselves very quickly falling into debt even when they are in work; this rise should be timed for 2015 to coincide with the raising of the compulsory school-leaving age to 18, in what should be presented as a new ‘deal’ for young people; postponing this rise to 2015 will also give the economy a chance to recover and employers a chance to prepare for the change; finally, increasing the minimum wage could encourage businesses to offer more apprenticeships, which have a much lower minimum wage
1
The state of youth
unemployment
The youth labour market has become a decidedly tough place to be. The 2008 recession has dramatically affected young people’s employment prospects. The latest figures for youth unemploy-ment shows it is a startling 20.8 per cent9– the highest level
since comparable records began in 1992. The percentage increase in unemployment between the beginning of 2007 and the beginning of 2009 was twice as high among 18–24-year-olds as the working age population. Long-term youth unemployment is also increasing: the total number of 18–24-year-olds out of work for two years or more rose to 93,000 between May and July 2011, a 12 per cent rise on the previous quarter (the number of unemployed 18–24-year-olds rose by 77,000 in the three months to July 2011 to reach 769,00).10
Beyond short to medium-term trends there are worries over long-term structural changes to the youth labour market. Top-level statistics mask a more complex picture about the relative disadvantage of young people in the labour market, which has been a trend preceding the financial crisis. The youth unemploy-ment rate has been rising in the UK since 2004, four years before the effects of the financial crash of 2008 were felt.11For the past
two decades, the youth unemployment rate – even in the best of economic times – has been around twice as high as the rest of the working age population. In autumn 2011, the unemployment rate for young people is around three times higher.12
In this chapter we aim to untangle some of the complexity just outlined and present a clear and accurate picture of youth unemployment in the UK. To do this we completed a
Organisation for Economic Co-operation and Development (OECD), and information from the Higher Education Statistics Agency (HESA) and the Longitudinal Study of Young People (LSYPE). Our analysis allows us to look in depth, beyond the headlines, to understand the diversity and complexity of the real drivers behind youth unemployment.
This analysis, combined with a review of existing evidence and studies, identifies the following six key trends concerning youth unemployment in the UK:
The state of youth unemployment
· Unemployment has been rising for all young people, but is most pernicious for 18–24-year-olds not in full-time education. · The relative risk of unemployment for young people in the UK
has been rising and is substantially higher than for peer nations. · The UK’s changing industrial profile, including the decline of
the manufacturing sector and the rise of the service and financial sectors, has made it harder for young people to enter the labour market.
· There are a range of risk factors for young people, including skills, gender and regional location, which increase the likelihood of unemployment.
· The number of older workers in the economy is increasing, with potential consequences for youth employment.
· Young people in employment are much more likely to switch jobs and sectors than in the past.
We discuss each in turn in detail below.
Unemployment is most pernicious for 18–24-year-olds
not in full-time education
Top-level statistics show that unemployment is at historic levels for young people. But this misses the changing relationship young people have with education. One of the most substantial changes in the past two decades is in the higher partici-pation rates in post-16 education (discussed in detail in the next chapter). This has meant that more young people are not able to engage in full-time employment. One of the major
confusions for people looking at youth employment statistics is that a person can be both unemployed and in full-time
education.
The primary definition of unemployment in the UK is taken from the International Labour Organization (ILO). A detailed description of how unemployment is defined is provided in the appendix. The key point is that under the ILO definition, a young person whose main activity is full-time education can still be classified as ‘unemployed’ if they have been actively searching for part-time work. This is distinct from the ‘economic-ally inactive’ who may express a desire to work, but have not actively sought it in the past four weeks.
It is reasonable to be less worried about those young people who are in full-time education but are finding it hard to find part-time work than about those people who are not in full-time education and cannot find any work. The latter can end up in a cycle of disengagement and de-skilling if not helped. So once we understand that some young people are classed as unemployed simply because they cannot find part-time work while studying, we realise that the harm caused by youth unemployment is perhaps not as bad as might have been thought.
Figure 1 breaks down the different possible economic statuses of 16–24-year-olds by whether they are in full-time education. It shows that a substantial number of students are looking for work while in full-time education.
the proportion of 16–17-year-olds who are unemployed and not in full-time education has remained relatively constant since 1993, partly because there has correspondingly been a substantial increase in the proportion of 16–17-year-olds in full-time education who are not seeking employment. Conversely, the unemployment rate of 18–24-year-olds who are not in education has been broadly rising since 2004 – increasing by around half by 2010. This sort of unemployment – where a main rather than supplementary income is sought, and where no education or training is taking place – is potentially pernicious. It is also different from the NEET category, which includes the economically inactive, for instance a young person on a gap year.
The state of youth unemployment
4000
3500
2500
1500 3000
2000
1000
500
0
Unemployed Economically
inactive In employment
Number of youngpeople aged 16–24 who are unemployed,
in employment, or economically inactive (000’s)
Not in FTE In FTE
Figure 1
Understanding the nuances of the figures allows us to identify more precisely the problems faced. If such a high percentage of 16–17-year-olds in full-time education are seeking employment, this implies there is a problem with the supply of part-time jobs for this age group. It could also mean that young people at 16 and 17 are not engaged in their education and are looking instead for employment, as well as highlighting a desire for supplementary income. However, young people aged 18 years and older and in full-time education are more likely to be living away from home, less likely to be getting pocket money, and more likely to rely on a car for transport. With the abolishment of the educational maintenance allowance (EMA), financial pressures on this group may have increased further, underlining the importance of part-time work to supplement living costs.
Increase in the relative risk of unemployment for
young people in the UK and comparison with peer
nations
The financial crisis of 2007 forced up unemployment in the UK. In May to July 2011 unemployment was over 8 per cent overall14
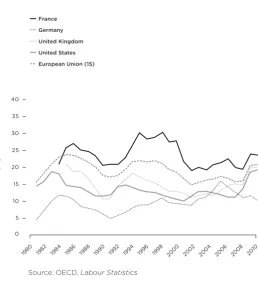
and, as has been stated, it is far higher for young people. Many of our peer nations also saw youth unemployment at levels not reached for two decades. The UK moved closer to the very high levels of youth unemployment found in France. The exception to this trend was Germany, as figure 3 shows. Between 1980 and 2004 Germany’s youth unemployment remained below 10 per cent, half the level of the UK and France.
Yet looking at the absolute level of unemployment says nothing about the sorts of people who are unemployed and the relative risks for different groups of unemployment. A more detailed look at the statistics shows that young people in the UK make up a far higher share of the unemployment than in peer countries.
countries in the European Union. After over a decade of unemployment below German levels, in 2010 it slightly edged above the German rate. Taking account of this difference in long-term unemployment rates, and instead looking at who makes up the unemployed in those countries, shows that the UK is doing particularly badly.
From the proportion of unemployed people who are 15–24 we can see that the ‘relative risk’ of unemployment falls heavily on young people, far more than among peer nations: one in three unemployed people were aged 15–24 in the UK, compared with one in four in France and the USA, and one in six in Germany.
The state of youth unemployment
Estimatedunemployment andnot in full time educationrates by age group
10
6
8
12 14 16
18
20
4
2
0
U
n
e
mp
lo
y
m
e
n
t
ra
te (%)
1993 1994 19951996 1997 19981999 2000 2001 2002 20032004 2005 2006 200 7
200 8
2009 2010 18–24
16–17
Figure 2
Further, not just is the relative risk greater, but it has been increasing. As economic growth took hold again after the recession in the early 1990s, and the longest economic boom in British history began, young people did not get their share of economic growth, and were left behind in unemployment.
Figure 4 shows that since approximately 2002, youth unemployment as a proportion of total unemployment in the UK has exceeded that in peer countries like France, Germany and the USA. Even during the boom time of the late 1990s and early 2000s, young people were at a significant relative disadvantage in the UK labour market.
Youth unemployment rates for 15–24 year olds
25
15 20 30 35 40
10
5
0
Y
o
u
th
un
e
mp
lo
y
m
e
n
t (%)
1980 1982 1984 1986 1988 1990 1992 1994 1996 1998 2000 2002 2004 2006 200 8
2010 Germany
United Kingdom United States European Union (15) France
Figure 3
[image:27.340.56.315.65.353.2]The UK’s changing industrial profile has made it
harder for young people to enter the labour market
As the demands made on the British economy have changed, and technology has advanced, so too the labour market has had to adapt. While globalisation and innovation have been able to increase growth and business profitability, for many they have also increased job insecurity and squeezed earnings. The problem is particularly acute for young people: if they are not equipped with the skills they need to properly engage with the
The state of youth unemployment
Youth unemployment (15–24 year olds) as aproportion
of total unemployment
25 15 20 30 35 40 10 5 0 Y o u th un e mp lo y m e n t a s pr o p ot i o n of t ot a l (%)
1975 1977 1979 1981 1983 1985 1987 1989 1991 1993 1995 1997 1999 2001 200 3
2005 2007 2009 Germany
United Kingdom United States European Union (15) France
Figure 4
economy, they are shut out of it. On the other hand, young people are also in the prime position to take advantage of the changing economy by readying themselves with the skills needed in the key growth industries.
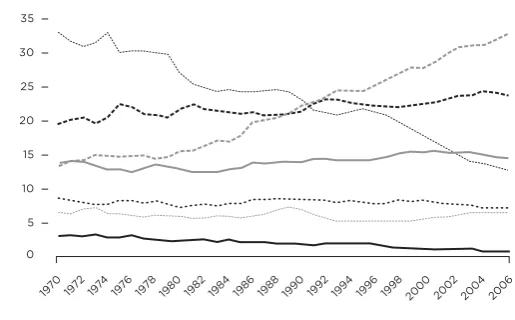
The clearest change in the drivers of economic growth over the past 40 years is the declining contribution of manu-facturing and the rising role of the finance and personal
services sector. Figure 5 shows the changing share of value added to the economy by different sectors between 1970 and 2006.
25
15 20 30 35
10
5
0
Pe
r
ce
n
t
ag
e
1970 19721974197619781980 1982 1984198619881990 19921994 1996 19982000 200 2
2004 2006 Manufacturing
Construction
Wholesale and retail trade – restaurants and hotels Transport, storage and communications
Finance, insurance, real estate and business services Community, social and personal services
Figure 5
[image:29.340.58.316.174.334.2]Manufacturing’s contribution to total economic output fell by more than half during this period.
In The Forgotten Halfwe argued that the decline of the manufacturing sector and other craft-based employment in the UK has deprived the current generation of young people who do not go to university from a pathway to semi-skilled and gainful employment.15
The factory floor of today is a world away from that of 30 years ago. Routine manual work is performed by machines and so the work of people in the manufacturing sector is becoming increasingly skilled. A study from several years ago showed that only about a third of the people who work in manufacturing are employed in production work that is semi-skilled. In fact, around a third of employees in manufacturing are now ‘professional’.16
The Coalition Government aims to rebalance the economy towards exports and manufacturing,17but doing so will have
only a small impact on the labour market, as these jobs will still require an increasingly high level of technical skill.
In 2010 four in five jobs in the UK were in the service sector – a third more than in 1980.18Figure 6 shows the change
in the proportion of UK employees working in different industries between 1988 and 2008. While financial and business services have accounted for an increasing share of value added, it has not been the industry with the largest expansion in employ-ment. In particular, real estate and health and social work have seen some of the largest growth in employment in recent years. The NHS alone employs 1.3 million people, or around one in 23 of the working population.19
Young people need to have better information and advice about the current labour market, growth sectors and necessary skills. Increasingly, science, technology, engineering and maths (STEM) and advanced maths and technical skills will be in high demand, as will communication and soft skills apt for the service sector. But, as we argue further below, the average young person will switch jobs, sectors and even occupations much more frequently than previous generations. As a result, young people need to have a core range of broad skills that allow them to adapt to this type of flexible labour market. The implications of this for
10 15 20 25
5
0
Pe
r
ce
n
t
ag
e
198819891990 1991 199219931994 19951996 199719981999 2000 2001200220032004 2005 2006 200 7
2008 Manufacturing
Construction Hotels and restaurants
Wholesale and retail trade; Repair of motor vehicles, motorcycles and personal and household goods
Transport, storage and communications Financial intermediation
Real estate, renting and business activities
Public administration and defence; Compulsory social security Education
Health and social work
Other community, social and personal service activities
Figure 6
the school system are significant. Rather than simply feeding students knowledge for them to reproduce in exams, schools need to focus on providing students with problem-solving skills and the capability to learn that allows them to adapt to different situations.20
Risk factors for young people
Although unemployment is affecting a wider range of young people, including previously secure graduates, success in the labour market can to some extent be predicted by a set of characteristics or risk factors, including education, gender and regional differences. The next chapter explores risk factors associated with education and skills in more depth. Here we just consider gender and location.
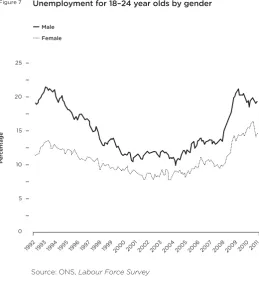
Gender disparities
The unemployment rate for 18–24-year-old men in 2011 was about 5 per cent higher than for women (figure 7). The gap has closed over time, standing at just under 10 per cent in the early 1990s. But the continued difference reflects an entrenched mismatch between demand and supply of work for young men.
This difference in unemployment rates between genders is associated with a number of factors including the higher rate of very low qualifications among men. Another chief factor
continues to be differences in the sectors young men and women go into. Looking just at those aged 18 in the LSYPE, women are six times more likely to go into human health and social work than men. As this was one of the industries of expanding employment and value added, the difference is likely to disadvantage young men. Moreover, young men going into construction were more likely to face limited job opportunities following the 2007 recession and housing market collapse.
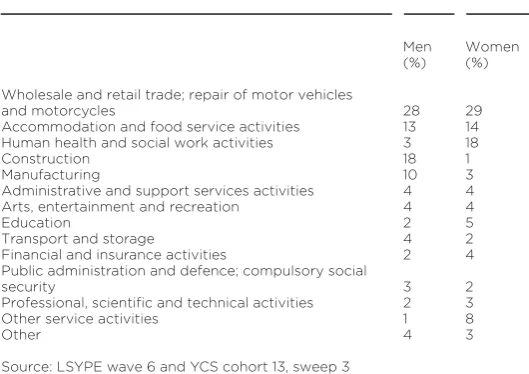
Table 1 shows the industries 18-year-olds in the UK work in, broken down by gender.
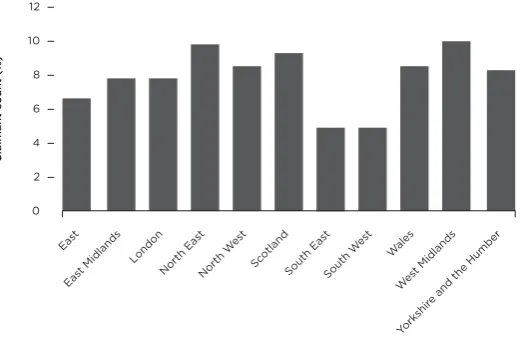
Regional differences
The employment opportunities available to young people are unevenly spread across Britain. The Coalition Government’s commitment to reducing the size of the public sector will particularly hit the north of England, where state expenditure can contribute in excess of 50 per cent of local GDP. As figure 8 shows, the take up of unemployment benefit in the UK varies widely by region – the benefit claimant count is far less
concentrated in the South East and South West of England than elsewhere in the country.
Unemployment for 18–24 year olds by gender
10 15 20 25
5
0
Pe
r
ce
n
t
ag
e
Female Male
199219931994 1995 1996 199719981999 2000 2001200220032004 2005 2006 200720082009 2010 20 11
Figure 7
[image:33.340.53.313.57.341.2]Increase in number of older workers in the economy
The Coalition Government’s abolition of the default retirement age earlier this year will almost definitely bolster employment rates for older workers. As older workers are being encouraged to work beyond the retirement age to reduce the financial burden of an ageing population, this could make it more difficult for young people to find employment.
Figure 9 shows changes in employment rates for different age groups in the UK between 1984 and 2010, based on OECD statistics. Interestingly, while the proportion of over 65s in employment is still small, it has nearly doubled over the past 30 years. Also, 55–64-year-olds are increasingly likely to be in employment. By contrast, there has been a substantial fall in the employment rates of 15–19-year-olds over the past 30 years, corresponding to the increased participation in full-time education of this age group.
[image:34.340.39.304.83.270.2]The state of youth unemployment
Table 1 The industry 18-year-olds in England work in, by gender, 2009
Men Women (%) (%)
Wholesale and retail trade; repair of motor vehicles
and motorcycles 28 29
Accommodation and food service activities 13 14 Human health and social work activities 3 18
Construction 18 1
Manufacturing 10 3
Administrative and support services activities 4 4 Arts, entertainment and recreation 4 4
Education 2 5
Transport and storage 4 2
Financial and insurance activities 2 4 Public administration and defence; compulsory social
security 3 2
Professional, scientific and technical activities 2 3 Other service activities 1 8
Other 4 3
Older people leaving work allowed a natural churn, opening spaces for new employees. Yet with the end of working life becoming increasingly flexible, and the comparative lesser need for investment in the skills of older workers, there are powerful incentives for employers to rely on existing workers, instead of employing and training young people.
Moreover, older workers are more likely to be seeking part-time work to give them flexibility in retirement. These could be the same part-time jobs that young people are pursuing while at school, or in their first attempts to gain work experience.
This trend appears particularly acute in countries like Italy, which have a severely ageing population. In Italy, older people’s participation rate in work is significantly rising while that of younger people is substantially falling.
As figure 10 shows, since 2000, youth employment has been tumbling in Italy, while simultaneously rising at almost the
10 6 12 8 4 2 0
East
East M idland
s
Lond on
North E ast
North Wes
t
Scotl and
Sou th Ea
st
South W est
Wales
Wes t Mid
lands
Yorksh ire and
the H umb
er
Figure 8
Cl aiman t c o un t (%)
[image:35.340.55.316.84.253.2]same rate for older workers. This situation seems to imply an over emphasis on ensuring an ageing population can pay for itself and an under emphasis on getting the young into work, despite young people being the base for future growth. And there is evidence of this increased preference for older workers in the UK (see our case study in chapter 4). In 2008 and 2009 the number of entry level graduate jobs fell substantially, and subsequent improvements in 2010 and 2011 have not been able to make up for this drop in the number of jobs. Meanwhile there
The state of youth unemployment
Employment rate by age group, over time
40 50 30 60 70 80 90 100 20 10 0 P r o p o r t i o n of ag e gr o up in e mp lo y m e n t (%)
1984 1986 1988 1990 1992 1994 1998 2000 2002 2004 2006 200 8 2010 20–24 25–34 35–44 45–54 55–64 65+ 15–64 15–19
Figure 9
has been a substantial increase in the number of graduates.21By
contrast, employment rates among the oldest group of workers are continually rising.
This tendency to hire older workers is not to imply that they are necessarily blocking jobs that would be taken up by young workers, because it can lead to greater overall
productivity and hence investment in further jobs. But the UK should be wary of sleep-walking into a situation where over-reliance on older employees combined with under-investment in younger ones has the cumulative effect of harming productivity
Employment saturationrate in Italy
20 25 15 30 35 40 45 50 10 5 0 P r o p o r t i o n of ag e gr o up in e mp lo y m e n t (%)
1983 1985 1987 1989 1991 1993 1995 1997 1999 2001 2003 2007 2009 55–64
15–24
Figure 10
in the medium and long term. Thus the problem with an over-reliance on older workers is not necessarily that they arejust blocking jobs for young people, but rather that there is now a generation of workers who are under-skilled.
Young people switch jobs and sectors more than in
the past
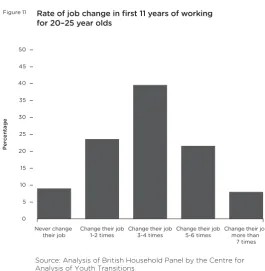
Young people in employment are much more likely to switch jobs and sectors than in the past. The journey of young people who are successful in gaining a foothold on the employment ladder is increasingly characterised by flux. Almost two in three young people in employment aged between 17–18 and 18–19 have changed sector, according to the Wolf Review, which shows there is ‘considerable occupational churn’ in this age bracket.22Figure
11 shows that on average 20–25-year-olds change their job 3.5 times in their first 11 years of work.
Dividing young people into nine different occupational codes for each of the two years when they enter the labour market (age 17–18 and 18–19) we can see that 42 per cent of young people have a different code for the different years. This demonstrates that almost half of young people have changed occupation within two years of entering employment. Moreover, 62 per cent of young people changed sector in this same period.23
Policy aimed at tackling youth unemployment should focus on understanding what industries are growing and therefore what skills are becoming more valuable, bearing in mind the high degree of churn that characterises a young person’s journey through employment. Because young people tend to switch often between occupations during their initial years in employment, where they enter in the labour market often has little bearing on where they are in it by age 25. Looking at the key sectors where young people have success in employment does not reveal where we should focus our resources, because of the degree of occupational change.
Given this high degree of churn, one might expect young people to report job dissatisfaction. In fact, some evidence suggests that when young people are in work they report high
levels of job satisfaction. Analysis of the LSYPE shows that seven in ten 18-year-olds in employment found their job interesting, were satisfied with their pay, and said their job makes them ‘feel worthwhile’, and almost two in three are pleased with promotion prospects; four in five say their job is secure and over nine in ten people get on with their boss and colleagues (table 2).24
This research suggests that young people are happy when they are in work and happy to move jobs many times in order to help themselves progress their careers. Given their apparent feelings of job security we might suggest that a lot of
employment churn is due to choices young people are making rather than instability in the labour market.
25
15 30
20 35 40 45 50
10
5
0
Never change
their job Chang1-2 te theimesir job Chang3-4 te theimesir job Chang5-6 te theimesir job Changmore thee thanir job
7 times
Pe
r
ce
n
t
ag
e
Figure 11
[image:39.340.49.315.49.321.2]Given young people’s willingness to engage with a flexible labour market, policy responses like the New Deal or Future Jobs Fund (examined in more detail in chapter 4), which ‘guarantee’ employment for unemployed young people, take the wrong tack. The right approach would be to supply young people with the skills – core, employability and (where
appropriate) technical skills – that would allow them to feel able to negotiate the UK’s flexible labour market. In other words, the right approach is to ‘teach a man to fish’, rather than provide him with subsidised fish. Or in more technical language, build young people’s capabilities and ensure they have the core skills needed to navigate a flexible labour market. In the following chapters we discuss approaches to tackling youth unemployment within a flexible labour market along these lines. The next chapter looks specifically at young people’s transitions through post-16 education, what qualifications they are achieving and how valuable these qualifications are in the labour market.
[image:40.340.36.299.78.271.2]The state of youth unemployment
Table 2 Opinions of 18-year-olds in the UK on their job, based on LSYPE, 2009
Strongly Agree Don’t Disagree Strongly agree know disagree
There are no promotion
prospects 8 22 3 45 22
Present job is part of a
career 18 30 3 27 21
I am pleased with
promotion prospects 12 49 6 25 9 I am satisfied with pay 11 59 1 21 9 My job is interesting 17 53 1 22 7 Current job is a stepping
stone providing experience 24 50 2 19 6 My job makes me feel
worthwhile 16 56 3 19 6
My job makes a
contribution to society 14 57 6 19 4 My job is secure 22 61 5 11 2 I get on with boss 33 58 1 6 2 I get on with colleagues 45 52 1 2 0
2
Transitions
This chapter builds on previous Demos research in The Forgotten Halfin order to map young people’s transitions from school, through post-16 education and training, into employment.25In
order to get a full picture of the state of the youth labour market we need to know the pathways young people take to get there. To do this, we have compiled a series of visual maps, some presented below and others in the appendix to this report, based on new analysis of the most recent provisional figures on the participation in education, employment and training of 16–18-year-olds for 2010 (provided by the Department for
Education).26
Multiple pathways post-16
Compulsory education up to level 2 is currently defined as lower secondary education (although this will change when the rise in the compulsory participation age to 17 in 2013 and to 18 in 2015 comes into effect). The majority of students at this stage will study for GCSE examinations in the year that they turn 16. Some students may have supplemented their GCSE studies with some vocational qualifications at levels 1 or 2. The Edge Foundation notes the trend towards pre-16 vocational qualifications: the number of vocational qualifications completed in 2009 more than doubled compared with 2008.27This trend is likely to
reverse as the Government plans to reduce the number of voca-tional qualifications in secondary school counted as equivalent to GCSEs, and to restrict the amount of the curriculum that can be dedicated to vocational learning to 20 per cent (while at the same time promoting the more ‘academic’ EBacc curriculum).28
colleges: 82 per cent of 16–18-year-olds attend a state-maintained institution such as a school, academy or further education college; 6 per cent attend an independent sixth form; and 12 per cent of the total 16–18 population have already moved on to higher education.29Upper secondary education is what we are
interested in mapping in this chapter.
Figures 12 and 13 provide the most accurate spread of upper secondary participation across the 16–18 cohort in December 2010. The average cohort size each year for students between 16 and 18 years old is approximately 600,000, with a combined 16–18 cohort equal to approximately 1.8 million young people.
Using these figures and the Wolf review of vocational education, we provide a sketch of six pathways young people take through post-compulsory education:
Transitions
Vocational education Full time education
Employment/unemployment
Mainactivity of 16–18 year olds in 2010
Figure 12
Full time
education Wolerarningk based
Employer
funded
training
Other
education and training
Employed
with
no training Unemployed
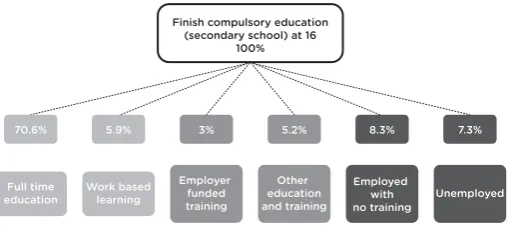
70.6% 5.9% 3% 5.2% 8.3% 7.3%
Finish compulsory education (secondary school) at 16
100%
· the academic route
[image:42.340.50.304.132.246.2]· the ‘lower’ vocational route after few or no qualifications are gained from compulsory education
· the work-based learning (apprenticeship) route · the employment route
· the unemployed or other route
All 16–18 year olds
Figure 13
NVQ Level 1
NVQs/
Btecs
Level 2 GCSEs
NVQs /
Btecs Level 3
A/AS
Level eduHigcheatiron Full time education
4.3% 6.8% 1.5% 14.2% 32.9% 8.6% 70.6%
Source: DfE, Participation in Education, Training and Employment by 16–18 Year Olds in England
The academic route
Young people on the academic route – which is the most common pathway post-16 – study AS and A-levels almost exclusively. This includes approximately 38 per cent of 16–17-year-olds in full-time education and just under a third of the entire 16–18 cohort.30Slightly below half of the population go
The ‘higher’ vocational route following success at level 2 This is the second most popular post-16 route, and most
commonly involves a Business & Technology Education Council (BTEC) National Diploma at Level 3. This group comprises one in five of 16 and 17-year-olds in full-time education.32Students on
this pathway often progress to a level 4 vocational degree and/or a university degree.
The ‘lower’ vocational route after few or no qualifications are gained from compulsory education
Young people on this pathway have struggled to achieve five GCSEs at A*–C grades at 15 or 16 years old. After they leave compulsory education, they overwhelmingly tend to pursue level 1 and 2 qualifications, the vast majority of which are vocational (often NVQs). This group consists of just over a third of 16 and 17-year-olds in full-time education based on data from 2009/10. As we argue further below, young people on this pathway experience significant amounts of churn between courses, employment and periods of inactivity or unemployment. Moreover, as the Wolf Review points out, very few of these young people obtain valuable maths and English qualifications post-16. This is a significant failing that experts have pointed out is unique to the English system and is in drastic need of being corrected. Moreover, unless they are combined with an apprenticeship or followed by a level 3 qualification, almost all lower level vocational qualifications provide meagre or sometimes negative returns in the labour market.33
The work-based learning (apprenticeship) route
Sixteen to eighteen-year-olds on the work-based learning route are a lucky few. The latest figures show approximately 6 per cent of 16–18-year-olds undertook an apprenticeship in 2010. This is despite the fact that apprenticeships (especially for those apprentices who reach level 3) lead to higher wage returns in the labour market,34and that the work experience they provide
helps develop the social and workplace skills that employers highly value. However, not all apprenticeship provision is of
high quality, and some level 2 apprenticeships are arguably not worthy of the name since they are short term and contain training elements of dubious quality.35Moreover, even though
apprenticeships are on the whole a valuable route into work and higher education, the Coalition Government has found it hard to keep expanding the numbers of 16–19-year-old apprentices.36
This is probably because employers are not offering enough of them and the result of negative attitudes towards apprenticeships among young people and their parents.
The employment route
Fewer and fewer young people between 16 and 18 are going straight into employment from school. At present, approx-imately 8 per cent of 16–18-year-olds are in employment without training. The decline in this pathway is due to two interrelated trends: a ‘collapsing’ labour market for this age group and increasing numbers of young people remaining in full-time education until 18. On the one hand, the UK economy has seen the rise of service and professional sectors, which require levels of social skills that 16–18-year-olds may not have developed. On the other hand, as more and more young people remain in education, those who do not are stigmatised in the eyes of employers as low achievers. While young people on this pathway are gaining valuable work experience, despite a lack of formal on-the-job training or qualifications, their likelihood of earning a high wage is very small. Less than two-thirds of the one in eight 16-year-olds who choose to go directly into employment stay on this path; 9 per cent are not in education, employment or training (NEET) for a period while almost a third choose to return to education.
The unemployed or other route
the one hand are those with severe problems (eg learning difficulties, drug and alcohol problems, mental health issues) who are considered ‘entrenched NEETs’. But there is also a wide range of 16–18-year-olds who spend at least some time in this category and for whom there are no special personal difficulties barring entry to the labour market.
Getting UK young people on the right path post-16
The pathway illustrations above provide a rough picture of the options and progressions available to young people today. They are, however, by no means static. The most striking finding of Professor Wolf’s Review is that these routes are porous, particularly for those not pursuing A-levels, level 3 vocational qualifications, or work-based learning,37with approximately 20
per cent of 16–18-year-olds churning between periods of employment and education.38
Analysis of data from the Longitudinal Study of Young People in England (LSYPE) shows that, in total, almost one in four 17-year-olds in that cohort study had a different employment or education status from the one they had at 16 after leaving secondary school. During these two years 12 per cent of the cohort became NEET at some point. However, only 4 per cent were NEET for the whole period. For the most part, a period as NEET represents a disruption in a young person’s progression towards employment, rather than a consistent disengagement with education and employment. According to Wolf, the fact that the overwhelming majority of young people who experience churn are on lower level qualification courses suggests that they are responding to the fact that the qualifications they are study-ing for have little value in the labour market, as well as to a lack of opportunities for progression.39
Figure 14 shows the participation paths of 15–17-year-olds from 2005/06 to 2007/08, based on data from LSYPE and the Youth Cohort Study (YCS) cohort 1.
In addition to channelling far too many young people into lower level vocational qualifications post-16 with little to no
value in the labour market, young people are being disadvan-taged in the labour market because:
Youngpeople’s participationpaths between
the ages of 15 and 17
Age 15 (Y11 2005/06) Age 16 (Y12 2006/07) Age 17 (Y13 2007/08)
In education at age 16
In educationat both 16 and 17
In education at 16 and a job 17
In education at 16 and NEET at 17
NEET at 16 and in education at 17
NEET at 16 and in a job at 17
NEET at both 16 and 17
NEET at age 16 Age 15 population
In a job at 16 and in education at 17
Inajobat both 16 and 17
In a job at 16 and NEET at 17 In a job with / without
training at age 16
80%
82% 66% 11% 3% 4% 8% 1% 2% 2% 4% 4% 14% 30% 9% 62% 24% 47% 30% 8% 12%
Figure 14
Source: Wolf Review, based on LSYPE data
· they lack good quality maths and English qualifications post-16 · they lack work experience and work-based learning post-16 · there is a virtual educational apartheid, which means that young
people who take the ‘lower’ vocational route do not study GCSEs that might be useful to them in the labour market (eg languages and humanities)
to prepare young people for the world of work is that less than half of students leave school with five A*–C grade GCSE passes including English and maths, and only 1.5 per cent of those in post-16 education studying for level 2 work towards GCSEs of any kind. The majority instead pursue vocational qualifications with key skills components (now being replaced by functional skills), which are roundly criticised as being of very poor quality.40This preference for key skills over GCSEs comes in
spite of the fact that the latter qualifications are of ‘critical importance’ according to Professor Alison Wolf, and the most highly regarded by employers, with significant wage returns of 10–20 per cent.41Our report The Forgotten Halfechoed the
findings of the Wolf Review in suggesting that focusing on obtaining English and maths GCSE must be a priority for all students at 16 and beyond.42
Moreover, although work experience as part of vocational education has been shown to be valuable in the labour market, less than one in five studying for vocational qualifications are getting such experience while only 6 per cent are undertaking an apprenticeship.43The number of apprentices post-18 years old is
rising, however employers are still reluctant to take on younger apprentices. According to the Wolf Review, this is because of health and safety concerns, as well as the perception that these young people are low achievers and lack other employability skills (this perception being driven by the trend of more young people remaining in full-time education).44
As a result, young people not on the academic pathway are overwhelmingly combining dubious vocational qualifications with poor literacy and numeracy qualifications and no work experience. As we argue later in this report, these young people should instead as a matter of course combine some vocational qualifications with some academic ones (especially if they lack maths and English GCSE) and some work experience.
The next section extends the analysis beyond post-16 education to explore pathways through university and the link between qualifications, employment rates and wages.
Education level, employment rates and wages
It is a common assumption that the higher the level of your qualification, the better protected you are in the labour market, and the more likely you are to earn higher wages. Research demonstrates that this common assumption is broadly correct. However, most young people (and people in general) are unaware of just how much better off you are likely to be depending on which qualifications you obtain. This section attempts to make those differences clear in a way that is accessible: research into wage returns to qualifications can be incredibly complex because of the wide diversity of qualifications in the UK, and the methodologies involved.
Using data from the OECD’s Education at a Glance 2010 (figure 15) and the Higher Education Statistics Agency (HESA) (figure 16), we present a series of pen portraits based on the most recent research. These portraits illustrate the connection between the multiple pathways laid out above, and education level, employment rate and wages.
Low-skilled, few qualifications (below level 2)
More than one in five people in the UK (22.4 per cent) either have their highest qualification at level 1, or no qualifications at all.45This group is understandably the most at risk in the labour
market. In 2006, this group’s employment rate was less than 50 per cent,46compared with 75 per cent for the rest of the working
population. Even those lucky enough to be in work are unlikely to receive any training to improve their lot – just 4 per cent of those with no qualifications receive training, compared with 20 per cent of those with degrees.47Moreover, as the demand for
unemployment gaining few skills or qualifications and end up in this category.
Educated to level 2 (lower secondary) (figure 15)
Just over one in three people in the UK are educated to level 2 but no higher. This group includes those who achieved GCSEs at 16 and went straight into employment, and those who went on to achieve level 2 qualifications post-16. As the pathways above suggest, this group overwhelmingly pursues vocational qualifications post-16 with poor quality literacy and numeracy components and little work experience. While more likely to be employed then those with no qualifications, almost a third of this group earn very low wages (half the median wage or less) and only 1.2 per cent earn twice the median wage.
There are differences in wage returns based on what kind of level 2 vocational qualification is achieved. For example, the Department for Business, Innovation and Skills (BIS) estimates there is a 12 per cent wage return for someone with BTEC level 2 compared with someone with qualifications below level 2, whereas a National Vocational Qualification (NVQ) brings only a 1 per cent wage return.48Though wage returns are poor on
average for those with NVQs at level 2, even these qualifications are more likely to secure someone employment – people with these qualifications are 12 per cent more likely to be employed than if they had lower qualifications. Nonetheless, individuals in this group are likely to remain in low-skill employment, with little chance for progression.
Educated to level 3 (upper secondary) (figure 15)
Just under half (47 per cent) of the UK population fits in this group, compared with an OECD average of 40 per cent (ranking the UK fifth out of the 24 OECD countries). While this group’s rate of employment is above the national average, and the majority are employed, they are still likely to earn middle-level or low wages. Of those employed, one in five earns half the median wage or less, while 6.7 per cent earns twice the median wage.
Moreover, the type of level 3 qualification has an effect on earnings – with the highest wage returns occurring for those with A-levels, and slowly decreasing from BTECs down to NVQs and other vocational qualifications.53The likelihood of employment
and wage returns also vary according to gender, sector and Wage and employment status depending on level of education
Level of education
Likelihood of being employed
Wage
Upper
secondary
up to level 3
47% (OECD 40%)
Employed80.9% (OECD Avg.
76.1%)
At or below half of the median
wage 20.3%
More than twice the median
wage 6.7%
Unemployed 3.9% (OECD Avg 4.9%)
Tertiary
participation
level 4+ 58% (OECD 58%) Participationin
Type A 34.9%
andparticipation in Type B 15.8%
Employed87.8% (OECD Avg.
84.4%)
At or below half of the median
wage A 6.9%/ B 13.3%
More than twice the median
wage A 27.9%/ B 12.7%
Unemployed 2.3% (OECD Avg 3.4%)
Figure 15
Below upper
secondary
participation
up to level 2
35% (OECD 25%)
Employed 64.9 (OECD Avg.
58.7%)
At or below half of the median
wage 30.9%
More than twice the median
wage 1.2%
Unemployed 6.5% (OECD Avg. 9.1%)
Notes: The first tier of figure 15 shows levels of education and the proportion of the population who held this level in 2007, and the OECD average figures.49The second tier maps the percentage of each of these three groups who were employed50and
unemployed51in 2007, related to the OECD average. The third tier shows the percentage of those employed in 2008 at the different levels of education who are earning a low (at or below half the median) or high (more than twice the median) wage.52
[image:51.340.51.312.104.313.2]occupation. Research from BIS demonstrates that with level 3 NVQs, men are 9 per cent more likely and women 17 per cent more likely to be employed than men and women with level 2 NVQs.54In general, returns are stronger for men in traditional
industries such as manufacturing, construction and lower skilled occupations, and stronger for women in office or service
sectors.55
Box 1 Returns to vocational qualifications
In The Forgotten Half, we summarised previous research showing negative returns to low-level vocational
qualifications.56More recently, analysis from BIS adds some
nuance to the picture of returns to lower level qualifications.57
According to this analysis, level 2 and level 3 NVQ qualifica-tions show positive (albeit often small) returns if they are gained before the age of 25 years old. Moreover, the new BIS analysis suggests that all vocational qualifications are associated with an increased likelihood of being in employment.
The other ‘50 per cent’
The analysis of the three groups above provides a view as to what young people can expect in the labour market if they do not go to university (these three groups add up to just over half of the population). As we argued in The Forgotten Half, every young person should be encouraged to pursue and achieve a level 3 qualification as a minimum. In general, young people experience better outcomes if they have a strong qualification in maths and English, a BTEC vocational qualification up to level 3, and work experience under their belts – in particular, as part of an
apprenticeship. At level 2 and level 3, an apprenticeship provides very good returns. BIS estimates the lifetime benefits of a level 3 apprenticeship to be between £77,000 and £117,000, and lifetime benefits for a level 2 apprenticeship are between £48,000 and £74,000. However, there is still much work to do to ensure that there is a high quality non-university pathway for young people in the UK. The creation of university technical colleges and the
Government’s emphasis on apprenticeships will help, but much more still needs to be done. In the UK, universities remain supreme, both culturally and in their labour market value: there are very high returns to university degrees in the English labour market compared with other European countries.58Our analysis
in the two remaining pen portraits below confirms this, and suggests that at present, full-time study towards a university degree still leads on average to the best employment outcomes compared with other qualifications and pathways.
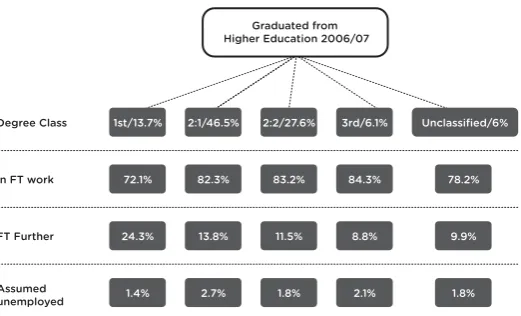
Graduates without a 2.1 degree
For many, getting to university is a significant achievement. But the work does not end there. Whether an undergraduate achieves a 2.1 or above or below a 2.1 is often seen to be correlated with future employment and earnings. However, our research suggests that simply going to university full time – no matter how well you do – is correlated with a very high likelihood of being in employment. Figure 15 shows the main activity of full-time graduates; data on part-full-time graduates can be found in the report by the Higher Education Statistics Agency, Destination of Leavers.59Part-time students, by contrast, are more likely to do
poorly in university than full-time students. Of the 58 per cent of the UK population who have attended university, 39.7 per cent of full-time education students (presented in figure 15) and 59.4 per cent of part-time students graduating in 2010 finished with a 2.2, 3rd or unclassified degree.
Part-time students are less likely to be in full-time