BUILDING RESEARCH&INFORMATION (2000) 28(1), 31-41
Life-cycle energy analysis
of
buildings: a case study
Roger Fay, Graham Treloar and Usha Iyer-Raniga
School of Architecture and Building, Deakin University, Geelong
3217,Australia
E-mail: [email protected]
Energy use is a widely used measure of the environmental impact of buildings. Recent studies have high-lighted the importance of both the operational and embodied energy attributable to buildings over their life-time. The method of assessing lifetime building energy is known as life-cycle energy analysis. With Kyoto target obligations necessitating the quantification of greenhouse gas emissions at the national level, it seems increasingly probable that analyses of this kind will increase in use. If conducted in primary energy terms, such analyses directly reflect greenhouse gas emissions, except for a few processes which involve significant non-energy related emissions such as cement manufacture. A Life-Cycle Assessment would include these is-sues, as well as other environmental parameters, though probably with a corresponding decrease in system boundary completeness. This paper briefly explains some of the theoretical issues associated with life-cycle energy analysis and then uses an Australian based case study to demonstrate its use in evaluating alternative design strategies for an energy efficient residential building. For example, it was found that the addition of higher levels of insulation in Australia paid back its initial embodied energy in life-cycle energy terms in around12years. However, the saving represented less than 6% of the total embodied energy and operational energy of the building over a lOO-year life cycle. This. indicates that there may be other strategies worth pur-suing before additional insulation. Energy efficiency and other environmental strategies should be priori-tized on a life-cycle basis.
La consommation d'energie est un parametre tres utilise Iorsque I'on veut mesurer l'impact des batiments sur I'environnement. Des etudes conduites recemment ont mis en lumiere I'importance de l' energie operationnelle et celle de I'energie intrinseque degagees par les batiments pendant leur duree de vie. L'analyse energetique des batiments pendant leur cycle de vie est une methode d'evaluation de I'energie d'un batiment pendant sa duree de vie. Pour respecter les objectifs de la Conference de Kyoto, ilfaut quantifier les emissions de gaz de serre au niveau national; il semble done de plus en plus probable que la pratique de ces analyses va aller en augrnentant. Si elles portent sur I'energie primaire, ces analyses rendront parfaitement compte des emissions de gaz
a
effets de serre, sauf pour quelques procedes industriels, comme la fabrication du ciment,au
les emissions de ces gaznesontpasIieesa
l'energie. Toutc evaluation du cycle de vie doit tenir compte de ces questions mais aussi d'autres parametres environnementaux, mais avec, sans doute, une moindre nettete des limites des sys-terries. Le presente communication expose brievement quelques uns des problemes theoriques lies aux analyses energetiques sur Ie cycle de vie et s'appuie sur. une etude de cas australienne pour demontrer son utilitea
eva-Iuer d'autres strategies de conception de batimentsa
usage d'habitationa
faible consommation d'energie. On a constate, par exemple, qu'en Australie Ie fait d'ajouter des niveaux d'isolation remboursait en 12 ans environ l'energie intrinseque initiale en terme denergie sur Ie cycle de vie. Toutefois, les economies representaient moins de 6% de I'energie intrinseque totale et de l'energie operationnelle du batiment sur un cycle de vie de 100 ans. Cela veut dire qu'il serait peut etre interessant d'envisager d'autres strategies avant d'augmenter l'iso-lation. On devrait donner prioritea
I'efficacite energetique eta
d'autres strategies environnementales sur Ia base du cycle de vie.Keywords: life-cycle, energy analysis, residential buildings, embodied energy, Australia
Introduction
It is now well understood that buildings, intheir operation, contribute to environmental
degrada-tion, particularIywhere fossil fuels are used as the primary source of energy (England and Casler, 1995). Carbon dioxide emissions from coal-fired power plants, for example, contribute to global
FAY: TRELOAR AND IYER-RANIGA
warming while other emissions (including sul-phur dioxide and nitrous oxide) degrade water, air and soil. Consequently, reducing the fossil fuel based energy used to provide thermal comfort (heating, ventilation and cooling), lighting, hot water and other services (appliances and equip-ment) has been the focus of much research and development activity. The significance of green-house gases attributable to building operation is well understood (Pears, 1997). However, the en-vironment is also degraded in the mining of raw materials, the manufacturing of building materials and products, and finally their transportation and assembly into buildings (Lawson et al., 1995).
Over their lifetimes, buildings are maintained, refurbished, extended and finally demolished. During all these phases resources, such as fossil fuels, are consumed.
The assessment of the environmental impacts of buildings or 'other products throughout their life-times is known as Cycle Assessment. Life-Cycle Assessment (LeA) attempts to provide a measure of the overall environmental impact of a product (Hakkinen, 1994). Variables assessed include fossil fuel based energy and other non-renewable resource requirements, as well as var-ious emissions to soil, water and air. Qualitative judgements are often made in order that a single indicator may be developed, allowing direct com-parison between products. Critics of this method (Lave et al.,1995) claim that the detailed focus of LCAs requires many potentially important pro-cesses to be neglected.
Life-Cycle Energy Analysis (LeEA) is an easily conducted form of Life-Cycle Assessment (LCA) and one which is particularly relevant to the building industry due to energy efficiency efforts over the last few decades. LCA forms part of the ISO 14 000 series of standards on environmental management and is covered by the ISO 14 040 group of standards.
Life-Cycle Energy Analysis (LCEA), however, uses energy as the only measure of environmental impact. Consequently, more detailed analyses of the energy attributable to buildings; are possible. However, the purpose of LCEA is not to replace a broader environmental assessment method, such as LCA, but rather to facilitate decision-making concerning energy efficiency. Comparing the em-bodied energy of a building to its operational en-'·ergy, for example, can indicate potential life cycle
energy efficiency and conservation strategies. Sim-ilarly, LeEA concepts can be used to demonstrate the life cyclebenefits of strategies designed to op-timize the operational energy or embodied energy of a building. For example, thermal insulation has an embodied energy cost - the. energy to make the insulation - but savings in operational energy accrue over time. LCEA can be used to estimate the net savings over the building's life, and per-haps more importantly, the 'energy payback peri-od' - the time taken for the initial embodied energy cost to be paid back by the ongoing opera-tional energy savings accrued, or indeed, the CO2
payback period.
Insummary, a building's life-cycle energy consists of its initial embodied energy, its recurrent embo-died energy and its operational energy over 'its lifetime. There are powerful environmental rea-sons to use LCEA as a decision-making tool at the design development stage. The application of LCEA can result in substantial net reductions in energy use over the projected life of the building.
The aim of this paper is to demonstrate and dis-cuss the use of LCEA in the context of energy effi-cient residential buildings.
Background
In life-cycle energy analysis (LCEA), the energy embodied in a building and the energy used in the operation of the building are calculated for the anticipated lifetime of the building: Simulation methods for embodied .and operational energy have been developed but, like all methods, such simulations have in-built assumptions and limit-ations which reduce the accuracy of the results. These methods used to calculate embodied en-ergy, operational energy and life-cycle enen-ergy, together with their limitations, are discussed be-low, and then a method for LCEA is demon-strated.
Embodied energy
and more difficult to measure. This includes the energy embodied in other inputs of goods and services and the machinery used to support these processes (for example, the forklift trucks that load materials in a factory). The total embodied energy comprises the direct energy purchased to support the process under consideration plus the indirect energy embodiedininputs to the process.
In the initial construction of buildings, the direct energy is the energy purchased by. contractors on-site and off-on-site to facilitate any construction, pre-fabrication, administration and transport activities under their control (including sub-contractors). The indirect energy of construction comprises mainly the energy embodied in .building materi-als. Together, these amounts of energy constitute the initial embodied energyof the building. How-ever, during a building's life, embodied energy is added through goods and services used in main-tenance and refurbishment. These are typically modelled by assuming typical replacement rates for items inthe building (for example, paint) and is known as the recurrent embodied energy.
A number of methods have been developed to calculate embodied energy as completely and as accurately as possible: process analysis; input-output analysis; and hybrid analysis.
In theory, though not necessarily in practice, the simplest embodied energy analysis method is known as process analysis. This method focuses on the energy required for particular industrial pro-cesses. In brick-making, for example, the energy metered at the factory boundary can be measured (i.e. the direct energy requirement). However, such a measurement is incomplete because it ex-cludes, for example, the energy used to extract clay from the ground and then to transport it to the brickworks (i.e. the indirect energy). Process analysis can be used to measure the energy used, per brick say, for many of these processes. How-ever, at each stage there may be many large or small inputs of goods and services which cannot all be covered in detail using the process analysis method (Boustead and Hancock, 1979).
A method that can provide an estimate of all energy embodied in a product is known as input-output analysis. This method makes use of national statistical information compiled by governments for the purpose of analysing national economic flows between sectors. These economic flows can
LIFE-CYCLE ENERGY ANAL YBIS OF BUILDINGS
be translated into energy flows using average energy tariffs. While theoretically complete, this method has several methodological problems, dis-cussed elsewhere (Treloar, 1997). Consequently, this method is not considered reliable for embo-died energy analysis of an individual product.
A third method, known as hybrid analysis, com-bines the strengths of process analysis (reliable en-ergy consumption figures for particular processes) with those of input-output analysis (theoretically . complete system framework) while eliminating, as much as possible, their inherent weaknesses (in-completeness and errors respectively). The most important deficiency with the hybrid analysis method is the lack of a comprehensive and reliable database of energy use data from industry (Bul-lard et al.,1978). More often than not, the unreli-able input-output data have to be relied upon for many processes which may include the main pro-cess or propro-cesses and which may be one or more transactions upstream from the main process.
Primary versus secondary energy
Since energy is the basic unit of measurement in an LCEA, the form of energy must be clarified. Energy is metered at the point of entry to the property or building. The energy used by the consumer is known as delivered energy. However, a considerable amount of energy is used to produce the delivered energy and it varies accord-ing to fuel type. (for example, electricity or gas) and the means of producing the. energy (for example, coal-fired power station or hydropower). Consequently energy should be measured in terms of primary energy - the energy required from nature (for example, coal) embodied in the energy consumed by the purchaser (for example, electricity). For every unit of electricity used in Australia, on average, approximately 3.4 units of primary energy such as coal are required (dis-cussed in Treloar, 1997). This ratio of 3.4 to 1 for electricity production, or simply 3.4, is termed the primary energy factor for electricity. Primary energy factors are proportional to energy related CO2 emissions. Therefore primary energy is a
more appropriate measure of the environmental implications of energy use than delivered energy.
FA Y, TRELOAR AND IYER-RANIGA
water systems are not comparable in delivered en-ergy terms, especially if coal is required to make the electricity (assuming otherwise equal perform-ance). Similarly, if competing building materials or systems are manufactured using different fuel sources, then a comparison in delivered energy terms is likely to be invalid.
Operational energy
Operational energy comprises the energy used for space heating and cooling, hot water heating, lighting, refrigeration, cooking and appliance and equipment operation. Space heating and cooling energy is often simulated using computer pro-grams such as CHENATH, TRANSYS, TEMPAL and DOE2. Many of these programs are difficult to use, due to their complexity. For further in-formation refer to Luther (1998).
Australian programs, such as VicHERS, designed for Victoria, a State of Australia, use the results of large numbers of results derived using a thermal simulation program to generate equations which are used in a more user-friendly 'front-end'. VicHERS allows numerous variations to a build-ing to be modelled rapidly, though they may be subject to errors when modelling unusual condi-tions. Programs such as the Australian NatHERS (incidentally, designed for Australia), on the other hand, interface directly to the simulation engine and are therefore more reliable for modelling non-standard conditions, such as highly efficient buildings. The CHENATH simulation engine within NatHERS (used for the case study in this paper) has a history of development, validation and modification. Its output remains," neverthe-less, a simulation of the thermal performance of the building since it is subject to numerous limit-ations, errors and potentially faulty assumptions. Furthermore, simulation programs are incapable of modelling complex human behaviour. Despite the limitations, computer simulations allow large numbers of variables to be modelled and their impact evaluated for buildings not yet con-structed.
Life-cycle energy analysis
The main benefit of LCEA is that the embodied energy costs of products, design modifications and strategies used to optimize operational energy can be evaluated. Life-cycle energy comprises the operational energy of the building and its initial
and recurrent embodied energy - over its ex-pected lifetime. Each has been described above. Life-cycle energy was calculated using the equa-tion:
LCE==EEi
+
(EErec+
OE) X building lifetimewhere:
LCE==the life-cycle energy;
EEi ==the initial embodied energy of building;
EErec==the annual recurrent embodied energy
(for example, in maintenance); and
OE ==the annual operational energy (including space conditioning and other domestic energy uses).
Since the life-cycle period used in this analysis varied, demolition energy was not included. In
any case, the energy required to demolish the building is generally considered to be very small compared to the rest of the life-cycle energy (Bek-ker, 1982). Furthermore, embodied energy savings from recycling or reusing demolished materials should be attributed to the next user, not to the demolished building (Tuckeret al., 1993).
The life-cycle energy implications of an energy saving strategy need to be considered in net terms. For example, the installation of additional insulation would have an embodied energy cost at the start of the life of the building. Assuming no replacements are required over time (i.e. that the insulation lasts well), the annual benefits in thermal performance that accrue can be modelled as savings in energy consumption of the heating and cooling system.Inreality, some of the benefits may be taken as improvements in comfort, for example, if there is no cooling system installed.
Case study
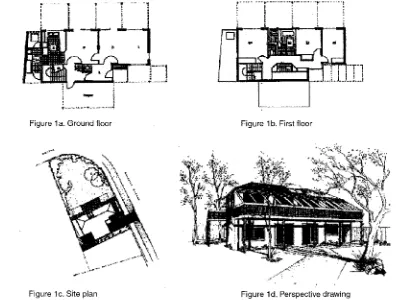
For simplicity and clarity, Life-Cycle Energy Analy-sis is demonstrated here for a residential project. The building analysed is the 'Green Home', a two-storey detached brick veneer house designed by Taylor Oppenheim Architects and built by Hoton-do Builders in Melbourne, Australia.
LIFE-CYCLE ENERGY ANAL YSIS OF BUILDINGS
hours (Szokolay, 1982). Space heating, therefore, is the dominant energy use. Approximately half of all dwelling operational energy use in Victoria is for space heating (Energy Victoria, 1994, see Appendix for climate details).
This project is the result of a Idesign and
con-struct' competition held in 1992 by the Victorian Department of Planning and Development, in conjunction with the Australian Conservation Foundation (see Fig. 1). The house was designed
it with a number of energy-saving features such as double glazing. However, inthis study the build-ing was modelled with conventional sbuild-ingle glaz-ing for the purpose of evaluating additional insulation as an energy efficiency feature in isola-tion. Consequently, the heating and energy simu-lation results can be expected to be greater than those of the house as built.
Embodied energy analysis method
A hybrid embodied energy analysis method was used (see Background), with product quantities calculated using process analysis (Le. analysing
the building materials required for the initial construction of the building) and material energy intensities' calculated using input-output analysis .. The material energy intensities were then multi-plied by the product quantities, and summed (see Table 1). Input-output analysis was also used to derive a figure for the direct energy of construc-tion (Treloar, 1997, 0.876 GJ
1m
2) . This ratio was factored into the calculations for the case study building (Table 1). The recurrent embodied en-ergy was simulated using replacement factors for many of the items in the building. They included - among others - paint (10 years), windows (50 years), plumbing and electrical systems (25 to 75 years), appliances (13 to 25 years) and roofing materials (25 to 50 years). Building lifetime was assumed to be 100 years. Since there is an inter-relationship between recurrent embodied energy and building lifetime, the results can be expected to differ as the durability of materials and the maintenance regimes adopted are varied.The analysis included all major appliances that may be fitted to a building prior to hand-over (e.g. stove, microwave oven, dishwasher, heater,
.,
.i
!
:-00:"",,,,
;
I
'~_""~{""''';''''•... .;._....'i"~......i
j
l' ; ...."'<""..>,,...~"".,,,•.,.,,', ...,,,,.,,,.J
[image:5.598.69.469.395.695.2]i""'-'"r
···1·-...
T-',-_.-..]
Figure 1a. Ground floor Figure 1b. First floor
.
'.'·:'·I~~l·1.J.· :.,•.... Ji1-.
";,~
Figure 1c. Site plan Figure 1d. Perspective draWing
FAY,TRELOAR AND IYER-RANIGA
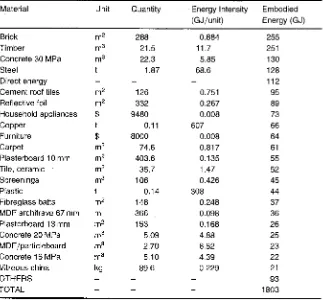
Table 1. Embodied energy calculation for house
Material Unit Quantity Energy Intensity Embodied (GJjunit) Energy (GJ)
Brick m2 288 0.884 255
Timber m3 21.5 11.7 251
Concrete 30 MPa m3 22.3 5.85 130
Steel 1.87 68.6 128
Direct energy 112
Cement roof tiles m2 126 0.751 95
Reflective foil m2 332 0.267 89
Household appliances $ 9480 0.008 73
Copper t 0.11 607 66
Furniture $ 8000 0.008 64
Carpet m2 74.6 0.817 61
Plasterboard 10 mm m2 403.6 0.135 55
Tiley ceramic m2 35.7 1.47 52
Screenings m3 106 0.426 45
Plastic t 0.14 308 44
Fibreglass batts m2 148 0.248 37
MDF architrave 67 mm m 366 0.098 36
Plasterboard 13 mm m2 153 0.168 26
Concrete 20 MPa m3 5.09 4.88 25
MDF /particleboard m3 2.70 8.52 23
Concrete 15 MPa m3 5.10 4.39 22
Vitreous china kg 89.6 0.229 21
OTHERS 93
TOTAL 1803
dish and clothes washing machines and clothes drier). Minor appliances, such as blenders and toasters, were not included. Furniture was in-cluded, but personal possessions, such as books, artworks, linen, cutlery, crockery and cooking im-plements, were excluded. A broader discussion of the life-cycle energy requirements associated with living (e.g. including belongings, cars, consum-ables, and vacations) is developed elsewhere (Treloar and Fay, 1998).
Operational energy analysis method
While some LCEA studies include only the ·heat-ing and cool·heat-ing energy, all household operational energy is included in this study (i.e. including 'non-thermal comfort' energy requirements such as the energy used for lighting, cooking, hot water, appliances and other power). The purpose of including non-thermal operational energy was to give a context to the relative importance of energy efficiency strategies such as adding more insulation. Heating and cooling energy require-ments were simulated using the computer pro-gram NatHERS. Non-space conditioning energy
requirements were derived by deducting typical figures for thermal energy requirements from figures for total operational energy requirements.
The U'-values of the various elements of the build-ing are listed below:
• Roof
==
1.56 WIm
2.K• Ceiling
==
0.44 WIm
2.K• Window
==
4.99 WIm
2.K• Wall
==
0.65 WIm
2.K• Floor
==
0.68 WIm
2.KRoof and ceiling U'-values are listed separately because the NatHERS program assumes the roof and ceiling belong to different zones.
LIFE-CYCLE ENERGY ANAL YSIS OF BUILDINGS
simulation, though not necessarily of "the house as built, included:
• living areas have north orientation;
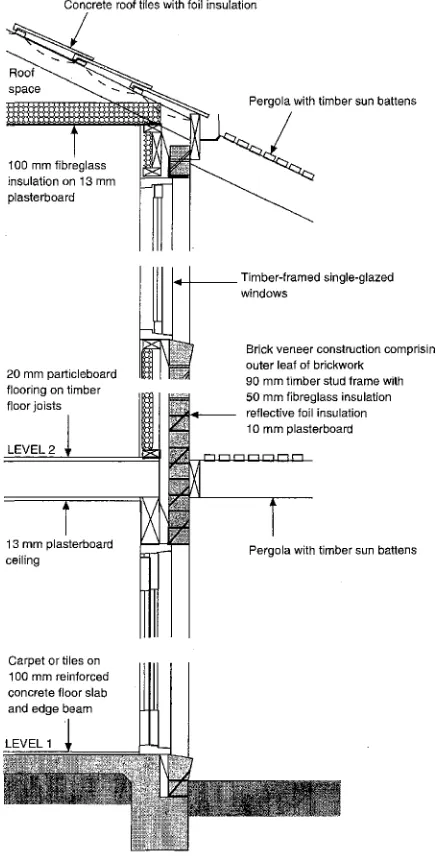
• construction comprises brick veneer external walls with stud framed internal walls, con-crete slab to the ground floor, suspended tim-ber first floor and tiled roof (see Fig. 2);
• walls have 50 mm of fibreglass insulation (i.e. a U-value of approximately 1 W
1m
2.K), ceil-ings have 100 mm of fibreglass insulation (i.e. a V-value of approximately 0.5 WIm
2.K ) and roof has foil insulation;• windows are single glazed and timber framed; and
• pergolas have timber shade battens protecting equatorial-facing windows (see Figs 1 and 2).
Heating was assumed to be delivered by a ducted gas-fired warm air system having an efficiency of 70% while the air conditioning system was as-sumed to have an efficiency of 290%.
A single variation to the base case, a higher level of insulation, was then modelled. Insulation was increased from the base case to R2.5 bulk insula-tion in the walls, Rl bulk insulainsula-tion and foil in the roof, and R4 bulk insulation in the ceiling.
[image:7.598.58.276.267.698.2]Concrete roof tiles with foil insulation
Fig. 2. Case study building - construction section (drawing: R. Fay).
Case study results
Only one energy efficiency measure, that of addi-tional insulation, was analysed in life-cycle terms. However, this demonstration shows how other energy efficiency and conservation strategies can be considered in life-cycle terms both in terms of
Life-cycle energy analysis method
Annual operational energy consumption was as-sumed to remain constant throughout the life cycle of the house. However, future trends are difficult to predict due to a combination of efficiency improvements (reductions in energy use), increased user comfort expectations (in-creases in energy use) and changes in energy pricing, legislation, behaviour, personal affluence and community attitudes to the environment (net increases or reductions in energy use). Various models were produced using a range of lifetimes to demonstrate their implications for the case study building.
The results for the embodied energy, operational energy and life-cycle energy are expressed as a square metre rate based on the habitable area of 128rrr',allowing comparison with other dwellings differing in size in this type of climate. The operational energy and embodied energy of the house were simulated for the Melbourne, Austra-lia climate using a number of assumptions regard-ing construction and operational use patterns. For this reason, the results of this study may not accord with either the design predictions or the actual performance. Furthermore, they may not apply to other climates or building styles or types. Pergola with timber sun battens
Brick veneer construction comprising outer leaf of brickwork
90 mm timber stud frame with 50 mm fibreglass insulation reflective foil insulation 10 mm plasterboard 1 4 - + - -Timber-framed single-glazed
windows
FA Y, TRELOAR AND IYER-RANIGA
the net benefits and the ·proportional improve-ment to the total life-cycle energy.
Embodied energy results
Embodied energy was calculated for the base case and then for a higher level of insulation (Table 2). Initial embodied energy for the house was calcu-lated to be 1803GJ (14.1GJ/m2 of floor area). This
value is considerably higher than many other embodied energy studies for houses (for example, see Pullen, 1995), where values around 5 GJ/m2 were reported). This is because the results re-ported here were derived in primary energy terms, with a wider system boundary than most previous studies, including such features as appli-ances, landscaping and other small items often neglected..
Due to recurrent embodied energy requirements, the total embodied energy for the house increased over time (Table 2). For example, for the base case, the effects of replacing items in the building in the first 25 years amounted to 2.6 GJ/m2 of floor area.
Included in the figures in Table 2 is the increasing life-cycle embodied energy for the building due to the addition of a higher level of insulation. The additional insulation increased the embodied en-ergy of the house initially from the base case by 1.1 GJ/m2 of floor area (i.e. this was not a recur-ring item). At this stage, the operational energy of the house is not included.
Operational energy results
The thermal energy result for the base case, in primary energy terms was calculated to be 38.2GJ/annum (i.e., ·0~30GJ/m2.a). This house is
relatively energy efficient, compared to an esti-mated average of approximately 53.6 GJ (i.e. 0.42 GJ/m2.a) - based on an assumed 40 GJ of
Table2. Life-cycle embodied energy for the house
delivered energy (Loder et al., 1993) and a weighted primary energy factor of 1.34 used to account for a 22% cooling load and typical equip-ment efficiencies. The thermal energy result for the variation to the base case with the added insulation was 0.21 GJ/m2.a, representing a 30% reduction over the base case. As noted, the 'Green Home', as modelled, is already a relatively effi-cient building in thermal terms. Thus this 30% improvement in heating and cooling energy effi-ciency is likely to be less than the improvement in thermal energy that would accompany the instal-lation of insuinstal-lation in a conventional home.
Non-thermal energy requirements were based on estimates for household energy use. It was as-sumed that the average new home in Victoria con-sumes 80 GJ of delivered energy (Anon., 1993) and that non-thermal energy comprises 50% of to-tal energy use (for typical,· not energy efficient houses, Energy Victoria, 1994). This 40 GJ of non-thermal delivered energy represents approxi-mately 96GJ of primary energy (i.e. 0.75 GJ/m2) ,
assuming an average primary energy factor of 2.4 for an even mix of electrical and gas use.
Life-cycle energy results
Life-cycle energy analyses over lifetimes of 0, 25, 50, 75 and 100 years were carried out for the base case and then with added insulation. Table 3 demonstrates that the total life-cycle energy re-duced only marginally due to the addition of insulation to the base case. Over 25 years, the improvement was only 2.7%
, increasing to 5.6%
over 100 years. However, other factors are con-tributihg to this comparison, such as increases in embodied energy due to replaced items. It is important to know the context for the relatively small improvement, because this might suggest that other strategies may reap more benefits, perhaps with lower initial embodied energy and financial costs.
NB Increase each period is due to maintenance of elements not related to buildinq insulation, hence the equal difference in each case of 1.1 GJjm2 .
Age of house (years)
o
25 50 75 100
Base case (GJjm2)
14.1 16.7 23.5 30.0 35.4
With additional insulation (GJjm2)
15.2 17.8 24.6 31.1 36.5
Table3. Life-cycle energy for the house as
con-structed
Age of house Base case Plus added insulation (years) (GJjm2) (GJjm2
)
0 14.1 15.2
25 43.0 44.1
50 76.0 72.6
75 108.8 103.1
LIFE-CYCLE ENERGY ANAL YSIS OF BUILDINGS
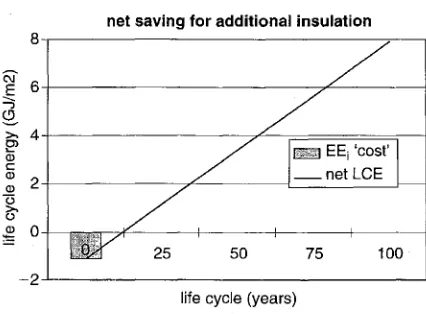
To aid decision-making regarding the additional insulation, it is more helpful to perform a life-cycle energy 'cost/benefit' analysis (Fig. 3). In this chart, the initial embodied energy required for the additional insulation (i.e. 1.1 GI/m2) is paid back
by net savings in heating and cooling energy(i.e, 0.09 GJ/m2/annum) in 12.2 years.In 25 years, the
net benefit represents 105% of the initial embo-died energy 'cost' of the additional insulation. However, over100 years the likely physical life of the house, if well maintained, the net benefit represents 718% of the initial embodied energy 'cost' of the additional insulation.
Discussion
Even considering that the overall net life-cycle saving due to the additional insulation was less than 6%
of the total calculated for the case study building, the life-cycle energy cost/benefit analy-sis suggests that if saving energy (and the asso-ciated environmental impacts) in the long term is a priority, then additional levels of insulation may well be justified. However, other issues come into play in this decision, including:
• the assumption that the insulation will last a long time at peak performance
• whether renewable energy generation devices will be fitted (Le. changing the type of bene-fits of energy efficiency measures from energy savings to system size reductions)
• the additional financial cost of the insulation, and whether that is paid back over time
• other implications for construction and envir-onmental impacts associated with using addi-tional insulation
The broad life-cycle energy results given in Table 3 suggest that other energy efficiency and conser-vation strategies may be more effective than in-creased insulation, for example:
• high performance windows (for example, double glazing)
• high mass (for example, low embodied en-ergy but massive materials)
• reduced infiltration losses (for example, an air-to-air heat exchanger in conjunction with tighter, less leaky, construction)
• wider thermostat settings and shorter heating times
• renewable energy generation facilities
• correctly sized windows oriented appropri-ately
Conelusions
In summary, while the additional insulation im-proved the life-cycle energy of the case study building by only a small amount, the decision was found to be worthwhile in net terms.
The LCEA method demonstrated here provides a framework for decision-making relating to energy efficiency strategies. It can provide information on:
[image:9.601.63.276.531.688.2]- 2 - - ' - - - ' life cycle (years)
Fig. 3. Life-cycle energy (LCE) cost/benefit for
addi-tional insulation, comprising initial embodied energy 'cost' (EEj ) and net life cycle energy saving (net LCE).
• achieving a balance between embodied en-ergy and operational enen-ergy over the antici-patedIifetime of buildings (for example, how much insulation)
• the energy related environmental impacts of demolishing, replacing or refurbishing a buil-ding at various stages in its life
• other design strategies to reduce energy re-lated environmental impacts
Other conclusions derived from LCEA research as described in this paper are:
• embodied energy is significant relative to op-erational energy
• as operational energy becomes lower (through efficiency improvements/lifestyle
100 75
50 25
net saving for additional insulation 8
@'
6
.§
J
~
>. 4
0>
05
c
(]) 2 (])
C3 >. o
FA Y, TRELOAR AND IYER-RANIGA
changes), embodied energy becomes even more significant
• while a net zero operational energy building is now achievable, a zero life-cycle energy building is likely to be more difficult
Energy is part of the broader sustainability pro-blem, which also includes resource depletion, pollution from manufacturing and transportation, together with social and economic inequities. However, energy is currently an important para-meter to optimize because of its national and global significance in gross terms. By widening the system boundary of the problem, counter-intuitive opportunities for the development of energy conservation and environmental impact strategies can be identified.
Furthermore, in general environmental terms the relatively high importance of the initial embodied energy of a building in a temperate climate, as in-dicated here, may suggest that new construction is not always the best solution. Renovation of an existing building may offer considerable embo-died energy and financial savings, with the oppor-tunity to provide equal amenity and perhaps improved efficiency. For new buildings, design flaws such as redundant structure, inefficient planning and circulation, and ineffective shading devices and similar features present opportunities for developing optimization strategies. Other op-portunities include substituting low energy inten-sity materials for high energy inteninten-sity materials, reducing construction waste, reusing products, using products with a high recycled content and designing for adaptability and deconstruction. Of course, further research is required to determine the potential benefits of such strategies in specific circumstances.
Acknowledgments
The authors wish to express their thanks to David Oppenheim of Taylor Oppenheim Architects and Michael Renwick of Hotondo Builders for allow-ing the 'Green Home' to be used as a case study. The authors would like to acknowledge the valu-able comments made by the anonymous re-viewers on an earlier version of this manuscript.
References
Anon. (1993) CSR Bradford Energy Conquest Design Awards. The Architecture Show (TAS), June/July, pp.
32-35.
Energy Victoria (1994) Energy Efficient Housing Manual:
Design Guidelines and Case Studies, Renewable
Energy Authority Victoria, East Melbourne.
Bekker, P.C.F. (1982) A life-cycle approach in building.
Building and Environment,17(1), 55-61.
Boustead, I. and G.F. Hancock (1979) Handbook of Industrial Energy Analysis, Ellis Horwood Limited,
Chichester.
Bullard, C.W., Penner, P.S. and Pileti, D.A. (1978) Net energy analysis - handbook for combining process and 1-0 analysis.Resources and Energy,1,267-313.
England, R.W. and Casler, S.D.(1995)Fossil fuel use and sustainable development: evidence from U.S. input-output data,1972-1985. Advances in the Economics of
Energyand Resources,9,21-44.
Hakkinen, T. (1994)Environmental Impact of Building Ma-terials, Technical Research Centre of Finland (VTT),
Report No.1590,Espoo, p.38.
Lave, L.B., Cobas-Flores, E., Hendrickson, C.T. and McMichael, F.e. (1995) Using 1-0 analysis to esti-mate economy-wide discharges. Environmental
Science and Technology,29,420-26.
Lawson, B., Partridge, H. and Gelder, J.(1995)Assessing the environmental impact of building materials.
PRO 1. RAJA Environment Design Guide Redhill,
Australia.
Loder and Bayly, R.J. N arrin & Partners Pty Ltd, Sus-tainable Solutions Pty Ltd and PPK Consultants Pty Ltd (1993) Greenhouse Neighbourhood Project - A
Technical Report, Department of Planning and
Development, Melbourne.
Luther, M. (1998) An Introduction to Building Energy Performance Software. DES 21. The RAIA Environ-ment Design Guide Redhill, Australia.
Pears, A.(1997)Greenhouse Gas Emissions and the Resi-dential Sector. GEN 13. RAIA Environment Design Guide.
Pullen, S.(1995)Embodied Energy of Building Materials in Houses. Masters thesis, University of Adelaide, Adelaide,p. 227.
Szokolay, S.V.(1988) Climate Data and its Use in Design,
RAIA Education Division, Canberra, p. 3.1.
Treloar, G. and Fay, R. (1998) Embodied Energy of Living. GEN 20.RAIA Environment Design Guide.
Treloar, G.J. (1997) Extracting embodied energy paths from input-output tables: towards an input-output based hybrid energy analysis method. Economic
Systems Research,9(4), 375-91.
Tucker, S.N., Salomonsson, G.D., et al.(1993)The Envir-onmental Impact of Energy Embodied in Construction,
LIFE-CYCLE ENERGY ANAL YBIS OF BUILDINGS
Appendix: Climate information for Melbourne, Australia
Latitude: 37°49' S; Longitude: 144°58' E; Altitude: 35m; Location: south-eastern coast Mean daily sunshine hours: 5.7 average (3.4 June-8.1 Jan)
Mean daily cloud cover hours: 5.9average (5.0Feb-6.6 June)
Mean daily solar irradiation (Wh/m2) :3973 average (6546 Jan-1620 Jun)
Relative humidity 0900:680/0 average(56Jan-81 Jul) Relative humidity 1500: 52% average (43 Jan-62 Jul) Mean wind speed (km/h): 12.3
Maximum wind gust (kmjh): 119
Mean temperature (DBT °C): 15.2 (9.9 Jul-20.?Jan)
Mean maximum temperature (DBT °C): 19.9 (13.5 Jul-26.5 Jan) Mean minimum temperature(DBT °C): 10.5 (6.2 JuI-15.3 Feb) Frost days: 10 (4 [ul, 2 [un, 2 Aug, 1 May, 1 Sep)
Heating degree hours: 41 345 (1252 Feb-6082 Jul)
Cooling degree hours: 1343 (54 Dec, 828 Jan, 435Feb, 26 Mar) Solar excess degree hours: 8401 (2964 Dec, 3011 Jan, 2476 Feb) Average diurnal temperature range (OK): 9.4
Average mean temperature range (OK): 20.3
Recommended design conditions: summer (DBT °C): 34.5 Recommended design conditions: summer(WBT °C): 21.0 Recommended design conditions: winter (DBT °C): 4.5 Maximum rainfall intensity (mm), 10 minutes: 23 Maximum rainfall intensity (mm), 1 hour: 47 Thermal neutrality (DBT °C): 20.9-23.8
Qualitative comments: A temperate climate, but due to its exposure to the anti-cyclone belt, it is highly variable even within the span of a few days. Summer temperatures often exceed 40°C. In winter freezing is not uncommon. Precipitation is moderate and evenly distributed. Fog occurs some 20 days per year and the annual number of clear days is less than 50.
Two typical days: hourly temperatures (OC); direct and diffuse horizontal radiation (W
1m
2)Summer (Feb)
18.7 18.3 17.9 17.6 17.4 17.3 18.4 19.3 20.4 21.7 22.9 23.9 24.3 24.8 24.9 24.6 24.2 23.5 22.5 21.8 21.0 20.3 19.6 19.1
0 0 0 0
a
2 59 153 252 340 403 459 479 448 393 321 217 112 26 1a
a
0 00 0 0 0 0 7 39 95 152 207 257 279 281 266 227 173 117 61 15 0 0 0 0
a
Winter (July)
9.0 8.7 8.5 8.3 8.2 8.0 8.2 8.4 8.6 9.8 11.0 12.2 12.5 12.8 13.1 12.6 12.1 11.7 11.2 10.7 10.3 9.9 9.6 9.2
0 0 0 0 0 0 0 4 38 75 114 129 123 '112 81 51 18 1
a
0 0 0 0a
0 0 0 0 0 0