RESTING STATE EEG CURRENT SOURCE DENSITY OF NEURAL
OSCILLATION: A COMPARISON BETWEEN SCHIZOPHRENIA PATIENTS AND HEALTHY CONTROLS
NURMAZILA BINTI SUHAMEY
This Report is submitted in Partial Fulfilment of Requirement for Award of
Bachelor of Electronic Engineering (Industrial Electronics) With Honours
Faculty of Electronics and Computer Engineering
Universiti Teknikal Malaysia Melaka
©
Universiti Teknikal Malaysia Melaka ...ii
UNIVERSTI TEKJ o/IKAL MALA YSlA MELAKA
?'AKULTl KEJURUTERAAN ELEKTRONIK DAN KEJURUTERAAN KOMPUTER
BOM:'l'G PE:'l'GESAHAN ST.nrs LA PORA:'\'
PROJEK SARJANA MUDA II
Taju k Projek !.-!...! .. ....' .t:- ·!1.'. .. ;'':\. .·'·'·.'.. ....e. .. .... !':- !'.'...
Sesi Pengajia n
Saya .... •.: !1•• .' •• • '. .!1 .'!. .... ...
(HURUF BESAR)
mengaku membenarkan Laporan Projek Sarjana Muda ini disimpan di Perpustakaan dengan syarat-syarat kegunaan seperti beriku1:
1. Laporan adalah hakmil ik Uni,·ersiti Teknikal Malaysia Melaka.
2. Perpusrakaan dibenarkan membuat salinan untuk tujuan pengajian sahaja.
3. Perpustakaan d ibenarkan membuat salinan laporan ini sebagai bahan pertukaran antara insti1usi
pengjian tinggi.
. Sila tandakan ( '1 ) :
SllLIT* *(Mengandungi makluma1 yang berdarjah keselamatan atau
kepentingau JV!alaysia seperti yang 1cn11ak1U b di dalam
AKTA RAHSIA RASMIl972)
TERH.-\D** **(Mengandungi maklumat terhad yang telah ditentukan oleh organisasi/badan di mana penyelidikan dijalankan)
D
TIO.-\h: TERHAD1TAt<DATANGAN PENULIS)
Disahkan,.o,leh:
I
/ !LA./ c_
t /
(COP DAN TA 9f)
Tdtikh: ...
.
>./.!:
.
.
.
.
.
.
.
.
...
.
.
D
3
©
Universiti Teknikal Malaysia Melaka'·Saya aku i laporan ini adalah hasil kerja saya send iri kecuali ringkasan dan petikan yang tiap-tiap satunya saya jela skan sumbernya..
Tandatangan . ...I.J./>...;..; ...
\lama penulis : N U RMAZlLA BTNT! SUHAMEY
4
©
Universiti Teknikal Malaysia Melaka··Saya/kami akui bahawa saya telah membaca karya ini pada pandangan saya/kami
karya ini ada lah memadai dari skop dan kualiti untuk tqjuan penganugerahan ljazah
Sarjana Muda Kejuruteraan Elektroni k (Elektronik Industri):·
1r-Tandatangan . ...
Nama Penyel ia : MJ SS FARA H SHA HNAZ BINTI FEROZ
5
DEDICATION
6
ACKNOWLEDGEMENT
“In the name of Allah, the most Gracious, most powerful, and the most Merciful”
Firstly, praise to Allah SWT for guiding and blessing with perseverance and
strength to complete the project. Without the strength gave to me from the God, this
project report can’t be finish within the time provided. First of all, I would like to
express my biggest appreciation to my beloved Project Supervisor; Miss Farah
Shahnaz Binti Feroz for all her precious supports and advices during completing this
project report. Furthermore, she guides me consistently and gives full dedication
throughout the semester. This appreciation also for all his precious time, knowledge
and advises during completing this project report.
I also would like to thank my beloved family especially my father and my
mother for giving me the truly support and motivation to finish this project report. I
am very appreciating of their understanding towards my commitment to finish the
PSM report. Bundle of thanks to all my friend especially to those who gave me the
precious help and support in completing this project. Last but not least, I would like
to thanks all the people who have involve directly and indirectly to give contribution
to complete the PSM. Not forget to Universiti Teknikal Malaysia Melaka (UTeM) fot
the opportunity given. I pray to Allah SWT may He bless all of you.
vii
ABSTRACT
The aim of our study was to detect changes in the distribution of electrical
brain activity in schizophrenia patients compared to healthy controls. 15 patients
with Schizophrenia (nine males; mean age ± standard deviation, 32.00 ± 9.38) and 15
matched healthy controls (nine males; mean age ± standard deviation, 32.65 ± 9.78
years) provided written informed consent and were enrolled in this study. Continuous
EEG activity was recorded using Ag/AgCl electrodes mounted in a 64 channel
actiCAP system (Brain Products, Munich, Germany). The frequency band that
involves is delta (1.5-6 Hz), theta (6-8 Hz), alpha (8-12 Hz), and beta (12-30Hz). The
objective of this project is to determine the EEG oscillation (frequency bands) that is
significantly different between patients and healthy control and to determine the
brain region that is responsible for the differences. Firstly, pre - processing will be
done by filtering, down sampling, manual artifact detection to remove muscle artifact
and artifact detection - using independent component analysis (ICA) to remove eye -
blink and heartbeat, re-referencing and baseline correction. Next, the pre-processed
data will be analyzed using Loreta software. Then, the oscillatory analysis will be
conducted to determine the EEG oscillations (frequency bands) that are significantly
different between patients and healthy controls. The results is show by comparing a
schizophrenia patients and healthy controls, it was found a trend towards significant
current density increase in the delta, theta, alpha, and beta frequency band. Lastly,
the brain regions that are responsible for the differences at alpha and beta are
8
ABSTRAK
Tujuan eksperimen ini dijalankan ialah untuk mengkaji perubahan aktiviti
otak yang terdapat pada pesakit Schizophrenia berbanding dengan orang yang tidak
mempunyai penyakit ini. 15 pesakit Schizophrenia (sembilan lelaki; min umur ±
sisihan piawai, 32.00 ± 9.38) dan 15 orang tanpa penyakit (sembilan lelaki; min
umur ± sisihan piawai, 32.65 ± 9.78 tahun) telah diuji dan direkod dengan
menggunakan EEG dengan kebenaran syarat bertulis. EEG direkod dengan
menggunakan elektrod Ag / AgCl dipasang dalam sistem actiCAP 64 saluran (Brain
Products, Munich, Jerman). Julat frekuensi yang terlibah adalah delta (1,5-6 Hz),
theta (6-8 Hz), alpha (8-12 Hz), dan beta (12-30Hz). Objektif projek ini adalah untuk
mencari perbezaan antara pesakit berbanding dengan orang sihat dan mencari
bahagian otak yang menyebabkan perbezaan antara mereka. Projek ini menggunakan
2 perisian iaitu EEGLAB dan juga Loreta. EEGLAB digunakan untuk memproses
data bagi mendapatkan data yang bersih and Loreta digunakan untuk analisa data
untuk mencari bahagian otak yang menyebabkan perbezaan antara pesakit dengan
orang sihat. Selepas eksperimen dijalankan, ia menunjukkan kawasan otak yang
bertanggungjawab bagi perbezaan di alpha dan beta iaitu bahagian otak gyrus
9
TABLE OF CONTENT
CHAPTER TITLE PAGE
PROJECT TITLE i
DECLARATION iii
DEDICATION v
ACKNOWLEDGEMENT vi
ABSTRACT vii
ABSTRAK viii
CONTENT ix
LIST OF TABLES xi
LIST OF FIGURES xii
I INTRODUCTION 1
Project Background 1
Objectives and Scopes of Project 2
Problem Statement 3
System Operation 4
Organization of thesis 5
II LITERATURE REVIEW 6
Resting State Electroencephalogram (EEG) 6
Current Source Density 9
Neural Oscillation 10
Schizophrenia Patients 10
Brain region 10
1
III METHODOLOGY 23
EEG Recording 23
EEG Pre-Processing 23
Artifact Removal from EEG Recording 28
Loreta software 32
Project Implementation 38
Sustainability of the Project 40
IV RESULTS AND DISCUSSION 41
Results 42
Achievement for the Project 42
Software development 42
Threshold Voltage 46
Oscillatory Activity in Specific Frequency 47 Band
Oscillatory activity for Schizophrenia 51 Patients
Oscillatory activity for Healthy Control 53
Discussion 56
V CONCLUSION 57
Conclusion 57
Commercialization 59
1
LIST OF TABLES
NO TITLE PAGE
2.1 Literature Review from Previous Study 14
xii
LIST OF FIGURE
NO TITLE PAGE
1.1 Overall Block Diagram of the project 5
The first EEG recorded by Hans Berger, circa 1928 8
Brain Region 11
Limbic lobe 11
Parts of the human brain 11
Filter the data (high or low pass filter) 24
Re-reference the data 25
Adding Cz back to the data 26
New reference channel 26
Re-ference Cz channel 27
Matlab command for epoch 27
Matlab command for generate epoch folder 28
Eye blink 28
Components for rejection 29
Components for rejection 30
Eye-blink topography 30
Eye movement 31
Muscle activity 31
Muscle artefact 32
Compute EEG to cross spectra file 34
13
sLORETA 35
None Data Normalization 36
Independent group, test A=B 36
None baseline correction 36
Drag and Drop slor file for schizophrenia patients and 37
healthy controls
All tests for all time frames/frequencies 37
Statistics analysis 37
Perform test 38
Viewing the statistics results 38
Flowchart 39
Overall flowchart for the step pre-processing data 44
EEG data after rejection for subject 1 45
Overall flowchart of oscillatory analysis using Loreta 46
Oscillatory activity at delta frequency band for threshold 47
value = 0.636
Oscillatory activity at delta frequency band for threshold 48
value = 0.205
Oscillatory activity at theta frequency band for threshold 49
value = 0.636
Oscillatory activity at theta frequency band for threshold 49
value = 0.119
Oscillatory activity at alpha frequency band for threshold 50
value = 0.468
Oscillatory activity at beta frequency band for threshold 51
value = 0.467
14
schizophrenia patients
Oscillatory activity at beta frequency band for 53
schizophrenia patients
Oscillatory activity at alpha frequency band for healthy 54
Control
Oscillatory activity at beta frequency band for healthy 55
CHAPTER 1
INTRODCUTION
Chapter 1 covers about the introduction part of this Final Year Project of Degree.
This chapter will discuss about the project background, objectives of project, scope of
project, problem statement, system operation, and organization of thesis.
Project Background
REST is Random Episodic Spontaneous Thoughts. EEG is recorded during, eye
closed and awake. For this project, it will focus during eye closed only. Resting state is
wakeful rest, mind-wandering, spontaneous thoughts, daydreaming, retrieving
2
and external input. It is not same with inactive brain. Electroencephalography (EEG) is a
medical imaging technique that reads scalp electrical activity generated by brain
structures.
Neural oscillation coordinate activity across brain areas. This process is found to
be perturbed in patients with psychiatric disorder. By using pre - recorded Resting -
State EEG, the abnormal patterns of oscillations and the brain regions involved in
patients in comparison to healthy controls can be determined. Thus far, we have 15 EEG
resting state recordings for patients and 15 for healthy controls. Firstly, pre - processing
will be done by filtering, down sampling, manual artifact detection to remove muscle
artifact and artifact detection - using independent component analysis (ICA) to remove
eye - blink and heartbeat, re-referencing and baseline correction.
Next, the pre-processed data will be analyzed using Loreta software. Finally, the
oscillatory analysis will be conducted to determine the EEG oscillations (frequency
bands) that are significantly different between patients and healthy controls. The
frequency band that involves is delta (1.5-6 Hz), theta (6-8 Hz), alpha (8-12 Hz), and
beta (12-30Hz).
Objectives and Scopes of Project
This part will discuss about the objectives of the project and the scope of work
regarding this project.
Project Objectives
This project is carried out on the following objectives:
i. To identify and remove EEG data artifacts (ocular, muscle noise, cardiac,
3
ii. To compare oscillatory activity in specific frequency bands (delta, theta,
alpha, beta) between patients with Schizophrenia and healthy controls.
iii. To determine the EEG oscillations (frequency bands) that is significantly
different between patients and healthy controls.
iv. To determine the brain regions that is responsible for the difference in
Schizophrenia patients and healthy control.
Scope of Project
This project concentrates on determining the EEG oscillation that is significantly
different between schizophrenia patients and healthy control. Then continue with
determining the brain region that is responsible for the differences. The software that
was used to complete this project is Eeglab, Matlab, and Loreta.
By using the pre-recorded resting-state EEG, EEG data artifact can be identified
and removed using ICA method. For the project limitation it only determines the EEG
oscillation that is significantly different between patients and healthy control. Then, the
brain region also can be determined between patients and healthy control. The functional
connectivity is not covered for this project.
Problem statements
Neural oscillations coordinate activity across brain areas. This process is found
to be perturbed in patients with psychiatric disorders. Next, previous studies show
inconsistencies of reported findings regarding neural oscillations and the brain regions
involved in patients with Schizophrenia.
From the first paper, it state that schizophrenia patient was characterized by
4
negative symptoms which are larger third ventricles, larger frontal horns of the lateral
ventricles, increased cortical sulci width, and greater ocular motor dysfunction.[1]
Next, the other paper state that low frequency including delta, theta, slow alpha
and slow beta were abnormal in schizophrenia. Low frequency abnormality (delta and
theta) may be associated with generic variants of catechol-O-methyltransferase in
schizophrenia.[3]
Hence, in this study the disturbed oscillations and the brain region will be
investigated in patients with Schizophrenia.
System Operation
This project concentrates on determining the EEG oscillation that is significantly
different between schizophrenia patients and healthy control. Then continue with
determining the brain region that is responsible for the differences. The software that
was used to complete this project is Eeglab, Matlab, and Loreta.
Study about the resting state and EEG is a part of the literature review in order to
understand more about this project. The other literature review is about previous studies
regarding neural oscillations and the brain regions involved in patients with
Schizophrenia.
By using the pre-recorded resting-state EEG, EEG data artifact can be identified
and removed using ICA method. For the project limitation it only determines the EEG
oscillation that is significantly different between patients and healthy control. Then, the
brain region also can be determined between patients and healthy control. The functional
connectivity is not covered for this project.
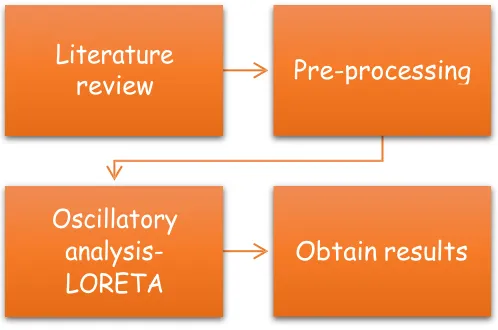
The software that will be used for pre-processing EEG data (including ICA) is
5
artifact rejection, re-referencing, baseline correction and segmentation. Lastly,
[image:20.612.203.452.125.290.2]oscillatory analysis will be conducted with Loreta software.
Figure 1.1 Overall Block Diagram of the project
Organization of thesis
The report consists of five chapters which is Chapter 1 will discusses about the
introduction of the project which includes the objectives of the project, scope of the
project, problem statements, and system operations.
In the second chapter, it narrates the literature review regarding the project,
which including substantive findings.
The next chapter 3 discusses about the methodology and approach that has been
taken on how the project is done. It also discussed about software development that has
been applied in this project.
Then, chapter four will discuss more on the results and analysis of this project.
Last chapter which is chapter five consists of conclusion, some improvements
and recommendation for future work related to this project.
Literature
review Pre-processing
Oscillatory analysis-
CHAPTER II
LITERATURE REVIEW
A literature review is a text of a scholarly paper, which includes the current
knowledge, including substantive findings, as well as theoretical and methodological
contributions to this project. This chapter review of articles, books and journals to
understand about the concept that needs to know in order to complete this project.
Resting State Electroencephalogram (EEG)
EEG is recoded in the resting state position. 15 patients with Schizophrenia (nine
males; mean age ± standard deviation, 32.00 ± 9.38) and 15 matched healthy controls
7
informed consent and were enrolled in this study. 15 patients with Schizophrenia and 15
healthy controls (HC) were included in the study. Patients who met the DSM-IV criteria
for SZ were recruited through the Psychosis Center of the Department of Psychiatry of
the University Medical Center Hamburg-Eppendorf. HC were recruited via the internet
and word-of-mouth from Hamburg and its surrounding area.
Exclusion criteria for all participants were current substance abuse or
dependence, presence of major somatic or neurological disorders. For HC, additional
exclusion criteria were any previous psychiatric disorder or treatment. Handedness was
assessed with the German version of the Edinburgh Handedness Manual (Oldfield,
1971).
Resting State
Resting state is wakeful rest, mind-wandering, spontaneous thoughts,
daydreaming, retrieving memories, stimulus independent thought, and absence of goal-
directed neuronal action and external input.
Electroencephalogram (EEG)
An electroencephalogram (EEG) is a medical imaging technique that reads scalp
electrical activity generated by brain structures. It was used to sense different related to
electrical activity of the brain. EEF can track and record the brain wave pattern. The
most important uses of EEG are to diagnose and monitor seizure disorder. It will help to
identify the causes of the other disorders such as seizure disorder, brain tumor, head
injury, encephalopathy, encephalitis, sleep disorder, stroke, and dementia. For this
8
EEG may be used for various applications such as in neuromarketing, human
factor, social interaction, psychology, neuroscience, clinical and psychiatric studies. In
neuromarketing EEG is used for detect the brain processes that drive consumer
decisions, brain areas that are active when we purchase a product/service, and mental
states that the respective person is in when exploring physical or virtual stores. Next, for
human factor EEG is used to identify brain processes related to specific personality traits
such as intro-/extroversion or social anxiety and brain processes reflecting cognitive and
attentional states during human-machine-interaction.
The History of the Electroencephalogram (EEG)
In 1929, a German psychiatrist named Hans Berger, who worked in the city of
Jena, announced to the world that it was possible to record the feeble electric currents
generated on the brain, without opening the skull, and to depict them graphically onto a
strip of paper. Berger named this new form of recording as
the electroencephalogram (EEG).
Figure 2.1: The first EEG recorded by Hans Berger, circa 1928.
Berger electrodes were too large to made detailed topographycal studies of the
EEG. This was left to W. Gray Walter, a remarkable British scientist, who, in 1936,
proved that, by using a larger number of electrodes pasted to the scalp, each one having
a small size, it was possible to identify abnormal electrical activity in the brain areas
around a tumor, and diminished activity inside it.
Impressed with the possibilities of building bidimensional maps of the EEG
9
This was a remarkably complex device and showed Grey Walter's inventiveness
(besides being a physician, he was also an engineer). It had 22 cathode ray tubes (similar
to a TV tube), each of them connected to a pair of electrodes attached to the skull. The
electrodes (and their corresponding tubes) were arranged in a bidimensional geometrical
array, such as that each tube was able to depict the intensity of the several rhythms
which compose the EEG in a particular area of the brain (the frontal, parietal and
occipital lobes). This array of CRT tubes, were photographed face up, so that a kind of
phosphorescent spiral display showed simultaneously which kind of rhythm was present
in a particular part of the brain.
Gray Walter asked his subjects to perform several mental tasks, with the result
that the EEG rhythms were altered in different ways, times and parts of the brain. He
was the first to prove, for instance, that the so-called alpha rhythm (present during a
resting state) disappears from almost all the brain during a mental task which demands
awareness, being substituted by a faster rhythm, the beta waves.
The topographic study of brain electrical activity was born again only when fast
desktop computers became available in the 80s. Thus, EEG brain topography was
developed and is widely in use today. It is also called Color Brain Mapping.
Current Source Density
Current source density is class of methods of analysis of extracellular electric
potentials recorded at multiple sites leading to estimates of current sources generating