www.esri.ie
Working Paper No. 312
September 2009
Did the Celtic Tiger Decrease Socio-Economic
Differentials in Perinatal Mortality in Ireland?
Richard Layte and Barbara Clyne
Abstract: Irish perinatal mortality rates have been falling steadily for a number of decades but evidence from the 1980s showed pronounced differentials in mortality rates across socio-economic groups. Between 1995 and 2007 Irish gross national product increased from 60 per cent of the EU average to 110 per cent. Real incomes increased across the income distribution during this period but income inequality between the top and bottom income deciles increased. This paper examines whether this increase in affluence led to an overall improvement in Irish perinatal mortality rates and the extent to which any improvement was shared across socio-economic groups. This task is complicated by demographic change in Ireland since the 1980s and its interaction with the birth registration process. Overall perinatal mortality rates have fallen from 14 per 1,000 in 1984 to 7 per 1,000 in 2006. Without adjusting for demographic change differentials between professional and unskilled/unemployed groups have decreased from 1.99 to 1.79. Adjusted estimates suggest the real differential has decreased to 1.88.
Corresponding Author: [email protected]
Did the Celtic Tiger Decrease Socio-Economic Differentials
in Perinatal Mortality in Ireland?
I INTRODUCTION
Perinatal outcomes, particularly perinatal mortality1, are often used as measures of the
health of a nation as they are associated with a number of factors such as maternal health, quality and access to medical care and public health practices. Infant and child mortality rates fell significantly in developed countries during the second half of the 20th Century but within these nations pronounced inequalities in perinatal mortality remain between different socio-economic groups (Antonovsky and Bernstein 1977; Leon et al 1992; Pensola and Valkonen 2000). Research in the Irish context has also reported differentials. Based on data from the late 1980’s, Nolan and Magee (1994) estimated that unskilled manual socio-economic group (SEG) in Ireland had almost double the risk of perinatal mortality of professional and intermediate non-manual groups. At the time the data were collected Irish gross national product (GNP2) was less than 60 per cent of the European average. Following a period of intense economic growth in the 1990s Irish GNP rose to over 110 per cent of the European average by 2006. Ireland was clearly a more affluent country in the latter period but had the earlier social socio-economic differentials in perinatal mortality lessened with economic growth? The relationship between income and infant mortality is very much debated. Several papers have presented evidence of a strong causal relationship between income and infant mortality (Pritchett and Summers 1996; Baird et al 2007) but this has been disputed by others such as Jamison et al (2004) and Deaton (2006) who argue that the relationship found actually reflects variables omitted from the analysis such as the quality of medical and social care services and level of female education. Whatever the cause of the relationship between income and infant mortality at the level of the state, there is a large amount of evidence that there are
1 Perinatal mortality refers to all stillbirths and early neonatal deaths (deaths within the first week of life)
and the perinatal mortality rate is the number of perinatal deaths relative to the total number of births.
2 GNP is used rather than GDP as Ireland has a particularly large proportion of domestic income
significant socio-economic differentials in infant mortality in richer countries (Leon et al 1992). However, research does suggest that whatever the overall level of income, higher income inequality within a society is associated with higher infant mortality (Waldman 1992; Wilkinson 1996; Marmot 2004).
[image:3.595.106.489.402.622.2]Analysis of household income data from Ireland for the period from 1987 to 2005 shows that overall household income rose by 349 per cent over the period with the incomes of the lowest income group rising by 343 per cent. Given that prices increased by 68 per cent over the same period this would suggest that real incomes rose significantly for all groups3. Figure 1 shows that income inequality between the bottom and top of the income distribution rose somewhat over the period (indicated by the increasing p90/p10 ratio4) with the increase largely occurring before the period of growth in the 1990s. Inequality between the top and middle of the distribution actually decreased (the decreasing p90/p50) over the period of the boom.
Figure 1: Income Inequality in Ireland 1987-2005
0 0.5 1 1.5 2 2.5 3 3.5 4 4.5
1987 1994 2001 2005
Year
Ra
ti
o p90/p10
p90/p50 p75/p25
3 Layte et al (2004) show that the incomes of social welfare recipients rose significantly in real terms over
the same period also, albeit at a slower pace than incomes from employment.
4 This is the ratio of the median income of the top 10 per cent of household incomes to the median of the
So Ireland experienced both income growth across the total population and some increase in income inequality over the period from the late 1980s to the mid-2000s between the top and bottom of the income distribution but changes were small and actually occurred before the period of economic boom. These developments make Ireland over this period an interesting context within which to examine the impact of increasing affluence and inequality on perinatal mortality rates. If income above a given threshold weakens the relationship we might expect that growing Irish affluence may lessen socio-economic differentials. On the other hand, if income inequality is a more powerful driver of differentials in mortality rates we may find relative stability in differentials or even increases between the 1980s and 2000s.
In this paper we use data from the Irish National Perinatal Reporting System (NPRS) from 1984-1988 and 1999-2006 to examine developments in perinatal mortality. Specifically, we examine whether differentials in perinatal mortality rates of babies born to fathers in different socio-economic groups changed between the two periods with particular reference to the outcomes for the unskilled manual worker or unemployed group. The influence of mother’s age and parity will also be examined. This task is made more complex by socio-demographic trends in Ireland between the two periods. As elsewhere in Europe, Ireland has witnessed a steep increase in cohabitation and thus in the proportion of women who are not married at the time of their child’s birth. This should not be a problem for analysis but details of the SEG of fathers is significantly less likely to be collected in the Irish system if the mother is unmarried. Women from the unskilled manual group are less likely to be married than women from other SEG groupings leading to systematic biases in the data. We adopt a simulation approach to analyse socio-economic inequalities in perinatal mortality controlling for missing data. Comparisons between the 1980s are also complicated by the changing pattern of immigration to Ireland across the periods. Net outflows from Ireland in the late 1980s turned to net inflows of around 70,000 people a year by 2006 with migrants increasingly coming from Eastern Europe. We analyse SEG inequalities in mortality both with and without controls for mother’s nationality.
perinatal mortality rates and some of the major demographic trends in Ireland since the 1980’s which may have affected absolute rates and differentials between groups. Section IV carries out an economic analysis of perinatal mortality rates and compares results to those found for the 1980s. It then discusses and implements a simulation procedure to control for the impact of demographic change. Section V discusses the main findings, puts forward some conclusions and makes suggestions for future work.
II THE DATA
The data used in this analysis have been compiled by the National Perinatal Reporting System (NPRS). The NPRS was introduced in the 1980’s by the Department of Health and Children and since 1999 the collection, coding, processing and reporting of data has been the responsibility of the Health Research and Information Division at the Economic and Social Research Institute (ESRI). The NPRS collects administrative, demographic and clinical information on all births in the republic of Ireland. These data are collected as part of the birth registration system, whereby all births are registered and notified using a standard 4 part Birth Notification Form (BNF). Part 3 of this form is submitted to the NPRS. Linking the NPRS data collection to the birth registration process ensures complete coverage of all births. Unfortunately only data from the point at which the NPRS system moved to the ESRI are available for analysis (1999-2006). This means that micro data from the 1980s are not available to us but detailed analyses of these data are available in a paper by Nolan and Magee (1994). Direct comparisons to differentials over the period 1984-1988 are made in this paper by replicating the analyses in Nolan and McGee (1994).
Following WHO guidelines, standard definitions of live birth, stillbirth and early neonatal deaths (death within the first week of life) are adopted here.5 To facilitate comparison to earlier findings, the same categories employed by Nolan and Magee (1994) are replicated for mother’s age and parity and are as follows:
5 For the precise definitions employed see the Annual Report on Perinatal Statistics 2006 Appendix A. In
Mother’s age: Under 20, 20-24, 25-34, 35 and over.
Parity: No previous births, 1 previous birth, 2 previous births, 3 or more
previous births.
Traditionally, father’s occupation was used as a measure of socio-economic status as mother’s labour market participation rates were relatively low in Ireland. Mother’s occupation has been collected since 1999 by the NPRS but for comparison purposes to Nolan and Magee (1994), father’s occupation is used as the measure of socio-economic status here. Father’s occupation is coded and grouped following the Central Statistics Office system of Socio-economic Groups (SEGs) utilised by Nolan and Magee.6
The groups are as follows:
Father’s Socio-economic group (SEG):
(i) Farmers, farm labourers and fishermen (ii) Professional/managerial
(iii) Intermediate non-manual (iv) Skilled/semi-skilled manual (v) Unskilled manual/unemployed. 7
Our analyses are restricted to singleton births only and, since the number of perinatal deaths in any year is relatively few (less than 400 stillbirths and 200 early neonatal deaths), we have made use of eight years of data from 1999 to 2006. Where information was missing on one of the independent variables, those cases were excluded from the analysis. Arising from this, 327,590 (70.2 per cent) of all singleton births reported to the NPRS over the period were available for analysis. There were 3,502 singleton perinatal deaths over the entire 1999-2006 period and 2,111 (60 per cent) are included in this analysis. Of these, 1,410 were stillbirths and 701 were early neonatal deaths.
6 Based on the Census of Ireland 1981 Volume 7 (1986) guidelines on occupational coding and SEGs. 7 These consist of the following SEGs as defined by the CSO: (i) is SEG 0 farmers and farm managers and
The cases omitted from this analysis are not random; in fact 99 per cent of these were omitted on the basis of father’s occupation being missing. The high proportion of missing father’s occupation can be explained in part by the requirements of the birth registration process. If a mother records her marital status as anything other than married, father’s details are not mandatory for the registration process and are often, therefore, not provided. Roughly 30 per cent of mother’s in the period 1999-2006 did not record themselves as married and therefore were not obliged to provide father’s details. Within the NPRS system, father’s occupational status is designated as ‘not applicable’ where a mother is not married and father’s details are not given. Since the 1980’s there has been a substantial increase in the number of non married mothers giving birth in Ireland which has ramifications for the comparability of this analysis. As result of the omissions, certain groups are under-represented within the data for 1999-2006.Just under 90 per cent of all cases where father’s SEG was missing were to single mothers. Younger mothers, who are predominantly single, are as a consequence, particularly under-represented, with only about 16 per cent of births to mother’s aged under 20 included. This must be kept in mind when interpreting the results, particularly as the perinatal mortality rate for the cases included in this analysis are less than the total for that age range.8 Older mothers (35 and over), were well represented with 86 per cent of cases available in this age range. Unsurprisingly, first births are also under-represented in the analysis as a high proportion of first births are to single mothers. However, the problem is much less pronounced than with young mothers, with some 60 per cent of all first births available for analysis.
It is highly likely that the exclusion of births to women without a partner’s SEG from our analyses will impact on our results and specifically the differential between the unskilled/unemployed category and other SEG groupings. For example, whereas 8 per cent of women who are themselves higher professional are deemed not applicable in terms of partners class, this is true of 35 per cent of mothers who are unskilled manual and 65 per cent who are unemployed. Previous analyses for Ireland have shown that
8 The perinatal mortality rate for mothers aged under 20 included in this analysis was 8.6 per 1,000, while
women with unskilled and unemployed partners have the highest risks of perinatal mortality (Nolan and Magee 1994). Analyses for this paper show that women who are themselves registered as unskilled/unemployed are most likely to be unmarried at the birth of their child. Given this, it is highly likely that an increasing proportion of the women whose partners cannot be attributed an SEG come from the highest risk group which itself would lead to a decrease in the SEG differential over time.
Adjusting for Demographic Change
The extent of missing data on father’s SEG seriously hampers trend analysis. There are a number of approaches that could be taken to adjust for the problem that would allow comparisons. One approach would be to reweight those cases that remain so that the SEG composition of the data replicates the known population distribution. Whilst this may have some effect it cannot correct for the fact that the cases missing from the analysis may be systematically different from those who are included and thus may have a different level of risk. We showed above that the missing cases are more likely to come from higher risk groups (as indicated by mothers SEG) but given that they differ in terms of their propensity to marry, it may be that they are also different in terms of their risk of perinatal mortality. In this case, reweighting existing cases would not correct for the underlying bias.
A second approach that could be used is direct data imputation at the individual level using regression analysis. This is standard practice in survey research where the predictors of a particular characteristic Y for cases where Y is known are used to predict the value of Y in cases where it is missing. This has the advantage that it produces values at the individual level that can then be used for analysis. Unfortunately the number and type of variables in the NPRS data set makes it less than ideal for predicting father’s SEG9. Tests showed that this approach introduced a significant degree of error into the adjustment process.
A third approach, and the one we adopt here, is an aggregate level approach based on simulation. Rather than attempting to estimate the missing father’s SEG group at the individual level, we simulate the impact that reallocation of the cases missing a father SEG due to mother’s marital status back into the data structure would have on aggregate for SEG differentials in perinatal mortality. Estimating father’s SEG at the individual level is problematic but we know the distribution of father’s SEG groups across mother’s SEG for those where both variables are present and can use this distribution to calculate the proportion of cases with a missing father’s SEG but known mother’s SEG group to be allocated to each father’s SEG. This provides the denominator for each father’s SEG. The numerator (i.e. the perinatal mortality rate) for cases with a missing father’s SEG is estimated by regression. Using coefficients drawn from the econometric analyses in Section IV as the numerator plus the samples with known and missing father’s SEG (the latter redistributed using the known distribution of mother’s SEG across father’s SEG) as components we can calculate a perinatal mortality rate for each father SEG which is ‘adjusted’ for inclusion of cases where father’s SEG was previously ‘not applicable’ and thus missing. We can represent the adjusted SEG perinatal mortality rate as:
Ŷ
i=
Σ
(
β
FC
iN
i+(
β
MC
i+
β
IC
i)
σ
N
i)
Where
Ŷ
i , the adjusted mortality rate for SEG i, is the sum of regression coefficientsfor father’s SEG i by number of cases in known father’s SEG i, plus the coefficient for imputed father’s SEG i (mother’s SEG) and interaction of this with father’s SEG i
by the fraction of ‘not applicable’ cases reallocated to father’s SEG i as signified by
sigma
N
i..The Impact of Immigration
the less, it serves as a good starting point to examine the differences that may occur in birth outcomes in Ireland. For this analysis, nationality has been grouped as follows:
Mother’s Nationality:
(i) Ireland & UK
(ii) EU 15 (excluding Ireland and UK) (iii) EU 15 to EU 25 Accession States (iv) Rest of Europe
(v) Africa (vi) Asia
(vii) Other (including mixed-nationality, no nationality etc).10
There were 130,684 (roughly 70 per cent) cases with full information for 2004 to 2006 available for analysis. Of these, 519 were stillbirths and 253 early neonatal deaths. Just over 12 per cent of these births were to mothers who were born outside of Ireland and the UK. Of those cases that were excluded, 95 per cent were on the basis of SEG being missing. These omissions impact across all the nationality groupings but in particular the EU 15-25 (with 59.4 per cent) and African (with 60.0 per cent) groups are the most under represented. In terms of maternal age, only 21 per cent of all under 20s are available for analysis with the Irish & UK group particularly under represented here with just 20.4 per cent included as compared with 57.5 per cent of Asian under 20’s. In terms of parity, 63.1 per cent of first time mother’s are included in this analysis. The issue of under representation is less pronounced in terms of parity with the least represented group being Asian first time mothers with 49.8 per cent of cases in this sub group available for analysis.
III Perinatal mortality rates and Demographic Change
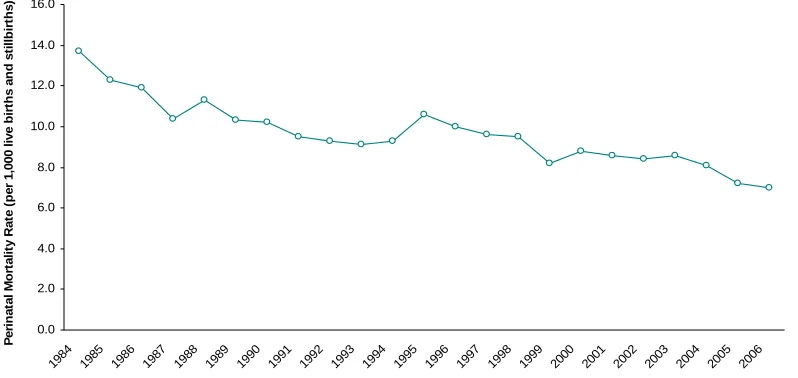
Figure 2 gives the perinatal mortality rate in Ireland over the period 1984 -2006. Over the last few decades the rate has been declining, reaching a low of 7.0 per 1,000 live births and stillbirths in 2006.11
10 For a full description of the classification of nationality used by the NPRS please see Annual Report on
Perinatal Statistics 2006, Appendix F.
Figure 2: Perinatal Mortality Rate, Ireland: 1984-2006 0.0 2.0 4.0 6.0 8.0 10.0 12.0 14.0 16.0 198 4 1985 198 6
1987 1988 1989 1990 1991 1992 1993 1994 1995 1996 1997 1998 1999 2000 2001 2002 2003 2004 2005 2006
P e ri n a ta l M o rt a lit y R a te ( p e r 1 ,0 0 0 li v e b ir th s a n d s ti llb ir th s )
Source: Annual reports on Vital Statistics, Ireland 1984-1998
Reports on Perinatal Statistics 1999-2006
Although there were some fluctuations over the period, the general trend has been towards a decrease in the overall rate.12 Based on the available singleton births data from 1999-2006, the perinatal mortality rate was 6.4 per 1,000 live births and stillbirths. Table 1 provides a summary of the distribution of births, perinatal deaths and perinatal mortality rates by each of the three independent variables of mother’s age, parity and father’s socio-economic group and also presents the perinatal mortality rates reported for these categories for the period 1984-1988.
12 The peak around 1994/95 may be as a result of the changes in definitions of stillbirths under the
Table 1: Perinatal Mortality Rate by Mother’s Age, Parity and Socio-Economic Group, Ireland 1999-2006 and 1984-1988
Maternal Characteristic Births
1999-2006 Deaths 1999-Perinatal 2006
Perinatal Mortality Rate (per 1,000) 1999-2006
Perinatal Mortality Rate
(per 1,000) 1984-1988
Age
Under 20 3,706 32 8.63 13.29
20-24 21,214 145 6.84 10.39
25-34 208,828 1,206 5.78 10.33
35 or over 93,842 728 7.76 15.69
Parity
0 114,188 763 6.68 12.31
1 109,404 579 5.29 8.70
2 64,161 377 5.88 9.36
3 or more 39,837 392 9.84 14.65
Socio-Economic Group Farmers, farm labourers
and fishermen 25,134 180 7.16 10.34 Professional/managerial 50,327 282 5.60 9.21 Intermediate non-manual 123,200 734 5.96 10.21 Skilled/semi-skilled
manual 110,213 721 6.54 10.95
Unskilled
manual/unemployed 18,716 194 10.37 19.29
Total 327,590 2,111 6.44 11.36
Overall there has been a 43 per cent decrease in the perinatal mortality rate from 11.36 per 1,000 live births and stillbirths for the period 1984-1988, to 6.44 for the period 1999-2006. The distribution of rates within the categories has changed very little over time. The conventional ‘J-shaped’ age distribution found for the period 1984-1988 is still evident in the later period although the oldest age group now exhibit the highest rates.13 Parity follows a more conventional J-shape pattern with rates highest for mothers with 3 or more previous births followed by those with no previous births. Perinatal mortality rates for SEG have also retained the same distribution pattern. The rate remains highest for the unskilled manual/unemployed group and lowest for the professional group although the differential between them has narrowed significantly, on a bivariate level at least. In the 1980’s data the ratio of the rates for
13 When the older age category is broken down, the 35-39 age category has a rate of 6.87 and the 40 and
professional and unskilled manual/unemployed groups for perinatal mortality stood at 2.09; for the 1999-2006 period the ratio falls to 1.85.
Table 2: Perinatal Mortality Rate by Mother’s nationality, 2004-2006
Nationality Births Perinatal
Deaths Mortality Rate Perinatal (per 1,000) Ireland & UK 114,025 665 5.83
EU 15 (excluding Ireland & UK) 1,525 3 1.97 EU 15 to EU25 Accession States 2,464 13 5.28 Rest of Europe 2,165 13 6.00
Africa 5,028 43 8.55
Asia 3,985 28 7.03
Other 1,492 7 4.69
Total 130,684 772 5.91
Table 2 shows the perinatal mortality rate by mother’s nationality. The perinatal mortality rate for the available data for the period 2004-2006 was 5.91 per 1,000 live births and stillbirths. Mother’s with an Africa nationality recorded the highest perinatal mortality rate at 8.55 per 1,000 live births and stillbirths. The lowest rate was reported for mothers with anEU 15 (excluding Ireland & UK) nationality with 1.97 per 1,000 live births and stillbirths. It should be remembered that the numbers underlying these rates are particularly small in some cases – with just 3 perinatal deaths reported for mothers from EU 15 countries (excluding Ireland & UK).
professional/managerial group, 38.4 per cent of births were to first time mothers. Cross-classification involving nationality reveals that for African mothers, being aged under 20 increased the perinatal mortality rate to 31.75, being in the unskilled manual/unemployed group raised it to 10.20 and having had 3 or more previous births raised it to 14.79. For a mother with an Irish & UK nationality, those characteristics were associated with much smaller rates: 6.97 for being aged under 20, 8.15 for being in the unskilled manual/unemployed group and 8.15 for having 3 or more previous births.
Demographic Changes
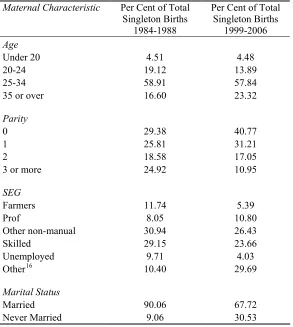
In the early 1980’s the Irish birth rate began to fall from 21.8 per 1,000 in 1980 to 15.3 per 1,000 in 1988.14 This downward trend continued until the late 1990’s when the rate began to climb again, reaching a recent high of 15.4 per 1,000 population in 2006.15 While the birth rate is returning to 1980’s levels, there has been a marked change in the underlying demographic profile of women giving birth over the period which in turn impacts on the meaningfulness of the comparisons outlined above. A summary of the main changes is provided in Table 3.
Table 3: Changes in Maternal Characteristics Maternal Characteristic Per Cent of Total
Singleton Births 1984-1988
Per Cent of Total Singleton Births
1999-2006
Age
Under 20 4.51 4.48
20-24 19.12 13.89
25-34 58.91 57.84
35 or over 16.60 23.32
Parity
0 29.38 40.77
1 25.81 31.21
2 18.58 17.05
3 or more 24.92 10.95
SEG
Farmers 11.74 5.39
Prof 8.05 10.80
Other non-manual 30.94 26.43
Skilled 29.15 23.66
Unemployed 9.71 4.03
Other16 10.40 29.69
Marital Status
Married 90.06 67.72
Never Married 9.06 30.53
Source: Perinatal Statistics 1984-1988 Department of Health Report on Perinatal Statistics 1999-2006 ESRI
The most influential change in demography relates to a change in marital status. As previously stated, the proportion of women stating that they are married at the birth of their child has decreased dramatically between the two periods. Throughout the 1980’s, never married mothers accounted for just under 10 per cent of all mothers giving birth. In the current data, never married mothers account for some 30 per cent of all mothers giving birth. As noted in Section II, this has resulted in a decrease in the availability of father’s details as non-married mothers are not legally required to provide this information and therefore, this information is generally not provided. As demonstrated in Table 3 the group ‘Other’ has increased dramatically, accounting for just under 30 per cent of all singleton births in 1999-2006, compared with 10 per cent for 1984-1988. Within the NPRS system father’s occupational status is designated as not applicable if mother is not married and father’s details are missing. The growth in
this not applicable category is the driving force behind the increase in the ‘Other’ category, and as discussed previously, this is the primary reason why only roughly 70 per cent of all data for 1999-2006 could be used in this analysis.
In terms of the age profile of mothers, the highest proportion of babies born was to women aged 25-34 throughout both time periods. The proportion of babies born to women in their early twenties has decreased with a corresponding increase in the proportion where mothers were aged 35 and over. There was little change in the proportion of babies born to teenage mothers (aged less than 20). The increase in maternal age is common to most developed countries but Ireland has been found to have one of the highest proportions of mothers aged over 35 in Europe.17 The impact of the increase in maternal age profile on pregnancy outcomes is debated but there is a general consensus that increasing maternal age is associated with an increased risk of pregnancy complications and adverse outcomes such as chromosomal abnormalities, perinatal mortality, preterm delivery, caesarean section, diabetes, and hypertension. Multiple births, which again carry a greater risk of complication, are also more common with increased age, most likely due to the role of fertility treatments.18
In terms of parity, there has been a sizeable increase in the proportion of births to first time mothers. This has been accompanied by a corresponding decrease in the proportion of babies born to women with 3 or more previous births. The effect of parity on perinatal outcomes differs depending on the parity level. Both grand multiparous and primiparous women have an elevated risk of pregnancy complications such as perinatal deaths, hypertension, pre-eclmapsia and pre-term birth over multiparous women and also experience different risk factors when compared to each other.19 The shift away from women having many previous births thus has a mixed impact. There may be fewer women in the grand multiparous at risk category but that has coincided with an increase in the at risk primiparae group.
17 European perinatal health report (2008)
18 See for example Luke & Brown (2007), Cleary Goldman et al (2005), Fretts et al (1995), Macfarlane&
Maher (2004), CEMACH (2008)
Differences in perinatal mortality rates have been found between racial and ethnic groups in a number of countries.20 The role of ethnicity in Ireland has become more relevant as Ireland becomes less culturally homogenous. In 2006, there were 420,000 non nationals living in Ireland, accounting for roughly 9 per cent of the total population. 21 In the same year, 12,048 (18.6 per cent) singleton births occurred to mothers who gave a nationality other than Irish, thus making nationality an important demographic feature to incorporate into our analyses.
IV Econometric Analyses
To examine the net impact of mother’s age and parity and father’s SEG we fitted a series of logit models of the probability of a perinatal death. The dependent variable thus takes the value 1 in the case of perinatal death and 0 otherwise. The independent variables are all categorical and entered into the equation in the form of dummy variables. Appendix Table 1 gives the full definition and construction of the variables used and the reference categories.
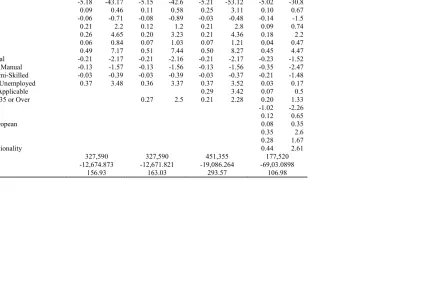
Table 4: Results for Logit Models of Perinatal Death NPRS Data 1999-2006
Model 1 Model 2 Model 3 Model 4
Β t-stat Β t-stat Β t-stat Β t-stat
Constant -5.18 -43.17 -5.15 -42.6 -5.21 -53.12 -5.02 -30.8
Age Under 20 0.09 0.46 0.11 0.58 0.25 3.11 0.10 0.67
Age 25-34 -0.06 -0.71 -0.08 -0.89 -0.03 -0.48 -0.14 -1.5
Age 35 or Over 0.21 2.2 0.12 1.2 0.21 2.8 0.09 0.74
Parity 0 0.26 4.65 0.20 3.23 0.21 4.36 0.18 2.2
Parity 2 0.06 0.84 0.07 1.03 0.07 1.21 0.04 0.47
Parity 3 or More 0.49 7.17 0.51 7.44 0.50 8.27 0.45 4.47
Father Professional -0.21 -2.17 -0.21 -2.16 -0.21 -2.17 -0.23 -1.52 Father Inter. Non Manual -0.13 -1.57 -0.13 -1.56 -0.13 -1.56 -0.35 -2.47 Father Skilled/Semi-Skilled -0.03 -0.39 -0.03 -0.39 -0.03 -0.37 -0.21 -1.48 Father Unskilled/Unemployed 0.37 3.48 0.36 3.37 0.37 3.52 0.03 0.17
Father SEG Not Applicable 0.29 3.42 0.07 0.5
Parity 0 and Age 35 or Over 0.27 2.5 0.21 2.28 0.20 1.33
Mother EU15 -1.02 -2.26
Mother EU15-25 0.12 0.65
Mother Other European 0.08 0.35
Mother African 0.35 2.6
Mother Asian 0.28 1.67
Mother Other Nationality 0.44 2.61
N 327,590 327,590 451,355 177,520
Log-Likelihood -12,674.873 -12,671.821 -19,086.264 -69,03.0898
Our model can thus be represented as:
Y=
α
+β1A+βP+β3SCWhere A: age of mother; P: parity of the birth; SC: father’s SEG.
We begin analysis by examining a model of perinatal mortality which is directly comparable to that estimated by Nolan and Magee (1994) and which does not attempt to adjust for the increase in missing father SEGs. This is shown in Table 4, Model 1. The estimated coefficients on age 35 and over, parity 0, parity 3 or more and unskilled manual/unemployed occupational group are all significant with a positive sign, indicating that compared to the reference categories each is associated with a higher probability of perinatal death. The coefficient for father unskilled/unemployed represents a 45 per cent greater risk for these cases relative to farmers. The results for age and parity largely concur with Nolan and Magee (1994) using data from 1984 -1988. The results for other father SEG groups on the other hand, are somewhat different. They found a significant and positive effect for the skilled/semi-skilled grouping and no significant effect for the professional grouping compared to farmers. Our results show a significant and negative effect for professional SEG fathers and a non-significant negative effect for skilled and semi-skilled manual employees. Their unskilled/unemployed coefficient suggested a 99 per cent higher risk for this group relative to farmers. The fall to 45 per cent22 in 1999-2006 suggests a significant
reduction in differentials. To test for two–way interactions between our variables, interaction effects were estimated between variables and their contribution to the model assessed using likelihood-ratio tests. These tests indicated that the interaction between age and parity and specifically, between having no previous births and being age 35, added significantly to the explanatory power of our model. This term is fitted in Table 4, Model 2.
The introduction of the interaction leads to a 43 per cent fall in the coefficient for age 35 or over which also becomes non-significant. The term for parity zero is reduced by a quarter but remains significant. These results suggest that the higher risk of perinatal mortality for mothers aged 35 plus is confined largely to older women having a first
birth although it should be borne in mind that this sample is selective since many women in the older age group who were not married at the time of birth are not included. We will see the impact of this selectivity in a moment.
Models 1 and 2 exclude those births where the father’s SEG was classified as ‘not applicable’ (as well as those that were unclassifiable, not stated or where the father was a full-time carer) because of mother’s marital status. As outlined in Section II, the fall in the proportion of mother’s who are married at birth has seen the size of this grouping increase dramatically over the last quarter of a century. The impact of the exclusion of these cases can be assessed in Model 3 in Table 4 which includes a new category for father’s SEG being ‘not applicable’. The inclusion of this term brings in 123,765 more cases previously excluded because of missing father’s SEG information.
As we would expect, these changes have important effects on the coefficients over Model 2. Whereas mother being aged under 20 was non-significant in Model’s 1 and 2, it increases in size and becomes very significant in Model 3. The coefficient implies an increase in risk of 28 per cent for these mothers compared to those aged 20 to 24. Mother’s age 35 or more now regains significance and increases in size from 0.12 to 0.21. Although the coefficients for father’s SEG do not change (as we would expect), those women whose partner’s SEG is classified as ‘not applicable’ have a 34 per cent higher chance of perinatal mortality compared to farming and agricultural groups.
Maternal Nationality
terms for intermediate non-manual father. In terms of the nationality variables themselves, being from an EU15 country reduced the risk of perinatal mortality by 64 per cent compared with Irish and UK nationals whereas mother having an ‘other nationality’ increases the risk by 55 per cent23.
Comparing Perinatal Mortality Rates
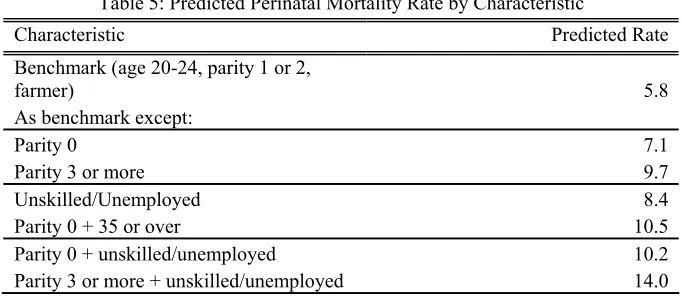
[image:21.595.127.468.507.655.2]We calculated the predicted probability of perinatal death for different combinations of the independent variables to illustrate their impact individually and together24.The results of this exercise are shown in Table 5. In the case of a mother aged 20-24, parity 1, Father farmer, the predicted risk from Model 2 of Table 4 is simply the intercept, which converts to a value of 0.0058, or a perinatal mortality rate of 5.8 per 1,000. If the only change in characteristic is that the mother has had no previous births, the predicted rate rises to 7.1 per 1,000. For a mother with a parity of 3 or more, this rises again to 9.7 per 1,000. Parity zero with mother’s age 35 plus leads to an overall rate of 10.5 per 1,000, which is an 81 per cent increase in risk over the benchmark group. Unskilled manual/unemployed father SEG has a predicted rate of 8.4 per 1,000. For this group, when there are no previous births the rate increases to 10.2 per 1,000 and increases again to a high of 14 per 1,000 with a parity of 3 or more.
Table 5: Predicted Perinatal Mortality Rate by Characteristic
Characteristic Predicted Rate
Benchmark (age 20-24, parity 1 or 2,
farmer) 5.8 As benchmark except:
Parity 0 7.1
Parity 3 or more 9.7
Unskilled/Unemployed 8.4
Parity 0 + 35 or over 10.5
Parity 0 + unskilled/unemployed 10.2 Parity 3 or more + unskilled/unemployed 14.0
Note: Predicted from Model 2, Table 4.
A number of points emerge from the preceding analysis and comparison of risk factors associated with perinatal mortality. The overall perinatal mortality rate has decreased by almost half from the 1980’s figure of 11.4 per 1,000 live births and stillbirths to 6.44 (not controlling for population characteristics). This decrease is visible across all the variables under study and in general the pattern of distribution remains the same with having a parity of 3 or more or being from the unskilled/unemployed group continuing to attract the highest rates for perinatal mortality. Comparison to Nolan and Magee (1994) shows that the falls in risk since the 1980s have not been uniform across groups controlling for compositional change. Using Model 1 from Table 4 (to facilitate comparison) we find that the unskilled/unemployed and professionals have experienced the largest fall in estimated risk at 41 per cent (13.7 per 1,000 in 80s to 8.1 per 1,000 in 00s for the unskilled and followed by professionals where risk fell by 33 per cent (6.9 per 1,000 in the 80s to 4.6 per 1,000 in 00s). Taken together, these factors indicate a general improvement in perinatal mortality overall and a decline in the differential between the professional and the unskilled/unemployed SEG groups.
Adjusting Perinatal Mortality Rates for Demographic Change
The last section found a decreasing differential across SEG groups but as shown in Section III, there has been a significant change in the proportion of women who are married when giving birth which could influence this result. This section applies the simulation approach discussed in Section II to adjust for these changes. To carry out the simulation we require two pieces of information: first, how those cases with an unknown father SEG are to be distributed across father SEG groups and second, coefficients expressing their risk of perinatal mortality (see Section II).
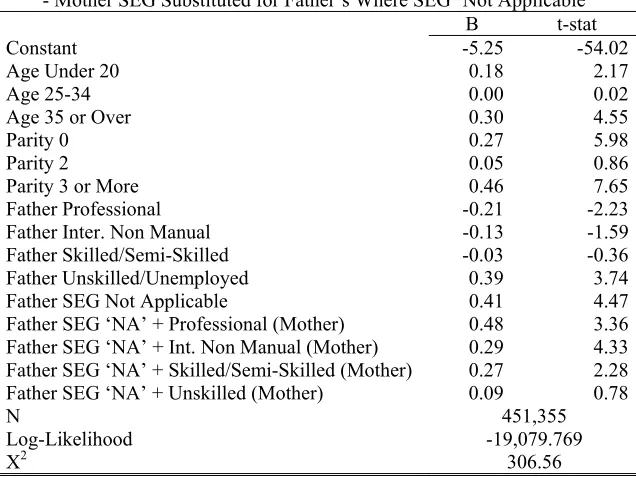
classified as farmer’s have farming partners. This correlation means that 30 per cent of partner’s are in the same SEG for those where both are known25.
Table 6: Distribution of Father’s SEG Groups Across Mother’s SEG for NPRS Sample 1999-2006 Where Both Are Known (N=327,590)
Mother’s SEG Father’s SEG
Farmer Professional Non-Manual Skilled Unskilled/Unemployed Other
Farmer 48 9 7 7 2 7
Professional 8 33 10 4 5 12
Non-Manual 19 32 44 29 20 34
Skilled 23 25 37 56 22 35
Unskilled/Unemployed 3 1 2 4 51 12
Total 100% 100% 100% 100% 100% 100%
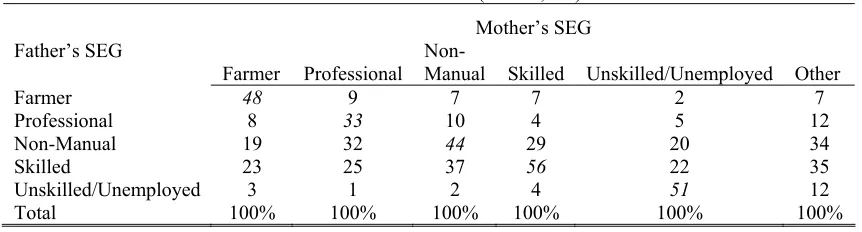
To derive proxy coefficients for those cases where fathers SEG was ‘not applicable’ we first replaced missing father’s SEGs for the ‘not applicable’ group with mother’s SEG where known. We then estimated a logit model fitting mother’s age, parity, father’s SEG (including a term for ‘not applicable’) and the interaction of ‘not applicable’ with father’s SEG. This allowed us to quantify the effect of substituting mother’s SEG for each father SEG group and calculate the additional risk for these groups. Table 7 shows the results of this model and shows that births where father SEG was ‘not applicable’ carried a significantly higher risk on average. This confirms the need to adjust for differential risk as well as the distribution of cases.
With the number of cases to be reallocated and mean effect for each SEG group we can simulate the perinatal mortality rate if ‘not applicable’ cases were assigned their ‘true’ SEG location. Table 8 gives the results of this exercise. Table 8 shows that the adjustment process has a crucial impact. After adjustment, the perinatal mortality rate rises for farmers but falls for professionals, non-manuals and skilled manual groups. Crucially, it rises most among the unskilled/unemployed where the rate increases from 8.1 per 1,000 to 8.5 per 1,000.
Table 7: Results for Logit Model of Perinatal Death NPRS Data 1999-2006 - Mother SEG Substituted for Father’s Where SEG ‘Not Applicable’
Β t-stat
Constant -5.25 -54.02
Age Under 20 0.18 2.17
Age 25-34 0.00 0.02
Age 35 or Over 0.30 4.55
Parity 0 0.27 5.98
Parity 2 0.05 0.86
Parity 3 or More 0.46 7.65 Father Professional -0.21 -2.23 Father Inter. Non Manual -0.13 -1.59 Father Skilled/Semi-Skilled -0.03 -0.36 Father Unskilled/Unemployed 0.39 3.74 Father SEG Not Applicable 0.41 4.47 Father SEG ‘NA’ + Professional (Mother) 0.48 3.36 Father SEG ‘NA’ + Int. Non Manual (Mother) 0.29 4.33 Father SEG ‘NA’ + Skilled/Semi-Skilled (Mother) 0.27 2.28 Father SEG ‘NA’ + Unskilled (Mother) 0.09 0.78
N 451,355 Log-Likelihood -19,079.769
X2 306.56
Table 8: Estimated SEG Perinatal Mortality Rates for 1984-88 and Unadjusted and Adjusted for 1999-2006
1984-1988 1999-2006
Rate/1000 1984-88
Ratio to
Prof Unadj. Rate/1000 Adjusted Rate/1000 Ratio to Prof. (Unadj.) Ratio to Prof. (Adj.)
Farmer 6.9 1 5.6 5.7 1.23 1.25
Professional 6.9 1 4.6 4.5 1.00 1.00
Non-Manual 6.9 1 5.6 5.0 1.23 1.10
Skilled 7.9 1.15 5.6 5.5 1.23 1.22
Unskilled/Unemploye
d 13.7 1.99 8.1 8.5 1.79 1.88
This confirms our earlier contention that those groups removed from the denominator by demographic change carried a higher level of risk. This adjustment in rates means that whereas with the unadjusted figures the ratio between the professional SEG and unskilled manual SEG had decreased between the 1980s and the later period from 1.99 to 1.79 before adjustment, after adjustment it rises to 1.88.
V Summary and Conclusions
[image:24.595.80.516.394.514.2]quarter of a century from 11.4 per 1,000 live births and stillbirths for the period 1984-1988, to 6.4 for the period 1999-2006. The perinatal mortality rate continues to be high for older mothers aged 35 or more and those mothers who have not had previous children or who have already had 3 or more children. Socio-economic group also continues to have a substantial bearing on outcomes. Those women whose partner’s are classified as unskilled/unemployed have perinatal mortality rates 79 per cent higher than women with partners classified as professional once we control for the distribution of maternal age and parity. This compares to a 99 per cent differential in the late 1980s in work by Nolan and Magee (1994). If correct, such a decrease in socio-economic differentials would suggest that the period of unprecedented economic growth between 1994 and 2007, the ‘Celtic Tiger’ years was accompanied by a significant reduction in perinatal mortality differentials even as overall income inequalities increased.
However, specific demographic changes plus birth registration techniques in Ireland cast some doubt on the veracity of this decrease in inequalities. From the 80s to the 2000s, in Ireland there has been a significant decrease in the proportion of women who are married at the time of childbirth. Mothers who are not married are not required to provide information on the occupational grouping of their partner and this has meant that an increasing proportion of male partners are ‘not applicable’ and cannot be used for analysis. Since working class women are both least likely to be married at the birth of their child and have the highest risk of perinatal mortality it is likely that this change may well have impacted on socio-economic differentials in mortality. The central aim of this paper was to adjust for the increasing level of missing data on father’s occupational grouping so that direct analysis could be made of trends in perinatal mortality since the late 1980s.
These results suggest that the real income growth experienced in Irish society between the 1980s and 2000’s may not only contributed to an overall reduction in perinatal mortality may also have contributed to decrease in socio-economic differentials. Over this period there was a steeper fall in the rate of mortality among unskilled manual groups than among professional groups leading to a reduction in differentials. However, unskilled manual/unemployed mothers in Ireland are still 188 per cent more likely to experience a perinatal death compared to their professional and managerial peers. Future research should examine trends in the factors associated with perinatal mortality and how these differ between socio-economic groups so as to shed light on the actual processes that differentiate groups. A clearer understanding of the factors that lead to worse outcomes for working class groups may help us to develop effective policies to reduce the risk of poor outcomes for these groups still further.
Although we have developed a method for adjusting for the information on father’s occupational group lost from the NPRS database by the current registration process, it is clearly unsatisfactory that mother’s are not obliged to provide their partner’s details if they are not married. The proportion of mothers who are not married at the time of their child’s birth has been increasing steadily since the 1980s and this trend is likely to continue. A simple change in the registration process would significantly improve the data available for analysis.
Appendix Table 1: Variables definitions
Age (Reference category = age 20 to 24)
< 20 years =1 if aged <20 years
25-34 years =1 if aged 25-34 years
35 years and over =1 if aged 35 years and over
Parity of Birth (Reference category =1 previous birth)
Parity 0 =1 if first birth
Parity 2 =1 if 2 previous birth
Parity 3 or more =1 if 3 or more previous births
Father’s Occupational Class (Reference category = Farming)
Professional =1 if Father professional
Intermediate Non-Manual =1 if Father Intermediate Non-Manual
Skilled/Semi-skilled Manual =1 if Father skilled Semi-skilled Manual
Unskilled/Unemployed =1 if Father unskilled/unemployed
Not Applicable =1 if Father SEG not applicable (ie., not married)
Mother’s Occupational Class (Reference category = Professional)
Farming =1 if Mother Farmer or other Agricultural
Intermediate Non-Manual =1 if Mother Intermediate Non-Manual
Skilled/Semi-skilled Manual =1 if Mother skilled Semi-skilled Manual
Unskilled/Unemployed =1 if Mother unskilled/unemployed
Other =1 if Mother SEG none of above
Mother’s Nationality (Reference Category=Ireland and UK)
EU15 (Excluding Ireland & UK) =1 if EU15
10 EU Accession States =1 if EU10
Rest of Europe =1 if European but not EU15 or EU10
African Country =1 if African
Asian Country =1 if Asian
Other (including US, Canada etc and
References
Aliyu, Muktar H., Hamisu M. Salihu, Louis G. Keith, John E. Ehiri, M. Aminul Islam, and Pauline E. Jolly. 2005. "Extreme Parity and the Risk of Stillbirth." Obstet Gynecol 106:446-453.
Antonovsky, A and Bernstein, J (1977). "Social Class and Infant Mortality.." Social Science and Medicine 11:453-470.
Bai, Jun, Felix W. S. Wong, Adrian Bauman, and Mohammed Mohsin. 2002. "Parity and pregnancy outcomes." American Journal of Obstetrics and Gynecology 186:274-278.
Baird, S., Friedman, J., Schady, N. (2007) Infant mortality over the business cycle in the developing world, Policy Research Working Paper 4346, The World Bank, New York.
Central Statistics Office (2008) Census 2006 Non-Irish Nationals Living in Ireland. Dublin: The Stationery Office
Central Statistics Office Vital Statistics Reports 1984-1998 Dublin: The Stationary Office
Central Statistics Office (1986) Census of Population 1981, vol.7 Dublin: The Stationary Office
Cleary-Goldman, Jane, et al. 2005. "Impact of Maternal Age on Obstetric Outcome."
Obstetrics & Gynecology 105:983-990.
Confidential Enquiry into Maternal and Child Health (CEMACH). 2008. Perinatal Mortality 2006: England, Wales and Northern Ireland. CEMACH. London.
Deaton, Angus. 2006. “Global Patterns of Income and Health: Facts, Interpretations, and Policies.” WIDER Annual Lecture, Helsinki, September 29, 2006.
Department of Health, Perinatal Statistics 1985-1988 Dublin: Stationery Office
Euro-Perstat Project (2008) European Perinatal Health Report Available:
www.europeristat.com
Fretts, Ruth C., Julie Schmittdiel, Frances H. McLean, Robert H. Usher, and Marlene B. Goldman. 1995. "Increased Maternal Age and the Risk of Fetal Death." N Engl J Med 333:953-957.
Hessol, Nancy A., and Elena Fuentes-Afflick. 2005. "Ethnic Differences in Neonatal and Postneonatal Mortality." Pediatrics 115:e44-51.
Jamison, Dean T., Martin E. Sandbu, and Jia Wang. 2004. “Why has Infant Mortality Decreased at Such Different Rates in Different Countries?” Working Paper No. 21, Disease Control Priorities Project.
Layte, R, Whelan, C.T & Nolan, B (2004), Explaining Poverty Trends in Ireland During the Boom, Irish Banking Review, Summer 2004.
Leon, D. A., Vågerö, D. and Olausson, P. O. (1992) Social class differences in infant mortality in Sweden: comparison with England and Wales, British Medical Journal, 19; 305(6855): 687–691.
Luke, B and Morton. B. Brown (2007) Elevated risks of pregnancy complications and adverse outcomes with increasing maternal age, Human Reproduction 22(5):1264-1272
MacDorman, M.F, and M.S Mathews. 2008. Recent trends in Infant Mortality in the United States. NCHS Data Brief, no.9. Hyattsville, MD: National Center for Health Statistics.
Macfarlane, A., and J. Maher. 2004. "Inequalities in infant mortality: trends by social class, registration status, mother's age and birthweight, England and Wales, 1976-2000." Health Statistics Quarterly 24:14-19.
Marmot, M. (2004) Status Syndrome: How Your Social Standing Directly Affects Your Health, Bloomsbury, London.
Nolan, Brian, and Hugh Magee. 1994. "Perinatal Mortality and Low Birthweight by Socio-Economic Background: Evidence for Ireland." Economic and Social Review
25:321-341.
Pensola TH, Valkonen T. Mortality differences by parental social class from childhood to adulthood. J Epidemiol Community Health 2000;54(7):525-9.
Pritchett, Lant, and Lawrence H. Summers. 1996. “Wealthier is Healthier.” Journal of Human Resources 31(4): 841-68.
Roman, Horace, Pierre-Yves Robillard, Eric Verspyck, Thomas C. Hulsey, Loic Marpeau, and Georges Barau. 2004. "Obstetric and Neonatal Outcomes in Grand Multiparity." Obstet Gynecol 103:1294-1299.
Waldmann, R.J (1992), Income Distribution and Infant Mortality, The Quarterly Journal of Economics, Vol. 107, No. 4 (Nov., 1992), pp. 1283-1302.
30
Year Number Title/Author(s) ESRI Authors/Co-authors Italicised
2009
311 Exploring International Differences in Rates of Return to Education: Evidence from EU SILC
Maria A. Davia, Seamus McGuinness and Philip, J. O’Connell
310 Car Ownership and Mode of Transport to Work in Ireland
Nicola Commins and Anne Nolan
309 Recent Trends in the Caesarean Section Rate in Ireland 1999-2006
Aoife Brick and Richard Layte
308 Price Inflation and Income Distribution
Anne Jennings, Seán Lyons and Richard S.J. Tol
307 Overskilling Dynamics and Education Pathways
Kostas Mavromaras,Seamus McGuinness,Yin King Fok
306 What Determines the Attractiveness of the European Union to the Location of R&D Multinational Firms?
Iulia Siedschlag, Donal Smith, Camelia Turcu, Xiaoheng Zhang
305 Do Foreign Mergers and Acquisitions Boost Firm Productivity?
Marc Schiffbauer, Iulia Siedschlag, Frances Ruane
304 Inclusion or Diversion in Higher Education in the Republic of Ireland?
Delma Byrne
303 Welfare Regime and Social Class Variation in Poverty and Economic Vulnerability in Europe: An Analysis of EU-SILC
Christopher T. Whelan and Bertrand Maître
302 Understanding the Socio-Economic Distribution and Consequences of Patterns of Multiple Deprivation: An Application of Self-Organising Maps
301 Estimating the Impact of Metro North
Edgar Morgenroth
300 Explaining Structural Change in Cardiovascular Mortality in Ireland 1995-2005: A Time Series Analysis
Richard Layte, Sinead O’Hara and Kathleen Bennett
299 EU Climate Change Policy 2013-2020: Using the Clean Development Mechanism More Effectively
Paul K Gorecki, Seán Lyons and Richard S.J. Tol
298 Irish Public Capital Spending in a Recession
Edgar Morgenroth
297 Exporting and Ownership Contributions to Irish Manufacturing Productivity Growth
Anne Marie Gleeson, Frances Ruane
296 Eligibility for Free Primary Care and Avoidable Hospitalisations in Ireland
Anne Nolan
295 Managing Household Waste in Ireland: Behavioural Parameters and Policy Options
John Curtis, Seán Lyons and Abigail O’Callaghan-Platt
294 Labour Market Mismatch Among UK Graduates; An Analysis Using REFLEX Data
Seamus McGuinness and Peter J. Sloane
293 Towards Regional Environmental Accounts for Ireland
Richard S.J. Tol , Nicola Commins, Niamh Crilly, Sean Lyons and Edgar Morgenroth
292 EU Climate Change Policy 2013-2020: Thoughts on Property Rights and Market Choices
Paul K. Gorecki, Sean Lyons and Richard S.J. Tol
291 Measuring House Price Change
David Duffy
290 Intra-and Extra-Union Flexibility in Meeting the European Union’s Emission Reduction Targets
Richard S.J. Tol
289 The Determinants and Effects of Training at Work: Bringing the Workplace Back In
Philip J. O’Connell and Delma Byrne
Richard S.J. Tol
287 The Behaviour of the Irish Economy: Insights from the HERMES macro-economic model
Adele Bergin, Thomas Conefrey, John FitzGerald and
Ide Kearney
286 Mapping Patterns of Multiple Deprivation Using Self-Organising Maps: An Application to EU-SILC Data for Ireland
Maurizio Pisati, Christopher T. Whelan, Mario Lucchini and Bertrand Maître
285 The Feasibility of Low Concentration Targets: An Application of FUND
Richard S.J. Tol
284 Policy Options to Reduce Ireland’s GHG Emissions
Instrument choice: the pros and cons of alternative policy instruments
Thomas Legge and Sue Scott
283 Accounting for Taste: An Examination of Socioeconomic Gradients in Attendance at Arts Events
Pete Lunn and Elish Kelly
282 The Economic Impact of Ocean Acidification on Coral Reefs
Luke M. Brander, Katrin Rehdanz, Richard S.J. Tol, and Pieter J.H. van Beukering
281 Assessing the impact of biodiversity on tourism flows: A model for tourist behaviour and its policy implications Giulia Macagno, Maria Loureiro, Paulo A.L.D. Nunes and
Richard S.J. Tol
280 Advertising to boost energy efficiency: the Power of One campaign and natural gas consumption
Seán Diffney, Seán Lyons and Laura Malaguzzi Valeri
279 International Transmission of Business Cycles Between Ireland and its Trading Partners
Jean Goggin and Iulia Siedschlag
278 Optimal Global Dynamic Carbon Taxation
David Anthoff
277 Energy Use and Appliance Ownership in Ireland
276 Discounting for Climate Change
David Anthoff, Richard S.J. Tol and Gary W. Yohe
275 Projecting the Future Numbers of Migrant Workers in the Health and Social Care Sectors in Ireland
Alan Barrett and Anna Rust
274 Economic Costs of Extratropical Storms under Climate Change: An application of FUND
Daiju Narita, Richard S.J. Tol, David Anthoff
273 The Macro-Economic Impact of Changing the Rate of Corporation Tax
Thomas Conefrey and John D. Fitz Gerald
272 The Games We Used to Play
An Application of Survival Analysis to the Sporting Life-course
Pete Lunn
2008
271 Exploring the Economic Geography of Ireland
Edgar Morgenroth
270 Benchmarking, Social Partnership and Higher Remuneration: Wage Settling Institutions and the Public-Private Sector Wage Gap in Ireland
Elish Kelly, Seamus McGuinness, Philip O’Connell
269 A Dynamic Analysis of Household Car Ownership in Ireland
Anne Nolan
268 The Determinants of Mode of Transport to Work in the Greater Dublin Area
Nicola Commins and Anne Nolan
267 Resonances from Economic Development for Current Economic Policymaking
Frances Ruane
266 The Impact of Wage Bargaining Regime on Firm-Level Competitiveness and Wage Inequality: The Case of Ireland
Seamus McGuinness, Elish Kelly and Philip O’Connell
265 Poverty in Ireland in Comparative European Perspective
Christopher T. Whelan and Bertrand Maître
264 A Hedonic Analysis of the Value of Rail Transport in the Greater Dublin Area
Tol
263 Comparing Poverty Indicators in an Enlarged EU
Christopher T. Whelan and Bertrand Maître
262 Fuel Poverty in Ireland: Extent, Affected Groups and Policy Issues
Sue Scott, Seán Lyons, Claire Keane, Donal McCarthy and Richard S.J. Tol
261 The Misperception of Inflation by Irish Consumers
David Duffy and Pete Lunn
260 The Direct Impact of Climate Change on Regional Labour Productivity
Tord Kjellstrom, R Sari Kovats, Simon J. Lloyd, Tom Holt, Richard S.J. Tol
259 Damage Costs of Climate Change through Intensification of Tropical Cyclone Activities:
An Application of FUND
Daiju Narita, Richard S. J. Tol and David Anthoff
258 Are Over-educated People Insiders or Outsiders?
A Case of Job Search Methods and Over-education in UK Aleksander Kucel, Delma Byrne
257 Metrics for Aggregating the Climate Effect of Different Emissions: A Unifying Framework
Richard S.J. Tol, Terje K. Berntsen, Brian C. O’Neill, Jan S. Fuglestvedt, Keith P. Shine, Yves Balkanski and Laszlo Makra
256 Intra-Union Flexibility of Non-ETS Emission Reduction Obligations in the European Union
Richard S.J. Tol
255 The Economic Impact of Climate Change
Richard S.J. Tol
254 Measuring International Inequity Aversion
Richard S.J. Tol
253 Using a Census to Assess the Reliability of a National Household Survey for Migration Research: The Case of Ireland
Alan Barrett and Elish Kelly
252 Risk Aversion, Time Preference, and the Social Cost of Carbon
251 The Impact of a Carbon Tax on Economic Growth and Carbon Dioxide Emissions in Ireland
Thomas Conefrey, John D. Fitz Gerald, Laura Malaguzzi Valeri and Richard S.J. Tol
250 The Distributional Implications of a Carbon Tax in Ireland
Tim Callan, Sean Lyons, Susan Scott, Richard S.J. Tol
and Stefano Verde
249 Measuring Material Deprivation in the Enlarged EU
Christopher T. Whelan, Brian Nolan and Bertrand Maître
248 Marginal Abatement Costs on Carbon-Dioxide Emissions: A Meta-Analysis
Onno Kuik, Luke Brander and Richard S.J. Tol
247 Incorporating GHG Emission Costs in the Economic Appraisal of Projects Supported by State Development Agencies
Richard S.J. Tol and Seán Lyons
246 A Carton Tax for Ireland
Richard S.J. Tol, Tim Callan, Thomas Conefrey, John D. Fitz Gerald, Seán Lyons, Laura Malaguzzi Valeri and
Susan Scott
245 Non-cash Benefits and the Distribution of Economic Welfare
Tim Callan and Claire Keane
244 Scenarios of Carbon Dioxide Emissions from Aviation
Karen Mayor and Richard S.J. Tol
243 The Effect of the Euro on Export Patterns: Empirical Evidence from Industry Data
Gavin Murphy and Iulia Siedschlag
242 The Economic Returns to Field of Study and
Competencies Among Higher Education Graduates in Ireland
Elish Kelly, Philip O’Connell and Emer Smyth
241 European Climate Policy and Aviation Emissions
Karen Mayor and Richard S.J. Tol
240 Aviation and the Environment in the Context of the EU-US Open Skies Agreement
Karen Mayor and Richard S.J. Tol
239 Yuppie Kvetch? Work-life Conflict and Social Class in Western Europe
238 Immigrants and Welfare Programmes: Exploring the Interactions between Immigrant Characteristics, Immigrant Welfare Dependence and Welfare Policy
Alan Barrett and Yvonne McCarthy
237 How Local is Hospital Treatment? An Exploratory Analysis of Public/Private Variation in Location of Treatment in Irish Acute Public Hospitals
Jacqueline O’Reilly and Miriam M. Wiley
236 The Immigrant Earnings Disadvantage Across the Earnings and Skills Distributions: The Case of
Immigrants from the EU’s New Member States in Ireland
Alan Barrett, Seamus McGuinness and Martin O’Brien
235 Europeanisation of Inequality and European Reference Groups
Christopher T. Whelan and Bertrand Maître
234 Managing Capital Flows: Experiences from Central and Eastern Europe
Jürgen von Hagen and Iulia Siedschlag
233 ICT Diffusion, Innovation Systems, Globalisation and Regional Economic Dynamics: Theory and Empirical Evidence
Charlie Karlsson, Gunther Maier, Michaela Trippl, Iulia Siedschlag, Robert Owen and Gavin Murphy
232 Welfare and Competition Effects of Electricity Interconnection between Great Britain and Ireland
Laura Malaguzzi Valeri
231 Is FDI into China Crowding Out the FDI into the European Union?
Laura Resmini and Iulia Siedschlag
230 Estimating the Economic Cost of Disability in Ireland John Cullinan, Brenda Gannon and Seán Lyons
229 Controlling the Cost of Controlling the Climate: The Irish Government’s Climate Change Strategy
Colm McCarthy, Sue Scott
228 The Impact of Climate Change on the Balanced-Growth-Equivalent: An Application of FUND
David Anthoff, Richard S.J. Tol
227 Changing Returns to Education During a Boom? The Case of Ireland
226 ‘New’ and ‘Old’ Social Risks: Life Cycle and Social Class Perspectives on Social Exclusion in Ireland
Christopher T. Whelan and Bertrand Maître
225 The Climate Preferences of Irish Tourists by Purpose of Travel
Seán Lyons, Karen Mayor and Richard S.J. Tol
224 A Hirsch Measure for the Quality of Research
Supervision, and an Illustration with Trade Economists
Frances P. Ruane and Richard S.J. Tol
223 Environmental Accounts for the Republic of Ireland: 1990-2005
Seán Lyons, Karen Mayor and Richard S.J. Tol
2007 222 Assessing Vulnerability of Selected Sectors under
Environmental Tax Reform: The issue of pricing power
J. Fitz Gerald, M. Keeney and S. Scott
221 Climate Policy Versus Development Aid
Richard S.J. Tol
220 Exports and Productivity – Comparable Evidence for 14 Countries
The International Study Group on Exports and Productivity
219 Energy-Using Appliances and Energy-Saving Features: Determinants of Ownership in Ireland
Joe O’Doherty, Seán Lyons and Richard S.J. Tol
218 The Public/Private Mix in Irish Acute Public Hospitals: Trends and Implications
Jacqueline O’Reilly and Miriam M. Wiley
217 Regret About the Timing of First Sexual Intercourse: The Role of Age and Context
Richard Layte, Hannah McGee
216 Determinants of Water Connection Type and Ownership of Water-Using Appliances in Ireland
Joe O’Doherty, Seán Lyons and Richard S.J. Tol
215 Unemployment – Stage or Stigma?
Being Unemployed During an Economic Boom
Emer Smyth
214 The Value of Lost Load
213 Adolescents’ Educational Attainment and School Experiences in Contemporary Ireland
Merike Darmody, Selina McCoy, Emer Smyth
212 Acting Up or Opting Out? Truancy in Irish Secondary Schools
Merike Darmody, Emer Smyth and Selina McCoy
211 Where do MNEs Expand Production: Location Choices of the Pharmaceutical Industry in Europe after 1992
Frances P. Ruane, Xiaoheng Zhang
210 Holiday Destinations: Understanding the Travel Choices of Irish Tourists
Seán Lyons, Karen Mayor and Richard S.J. Tol
209 The Effectiveness of Competition Policy and the Price-Cost Margin: Evidence from Panel Data
Patrick McCloughan, Seán Lyons and William Batt
208 Tax Structure and Female Labour Market Participation: Evidence from Ireland
Tim Callan, A. Van Soest, J.R. Walsh
207 Distributional Effects of Public Education Transfers in Seven European Countries