Exchanges
Exchanges
CLIVAR is an international research programme dealing with climate variability and pre-dictability on time-scales from months to centuries.
CLIVAR is a component of the World Climate Research Programme (WCRP). WCRP is sponsored by the World Mete-orological Organization, the In-ternational Council for Science and the Intergovernmental Oceanographic Commission of UNESCO.
Latest CLIVAR News http://www.clivar.org/recent/
See the CLIVAR Calendar http://www.clivar.org/calendar/index.htm
[image:1.595.54.507.228.495.2]Call for Contributions
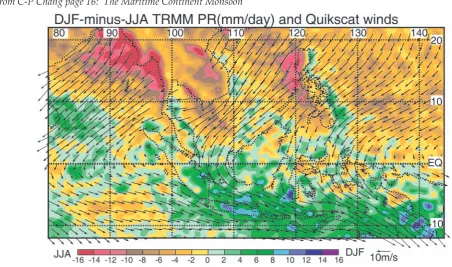
Fig. 1 Differences of TRMM Precipitation Radar data and QuikSCAT winds between boreal winter and boreal summer (DJF minus JJA). Warm colors are the boreal summer monsoon regime and cool colors are the boreal winter monsoon regime.
From C-P Chang page 16: The Maritime Continent Monsoon
The Asian Monsoon
The next issue of CLIVAR Exchanges will be on the Southern Ocean and the International Polar Year and will feature papers from the Modes of Southern Hemisphere Climate Variability Workshop held in Cambridge, United Kingdom from 27 - 30th June 2005
CLIVAR/OOPC/GOOS/Argo Workshop on the South Pacific; Concepcion, Chile, 11-14 October 2005
Tropical Atlantic Variability Workshop; Venice, Italy, 17-19 October 2005
Editorial
As you will see, the Asian monsoon system forms the primary focus of this issue of Exchanges. Societies across southern Asia are critically dependent on the monsoon rains, and failures such as happened in the 2002 monsoon seasonal have a devastating effect. The challenge for CLIVAR is monsoon prediction and its links to applications, activities that are focussed in CLIVAR’s Asian Australian Monsoon Panel (AAMP). The panel had its 7th meeting in Irvine, California from 18-19 June, immediately following the 1st pan WCRP Workshop on the Monsoon Climate Systems (15-17 June 2005), also held in Irvine and itself focussed on improving the coordination of WCRP efforts to predict the monsoon systems of the world. The AAMP meeting, co-chaired by Kumar Kolli and Bin Wang, covered a number of key aspects of WCRP’s efforts in this area, including the status and development of coordinated coupled model AA monsoon prediction experiments, aspects of monsoon predictability and prediction, the role of intra-seasonal oscillations, the application of regional modelling to prediction of the AA monsoon, the role of the Pacific and how the AA monsoon system might be influenced by anthropogenic climate change. A number of issues emerged from the discussions, some of which will be tackled in collaboration with other CLIVAR Panels, in particular CLIVAR’s Working Group on Seasonal Prediction and Pacific Science Implementation Panel. A report of the meeting is in preparation, but for the present a number of the presentations can be viewed on the CLIVAR web site linked to www.clivar.org/organization/ aamon/aamp7/agenda.htm.
The Joint CLIVAR/GOOS Indian Ocean Panel (IOP) currently acts, from a CLIVAR perspective, as a sub-panel of the AAMP. The IOP is critical to the development of the sustained observing system in the Indian Ocean region. Observations from the present and planned Indian Ocean arrays will form a key long-term input to both our understanding of the role of the Indian Ocean for the AA monsoon and our ability to predict it. The IOP had its second meeting in Hobart, Australia from 30 March -2 April 2005 and the report by Zhongwei Yan on page 4 gives a summary of the outcomes of the meeting, the full report of which can be found at: www.clivar. org/organization/indian/docs/92_IOP2.pdf.
Report of another monsoon-related meeting, namely the 8th session of the CLIVAR Variability of the American Monsoon Systems (VAMOS) Panel will be found on page 5 whilst on the page opposite is an outline of the currently-planned Tropical Atlantic Climate Experiment (TACE). TACE is a key activity of CLIVAR’s Atlantic Panel, linking strongly also to aspects of African climate, in particular in the Sahel and Gulf of Guinea region. In addition, two papers relating to both the monsoon systems in South America and West Africa will be found at the end of this edition.
The 1st pan WCRP Workshop on the Monsoon Climate Systems, which was jointly organised by CLIVAR and GEWEX, was held just prior to the 5th International GEWEX Scientific Conference and at the same location. We were indeed very grateful for local GEWEX support for the workshop at this busy time for them, not least from Soroosh Sorooshian the GEWEX Chair and his staff, Diane Hohmbaum and Huiling Yuan. The workshop was co-chaired by Ken Sperber and Tetsuzo Yasunari who are now working hard on the outcomes. One was a clear call for greater cross-WCRP coordination of monsoon activities, which will need some careful thinking through in terms of mechanisms. On the science front there was clear concern that despite all the advances in modelling and parametrizations over the years, monsoon simulations still suffer from major errors. In particular, for example, the diurnal cycle of rainfall isn’t simulated correctly in terms of timing in many models. The call was for use of a hierarchy of models, including cloud-resolving models in high resolution simulations, to try to home in some of these problems, so providing one focus for CLIVAR/GEWEX interactions in this area. The diurnal cycle was seem as one area of attack, the hypothesis being that because of its potential rectification onto sub-seasonal variability (e.g. the Madden Julian Oscillation) improvement in its representation may lead to an improved representation of intra-seasonal variability and improved skill of monsoon forecasts on medium range to seasonal timescales. What was also evident was the need for coupled ocean-atmosphere models (rather than just atmospheric models alone) for monsoon simulation & prediction. PDF versions of most of the presentations at the workshop can be found on the workshop web page at www.clivar.org/organization/ aamon/WCRPmonsoonWS/monsoonWS.htm.
As I write, Zhongwei Yan is leaving the ICPO for a new post in the Institute of Atmospheric Physics in Beijing. Zhongwei has been with the ICPO, supported by US CLIVAR, for the past 4 years and has been responsible for looking after four CLIVAR panels, namely AAMP, the IOP, the joint CLIVAR/Commission for Climatology Expert Team on Climate Change Detection, Monitoring and Indices and, more recently, CLIVAR PAGES. We wish Zhongwei well in his new post, which will involve him in research on climate indices.
Finally, some late breaking news. We have heard today, that Roberta Boscolo who now works for the ICPO from the Observatoire Oceanologique de Villefranche Villefrache sur mer, France has been delivered with a baby boy, Leonardo. We wish Roberta, Emilio and Leonardo every happiness together. Similar congratulations and good wishes go to Mike Sparrow and Moira on the birth of their son Jaime on 10 May this year. The ICPO productivity has certainly taken an upturn!
The ocean has a major influence on tropical Atlantic variability mainly through the influence of tropical Atlantic SST on variations of the Atlantic marine ITCZ complex. The most notable climate impacts involve the variability of rainfall over northeast Brazil and the coastal regions surrounding the Gulf of Guinea, and the fluctuations in rainfall and dustiness in sub-Saharan Africa (Sahel). Many studies indicate a high degree of potential predictability for climate variations in the tropical Atlantic region. However, progress in tropical Atlantic climate prediction has been slow to come due to insufficient understanding of ocean-atmosphere processes that determine climate variability, lack of adequate data to initialise forecasts, and systematic errors in the models used for prediction (Figure 1).
Understanding tropical Atlantic climate variability, with the goal of improving its predictability and identifying and quantifying its societal impacts, are important research goals recognized by CLIVAR. Concerted international effort is needed to improve the understanding of the regions’ climate variability and the mechanisms that underlie its observed behaviour. A “Tropical Atlantic Climate Experiment “(TACE) has been proposed to address these issues. TACE is envisioned as a program of enhanced observations and process studies in the tropical Atlantic spanning a period of approximately 6 years (2006-2011). Its goal is to provide a focused observational and modelling effort to advance climate
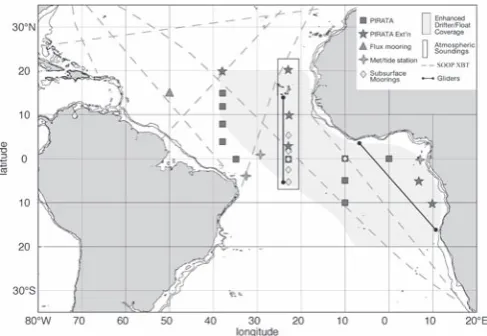
predictability in the surrounding region and to provide a basis for assessment and improvement of coupled models. The results of TACE are expected to contribute to the final design of a sustained observing system for the tropical Atlantic (Figure 2).
A TACE “White Paper” (http://www.clivar.org/ science/atlantic.htm) provides an overview of the physical processes affecting climate variability in the tropical Atlantic and priorities for further study. An abbreviated synopsis of TACE (http://www.clivar.org/ science/atlantic.htm#NEWS) outlines its major scientific thrusts and provides recommendations for new and/or continuing observations and modeling studies that are thought to be essential for TACE. These recommendations represent the culmination of planning efforts that have been carried out between 1999-2004 at several workshops, including the recent Tropical Atlantic Workshop in de Bilt, Netherlands (June 2004). Details of implementation were discussed at these meetings and represent the current consensus on the required observational and modeling components of the program.
[image:3.595.310.554.209.377.2]To further develop TACE, a one-day “TACE Implementation Workshop” was held in Miami, Florida on February 3, 2005. The participants endorsed the TACE initiative as timely and relevant to CLIVAR goals, and supported its unified observational, modeling and synthesis concept. Many of the observational elements of the TACE plan are currently in place or proposed. TACE will encourage
[image:3.595.40.281.336.533.2]Figure 1. Correlation between observed sea surface temperature in June, July, August and sea surface temperature that is predicted at May 1st using ECMWFs seasonal forecasting system over the years 1987-2001. Note the lack of skill in the eastern tropical Atlantic (Hazeleger and van Oldenborgh, in preparation).
Figure 2. TACE Observational Strategy. The proposed observing system components include (see legend): Continuation of PIRATA moorings, PIRATA extensions along 23 º W and 5-10º E, equatorial subsurface (non-realtime) moorings along 23 ºE and at 10º W, island meteorological and tide gauge stations, enhanced float/drifter coverage in the eastern TA, repeated atmospheric soundings along 23 º W, ship-of-opportunity XBT lines, and selected glider transects (see the “TACE Synopsis” for more details
TACE: Tropical Atlantic Climate Experiment
and perform further enhancements to observations in the tropical Atlantic, promote model intercomparison studies to identify model biases and their causes, and set up a data archive to facilitate synthesis studies As an outcome of the workshop, two working groups will be established: (i) a TACE “Observations Working Group” to coordinate observational logistics and develop needed enhancements, and (ii) a TACE “Modeling and Synthesis
Working Group” to coordinate modeling efforts and encourage collaboration between research modelers and operational centers. These activities are expected to significantly speed progress toward improved seasonal and interannual prediction in the tropical Atlantic, and to begin to advance understanding of possible impacts of global change on the tropical Atlantic and its global teleconnection patterns.
The CLIVAR/GOOS Indian Ocean Panel (IOP) held its second meeting at the CSIRO Marine Laboratories, Hobart, Australia, 30 March – 2 April 2005. Twenty-eight panel members and invited experts from Australia, China, France, Germany, India, Indonesia, Japan, South Africa, the United Kingdom and the United States attended the meeting, aiming at completing the Implementation Plan for a sustained integrated observing system for climate in the Indian Ocean (IO) and developing a strategy of IO-related climate study.
A symposium on IO climate was organized prior to panel discussions, providing a scientific background for panel business. Invited speakers introduced a wide range of topics, including intra-seasonal prediction of Asian-Australian monsoons, global and IO mean and variability of air-sea heat fluxes, IO deep mixing and the surface heat budget, The West Australian Indian Ocean Climate Initiative, IO circulation variability, its modeling and climate relevance. The science overview talks and subsequent discussions provided a base for a consensus view that the panel is keen to play a role in developing a science plan for IO climate research.
Since the last panel meeting, IOP has developed the concept of an IO integrated observing system in active email discussions and contributed to the co-sponsor programmes by participating in the
• CLIVAR Data Management Meeting, March 2004, SIO La Jolla;
• Indian Ocean GOOS, April 2004, Colombo; • OOPC-9, June 2004, Southampton;
• CLIVAR Conference, June 2004, Baltimore;
• GSOP Workshop and Panel, November 2004, Boulder;
• Ocean Technology/Oceans ’04, November 2004, Kobe;
• Organization of the Indian Ocean Modeling Workshop, December 2004, Honolulu;
• Development of a CLIVAR Data Policy (GSOP-led email discussion); and
• Preparation of the CLIVAR SSG Report to WCRP JSC, March 2005 , Guayaquil.
The first draft plan for sustained observations emerged
Report of the Second Indian Ocean Panel Meeting (IOP-2) 30 March – 2 April 2005, CSIRO, Hobart, Australia
Z. Yan ICPO, Southampton, UK
Corresponding author: [email protected]
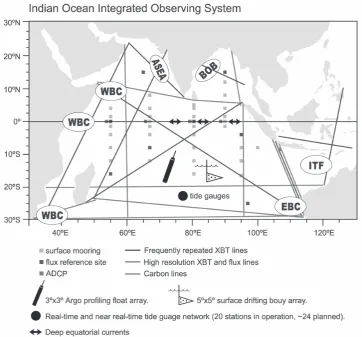
at IOP-1, based primarily on observational studies. The panel reviewed recent advances in Observing System Simulation Experiments (OSSEs) and climatologies of surface fluxes at IOP-2, which helped refine the location of surface moorings, flux reference sites and direct current measurements by ADCP. and the relationship between components of the system, including (Figure 1)
• surface fluxes reference sites; • a basin-scale mooring array; • a 3ox3o array of Argo floats;
• a 5ox5o surface drifters; and
• an enhanced XBT network.
Based on the discussions, the panel agreed to complete the Implementation Plan by June 2005, with a summary for the Bulletin of American Meteorological Society and more detailed papers for a special issue of CLIVAR Exchanges.
The panel was briefed on plans for process studies, including VASCO-CIRENE (France) and MISMO (Japan) to investigate air-sea interaction at intraseasonal time-scales and INSTANT to directly measure Indonesian Throughflow and devise proxy methods for long-term monitoring. Routine cruises by R/V’s Indian Sagar Kanya and Chinese Xue-Long and Ocean-1 were identified as opportunities to build the basin scale mooring array and deploy Argo floats. Opportunities to collaborate with international development of the Tsunami Warning System were identified. It was recommended that all relevant research cruises and projects be proactively tracked for IOP to coordinate the implementation of the observing system.
longer lifetime (than the originally expected 3 annual meetings) for a continuous implementation process even if only for maintaining the observing system, and that it should be a distinct basin-panel, as with the Pacific and Atlantic Oceans.
IOP-2 ended as a fruitful success in terms of bringing together a wide range of research and operational
[image:5.595.115.478.181.518.2]issues, facilitating in-depth discussions for finalizing the Implementation Plan and resulting in some consensus view on the panel’s future. The attendees highly appreciated the hosting of the meeting by the CSIRO Marine Laboratories, Hobart and Dr. Meyers and looked forward to further collaborations in the near future. A more detailed report is available at: http://www.clivar. org/organization/indian/.
Figure 1: An integrated observing system for the Indian Ocean
Meeting Report: The eighth session of the CLIVAR VAMOS Panel - Executive Summary
Corresponding author: [email protected]
The eighth session of the WCRP/CLIVAR VAMOS (Variability of the American Monsoon System) Panel (VPM8) was hosted by the Servicio Meteorológico Nacional (SMN), in Mexico City, Mexico, 7-9 March, 2005. VPM8 consisted of a VAMOS Modeling Workshop and the VAMOS Panel meeting. It was followed by the MESA SWG-1 and NAME Data Analysis and SWG-7 meetings on 9-11 March, 2005. The event was attended by 85 participants from 8 countries.
VAMOS implementation includes 3 major science components (North American Monsoon Experiment (NAME), Monsoon Experiment South America (MESA) and VAMOS Oceans-Clouds-Atmosphere-Land Study
(VOCALS)), the VAMOS Data Information Server and the VAMOS Programs Project Office. The chairs of each of the Science Working Groups (SWGs) reported on recent progress in their programs.
across Pan America, especially between participating operational and research groups. NAME also provides a template for future observing systems to monitor the North American Monsoon.
MESA is now integrating the objectives of the different projects in South America (SALLJEX, PLATIN, LBA) into a unified program that improves understanding, simulations and prediction of the South American Monsoon System (SAMS). During 2004, progress was made on the SALLJEX data quality control and generation of new datasets. Preliminary studies using SALLJEX data are providing quantitative information on the regional errors of global reanalyses, confirming that regional models are capable of simulating the basic features of low-level warm season circulations over tropical South America, but have difficulties in reproducing the observed diurnal cycle. The VAMOS/PLATIN Group made a successful contribution to the first phase of the GEF Framework Program for the La Plata Basin (LPB), producing surveys of the LPB’s hydroclimate, including the systems used for its prediction and monitoring. The goal of VOCALS is to better understand, simulate, and predict the Southeast Pacific cool-ocean climate regime and its interactions with the larger-scale coupled ocean-atmosphere-land system on diurnal to interannual time scales. VOCALS was developed in response to the awareness that present models have large errors in the stratus deck regions off northern Chile and Peru and that such regions play a significant role in the global climate system. Models have difficulty getting sea surface temperature (SST) and shortwave radiative forcing correct in this region. Since October 2000 a series of cruises to the region and data from a surface mooring located near the center of the climatological maximum in cloud cover have provided observations that have matured the foci and plans of VOCALS. A multinational, multi-investigator process study is planned in the region for October 2007.
A first proposal for an Intra-Americas Study of Climate Processes (IASCLIP) was presented at VPM8. The IASCLIP domain includes the Caribbean Sea, the Gulf of Mexico and the adjacent land areas over southern North America, Central America and northern South America. A Statement of Need for a research program in the region and the science foci were discussed, and
the VAMOS Panel was asked to provide feedback on the program, including science priorities and linkages to the community.
The VAMOS Modeling Workshop reviewed the status of modeling relevant to VAMOS research, bringing together leading modeling groups to focus on developing recommendations for a long-term VAMOS modeling strategy. The workshop was organized into four sessions:
Physical Processes in the Monsoon Regions Climate Forecasting in the Monsoon Regions VOCALS modeling activities
Integrated MESA–NAME–VOCALS Modeling Activities.
Discussions led to a basic modeling strategy (end-to-end prediction system) and a set of VAMOS themes (e.g. drought, extreme events). The Modeling Group for VAMOS (MGV) is drafting a VAMOS Modeling Strategy Report to be reviewed by the CLIVAR SSG and presented at the WCRP Monsoon Workshop (Irvine, Ca. USA) in June 2005.
During the VAMOS Panel Executive Session the implementation strategy for the MGV was discussed. The panel also developed recommendations for the VAMOS science components and the emerging IASCLIP program. The theme for the 2nd issue of the VAMOS NEWSLETTER was discussed and approved. The 9th VAMOS panel meeting will be held back-to-back with the 8th AMS International Conference on SH Meteorology and Oceanography, in Foz do Iguazu, Brazil, in April 2006. MESA and NAME SWG meetings will also be held at that time. Finally, the panel developed recommendations for the 2005 membership rotation and forwarded these to the CLIVAR SSG for consideration.
Absorbing aerosols, such as dust and black carbon, are characterized by their ability to heat the atmosphere by absorbing solar radiation. In contrast, non-absorbing aerosols such as sulfate, scatter solar radiation and have relatively small atmospheric heating effect. Yet, both absorbing and non-absorbing aerosols cause surface cooling by blocking solar radiation from reaching the earth’s surface. This has been referred to as the “global dimming” effect (Stanhill and Cohen 2001). The dimming effect is global, even though sources of aerosols are local, because of the abundance and diverse geographic locations of the sources, continuous emission, and long-range transport of aerosols. In recent coupled model experiments, Ramanathan et al (2005) show that as a result of “global dimming”, the Indian monsoon is reduced on decadal or longer time scales. From atmospheric GCM experiments, Menon et al (2002) showed that heating by increasing atmospheric loading of black carbon in the Asian monsoon region may be responsible for the long-term drought pattern over northern China. More recently, Lau et al (2005) point out that, on intraseasonal to interannual time scales, heating by absorbing aerosols may induce a tropospheric temperature anomaly over the northern India and Tibetan regions in late spring and early summer, subsequently leading to an earlier
Observational Evidence Of Effects Of Absorbing Aerosols On Seasonal-to- Interannual Anomalies Of The Asian Monsoon
K.-M. Lau, K.-M. Kim and N.-C. Hsu
Laboratory for Atmospheres, NASA/Goddard Space Flight Center, USA Corresponding author: [email protected]
[image:7.595.118.484.474.748.2]onset and intensification of the Indian monsoon. They propose the importance of the “elevated heat pump” effect of atmospheric heating by dust transported from the nearby deserts to northern India, stacking up against the southern slopes of the Himalayas. The dust combined with the black carbon from industrial and agricultural pollution in northern India provide an anomalous diabatic heat source, which triggers positive feedback in monsoon convective heating, enhancing the Indian monsoon. These results suggest that aerosol effects on monsoon water cycle dynamics are complex and likely to be a strong function of spatial and temporal scales. Up to now, there has been no convincing observational evidence of aerosol effects on monsoon climate variability because of the lack of long-term (> 10 years) aerosol data. Recent satellite observations such as MODIS, MISR from NASA EOS have provided much needed, but still inadequate information on aerosol radiative properties. Since aerosol-induced anomalies are likely to be further confounded by the strong influence of a variety of forcing agents, including El Niño, Indian Ocean and West Pacific sea surface temperature anomalies, and possibly from global warming, the lack of reliable, long-term aerosol data make it very difficult to extract significant signals of aerosol effects on monsoon water cycle variability. In
this regard, the aforementioned modeling studies will provide valuable guidance on how and where to look for such signals in observations.
In this article, we show observations in support of the notion that aerosol forcing in late spring and early summer may induce Asian monsoon anomalies, and discuss how the radiative imbalance induced by absorbing aerosols may be instrumental in triggering dynamical feedback in the monsoon water cycle. For aerosol observations, we will use the Total Ozone Mapping Spectrometer (TOMS) Aerosol Index (AI). The TOMS AI is a measure of the wavelength-dependent change in Rayleigh-scattered radiance from aerosol absorption and is especially suitable for detecting the presence of absorbing aerosols above high reflecting surfaces, such as desert, and snow/ ice over land, where MODIS has difficulties (Hsu et al. 1999). The AI data set is the only long-term continuous daily global record for absorbing aerosols (mainly black carbon and dust). It starts in November 1978 and, with the exception of a data gap from May 1993 to August 1996, runs to the present.
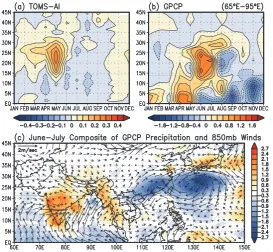
Figure 1a shows the April-May climatological (1979-1992) distribution of AI over the greater Indian monsoon region. Three major source regions can be identified: I) The Ganges Plain over northern India (marked by the rectangular box in the figure), II) Saudi Arabia and the Iran/Afghanistan/Pakistan deserts, and III) Western Asia over the Taklamakan desert. The interannual variability of the aerosol loading (Fig. 1b) is found to be about 10-15% of the bimonthly mean, and is strongest over the Middle East region, but also significant over region I and III. Aerosol radiative forcing from these regions may alter the large-scale thermal contrast in the troposphere and between the land surface and the adjacent oceans. In addition, dusts from Regions II may be transported to Region I, and mix with the black carbon produced from local emissions, further altering the atmospheric heat source and sink distribution. Since aerosol emission and transport is dependent on the soil types, the winds and the rainfall, the total dust loading in all three source regions undergo multi-scale variability associated with the monsoon climate system. The AI index in Region I (Fig. 1c) shows the strong seasonality of the aerosol loading, with increasing concentration in boreal spring (March-April-May), maximum near the latter part of May, and reducing concentration in fall and winter. The yearly variability as well as the intraseasonal variability of aerosol amount is quite obvious. Some years, the removal of aerosol from the atmosphere is very rapid, reaching minimum level days after the Indian monsoon onset in early-to-mid June, e.g. 1988. Other years, the aerosol removal is much slower, e.g. 1987. The year 1987 (1988) is well known as a weak (strong) monsoon year. The real question here is whether aerosol is a contributing factor to the monsoon anomaly.
The latitude-time cross sections of composite of four years (1980, 1985, 1988, 1991) of high AI anomaly (Fig. 2a, page
17), shows a slow build up of the aerosol loading up to May, and the rapid removal in June-July-August during the monsoon season. There appears to be a northward migration of rainfall anomaly from equatorial oceanic region to the monsoon land region, and an intensification of the monsoon rainfall (15°N–25°N) in June-July (Fig.2b), following the aerosol build-up in May. Over the Indian subcontinent, the rainfall season seems to have advanced with more rain appearing in the early part, and less rain in the latter part of the season. Fig. 2c shows that the rainfall increase in June-July is pan-India, with most pronounced signal over the Western Ghats, and the land region around the Bay of Bengal. The strengthened Indian monsoon is evident in the anomalous low level westerlies over the Indian subcontinent. Over East Asia, a strong anticyclonic anomaly is found, suggesting an intensification, and a westward shift of the Western Subtropical High. As a result, the Mei-yu rainbelt is pushed north of the Yangtze, and eastward over Japan, giving rise to the characteristic north-south dipole rainfall anomaly over East Asia (Lau et al. 2000). The aforementioned results suggest that the large-scale dynamical structure of the entire Asian monsoon system may have been modified by the aerosol forcing.
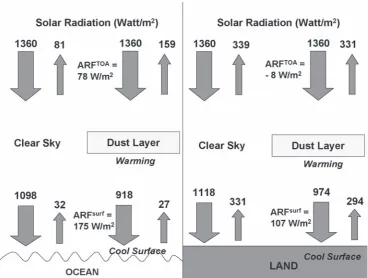
How can absorbing aerosols over Asia continent trigger a large-scale dynamical monsoon response? We recall that the net radiative effect of aerosols on the atmosphere and the surface depends not only on the aerosol type but also on the albedo and the temperature of the underlying surface. Fig. 3 shows the radiative balance at the top of the atmosphere and at the earth’s surface for an amount of desert dust with optical thickness equal to unity over land (albedo = 0.35), and over ocean (albedo = 0.03). The spectral dust properties used in the calculations are based upon values reported in OPAC (Optical Properties of Aerosols and Clouds) for 0.5 µm dust particles (Hess et al. 1998), in which the corresponding equivalent broadband single scattering albedo is approximately 0.92. The calculation is conducted using a climatological atmospheric temperature and moisture sounding over land and ocean, respectively. The net aerosol forcing is defined as the difference in total radiation flux between a pristine atmosphere and a dusty atmosphere.
When we look at aerosol forcing over land and ocean surfaces for these conditions we find that the total atmosphere-land system warms by 8 Wm-2, while the
total atmosphere-ocean system cools by 78 Wm-2. For
the atmospheric component itself (surface minus top-of-atmosphere), our calculations show that the atmosphere over the ocean is heated by 97 Wm-2, while over land the
atmospheric heating is significantly stronger at 115 Wm-2.
Himalayas, that the aerosol forcing, combined with the sensible heat flux from the dust layer to the surface, may reverse the sign of the net aerosol forcing at the surface and cause the land surface to warm. The reversal of the meridional gradient in upper tropospheric temperature between the Tibetan Plateau and the oceanic region to the south is known to have a strong control on the timing of the onset and evolution of the Asian monsoon (Li and Yanai, 1996). Therefore, it is possible that, the aerosol-induced differential heating in late spring, amplified through the “elevated heat pump” effect may cause an early reversal of such a temperature gradient subsequently leading to an advance of the monsoon season, and an intensification via induced feedback processes associated with the monsoon water cycle.
Reference
Hess, M, P. Koepke, and I. Schult , 1998: Optical Properties of Aerosols and clouds: The software package OPAC, Bull. Am. Met. Soc., 79, 831-844.
Hsu, N.C., J. R. Herman, , J. F. Gleason, , O. Torres, , and C. J. Seftor, 1999: Satellite detection of smoke aerosols over a snow/ice surface by TOMS. Geophys. Res. Lett., 26, 1165-1168.
Lau, K. M., K. M. Kim, and S. Yang, 2000: Dynamical and Boundary Forcing Characteristics of regional components of the Asian summer monsoon. J. Climate,
13, 2461-2482.
Lau, K. M., M. K. Kim and K. M. Kim, 2005: Asian monsoon anomalies induced by aerosol direct effects. Nature, submitted.
Li, C, and M. Yanai, 1996: The onset and interannual variability of the Asian summer monsoon in relation to land-sea
thermal contrast. J. Climate 9, 358-375.
Menon, S., J. Hansen, L. Nazarenko, and Y. Luo (2002), Climate effects of black carbon aerosols in China and India, Science, 297, 2250-2253.
Ramanathan V., C. Chung, D. Kim, T. Betge, L. Buja, J. T. Kiehl, W. M. Washington, Q. Fu, D. R. Sikka, and M. Wild, 2005: Atmospheric brown clouds: impacts on South Asian climate and hydrological cycle. Proc. Natl. Acad. Sci., 102, 5326-5333.www.pnas.org/cgi/doi/10.1073/ pnas.0500656102.
[image:9.595.116.485.76.354.2]Stanhill, G., and S. Cohen, 2001: Global dimming, a review of the evidence for a widespread and significant reduction in global radiation with a discussion of its probable causes and possible agricultural consequences. Agric. For. Meteorol., 107, 255-278.
1.Introduction
The most important Intra Seasonal Oscillation (ISO) of the Indian summer monsoon is the Active – Break cycle - Rao (1976). The cross equatorial Low Level Jetstream (LLJ) of the monsoon found by Joseph and Raman (1966) and Findlater (1969) with its core near 850 hPa level is closely associated with this cycle. Joseph and Sijikumar (2004) found that during active monsoon spells, the core of the LLJ passes through peninsular India between latitudes 12.5oN and 17.5oN and is associated with a large area of
strong cumulonimbus convection in the Bay of Bengal. When the convection weakens there, the LLJ turns clockwise over the Arabian Sea and during the break monsoon that follows the LLJ bypasses India and flows with its core between latitudes 2.5oN and 7.5oN. They also
found that the strength of the convective heat source as represented by the Outgoing Longwave Radiation (OLR) over the Bay of Bengal and the strength of the zonal wind at 850 hPa through peninsular India (LLJ) both between latitudes 10oN and 20oN have the highest linear
correlation at a lag of 2 to 3 days, OLR leading.
Krishnamurti et al (1988) established an association between the active – break cycle and the fluctuations of Sea Surface Temperature (SST) of the Bay of Bengal. A recent study with data from moored buoys in the north Bay of Bengal (Sengupta and Ravichandran, 2001) has shown a large amplitude ISO of SST during the monsoon season of 1998. Measurements in the Bay of Bengal
A Cold Pool In The Bay Of Bengal And Its Interaction With The Active-break Cycle Of Monsoon
P V. Joseph, K.P. Sooraj, C.A. Babu and T.P.Sabin Department of Atmospheric Sciences
Cochin University of Science and Technology Fine Arts Avenue, Cochin –682 016, INDIA
Corresponding author: [email protected]
during field experiments such as BOBMEX (Bhat et al, 2001) and JASMINE (Webster et al, 2002) have shown large amplitude ISO in the net heat flux. There is thus the possibility of active ocean – atmosphere interaction in the active – break cycle of the monsoon.
Since 1998 we have good measurements of 3 day composite SST on a 25 km grid from TRMM Microwave Imager (TMI) for the global region between latitudes 40oS and 40oN. The accuracy of the TMI SSTs is roughly
0.5oC (Wentz, 1998). TMI SST compare well with buoy
measured SST in Bay of Bengal (Senan et al 2001). Thus TMI gives accurate and reliable SST measurements at high resolution.
2.The ‘Cold Pool’ of Bay of Bengal
Using TMI SSTs we report on the existence of a large tongue of cold water in the Bay of Bengal during the monsoon season in the latitude belt 3oN to 10oN. It is
inbetween two warm pools one around the equator and the other in the north Bay of Bengal. Composite monthly TMI SST of the six years 1998-2003 of June, July and August are shown in Fig.1 (page 17). In the latitude belt 3oN to 10oN a narrow tongue of low SST
[image:10.595.174.425.531.741.2]is seen in June, which expands in length (east -west) and width (north –south) during the following July and August. We have named this the ‘Cold Pool’ of the Bay of Bengal. From June to August the temperature of the Cold Pool falls. It is well known that low level winds of the summer monsoon have an along–shore
Figure 2: Daily 850 hPa zonal wind in ms-1 averaged over the area 70oE-95oE, 12.5oN-17.5oN for the monsoon of 1998. The active
(a)
(b)
Figure 4: (a) Variation of SST gradient in oC (mean SST of
warm pool box minus mean SST of Cold Poolbox as defined in the text) during monsoon 1998. (b) Hovmuller diagram of OLR in Wm-2 averaged over longitudes 80oE to 100oE (Bay of
Bengal) during 01 June to 30 September 1998.
(a)
(b)
Figure 5: Mean 10m wind during a) 17 to 21 July 1998 and b) 20 to 24 August 1998 showing the wind flow over the Bay of Bengal during typical break monsoon spells.
component over the west coast of Kerala (India) and Sri Lanka which generate strong coastal upwelling. The cold pool could be due to the spreading east of this upwelled cold water by the ocean currents in the Bay of Bengal. That suitable currents exist there has been shown by Vinayachandran et al (1999). Open ocean upwelling during break monsoon spells as described later in section-5 may also contribute.
3.Active – Break Cycle of Monsoon
The studies of Sikka and Gadgil (1980), Yasunari (1981) and Krishnamurti and Subramanyam (1982) have shown a prominent northward propagating monsoon ISO. The picture that emerged from these studies is that an east-west elongated band of deep convection associated with strong monsoon low level westerlies forms near the equatorial Indian Ocean and moves north to the Himalayas at a speed of about half to one degree latitude per day. When the convective band is in the latitude range 10oN-20oN we get an active monsoon,
with strong winds at 850 hPa through peninsular India. When the convective cloud band moves north to 20oN
-30oN another convective band forms near the equator.
This state is the break monsoon. This sequence gets repeated 1-3 times during a monsoon season June to September. Koteswaram (1950) had shown that during the break monsoon spells, low pressure areas form in the Bay of Bengal between latitudes 10oN and 15oN.
These lows give widespread rainfall in this latitude belt and the movement of this rain belt northwards brings about active monsoon conditions. From an examination of OLR data of several years it is seen that during the break monsoon, convection forms between the equator and latitude 10oS, but for the break to active transition
it is the convection forming north of the cold pool that moves to the northern Bay of Bengal. It appears that the cold pool area is not favourable for deep convection. The current models of northward propagating ISO of monsoon convection require revision.
4. Active-Break cycle of 1998
Active and break monsoon spells could be identified using the 850 hPa wind field as done in several research works of recent decades discussed in Joseph and Sijikumar (2004). Fig.2 gives the variation of the daily zonal wind of 850 hPa level averaged over an area bounded by latitudes 12.5oN and 17.5oN and longitudes
70oE and 95oE for the period of 01 June to 30 September
1998. The strongest winds are during active monsoon conditions. During breaks the wind in this box is very weak. Thus during the monsoon of 1998 there were three active spells and 3 break spells.
Fig. 3 (page 17) gives a Hovmuller diagram of TMI SST for 01 June to 30 September 1998 averaged between longitudes 83oE and 95oE. In the latitude belt 15oN to
[image:11.595.46.297.69.336.2] [image:11.595.321.556.432.740.2]by Vecchi and Harrison (2002). A prominent ISO in SST is also seen in the Cold Pool area. It is seen that during break monsoon spells the SST in the box (15oN-20oN,
83oE-95oE) covering north Bay of Bengal warms rapidly
and that in the Cold Pool box (03oN-10oN, 83oE-9oE)
cools, thus making the SST gradient between the two boxes relatively large as may be seen in Fig.4(a). We speculate that one of the factors for the generation of active monsoon convection over the Bay of Bengal is the SST gradient as per the mechanism suggested by Lindzen and Nigam (1987). Vecchi and Harrison (2002) also suggest a similar mechanism but their SST gradient is caused by the variation of SST in the north Bay warm pool box only, where SST variations are caused by variations in net heat flux which is controlled by the surface wind and the convection.
5. ISO of SST in the Cold Pool.
What makes the SST in the Cold Pool area have a strong ISO? In this area SST rapidly cools during break monsoon spells. Joseph and Sijikumar (2004) have shown that the axis of the LLJ is around latitude 5oN during breaks when
the cyclonic wind shear zone of the LLJ is over the Cold Pool. Fig.5 shows the wind flow at 10 m level obtained from NCEP reanalysis during two break monsoon spells of 1998. The Cold Pool has strong forcing by cyclonic wind stress curl that can induce strong open ocean upwelling there.
6. Conclusion.
It is seen that the warm pool of the north Bay of Bengal and the newly discovered Cold Pool of south Bay of Bengal have prominent roles in the active break cycle of monsoon. Lead - lag correlation between the daily SST gradient and the daily mean OLR over the Bay of Bengal shows almost simultaneous and large positive correlation of 0.67, which shows that SST gradient becomes large when the Bay of Bengal is cloud free, that is during break monsoon spells. From Fig.4, It is seen that when SST gradient reaches a maximum, convection is triggered just north of the Cold Pool, which later moves north and amplifies taking THE monsoon to an active spell.
7. References.
Bhat, G.S, S. Gadgil, P. V. Hareesh Kumar, S. R. Kalsi, P. Madhusoodanan, V. S. N. Murty, C. V. K. Prasada Rao, V. Ramesh Babu, L. V. G. Rao, R. R. Rao, M. Ravichandran, K. G. Reddy, P. Sanjeeva Rao, D. Sengupta, D. R. Sikka, J. Swain, and P. N. Vinayachandran, 2001: BOBMEX: The Bay of Bengal Monsoon Experiment, Bull. Amer. Meteorol. Soc., 82, 2217-2243
Findlater.J, 1969: A major low level air current near the Indian Ocean during the Northern Summer, Quart. J. Roy. Meteor. Soc., 95, 362-380.
Joseph P.V. and P.L. Raman, 1966: Existence of Low Level westerly jet stream over Peninsular India during July, Indian J. Meteorol. and Geophys., 17, 407-410.
Joseph P.V and S Sijikumar, 2004: Intra Seasonal Variability of the Low-Level Jet stream of the Asian Summer Monsoon, J. Climate, 17, 1449-1458.
Koteswaram, P., 1950: Upper level lows in low latitudes in the Indian area during southwest monsoon and ‘breaks’ in the monsoon. Ind. J. Meteor. Geophys., 1,162-174
Krishnamurti, T.N, and D, Subramanyam, 1982: The 30-50 day mode at 850 hPa during MONEX. J. Atmos. Sci., 39, 2088-2095
Krishnamurti, T.N, D.K, Oesterhof, and A.V, Mehta, 1988: Air-sea interaction on the time scale of 30 to 50 days. J. Atmos. Sci., 45, 1304-1322.
Lindzen, R. S., and S. Nigam,1987: On the Role of Sea Surface Temperature Gradients in Forcing Low-Level Winds and Convergence in the Tropics. J. Atmos. Sci., 44, 2418-2436.
Rao Y.P, 1976: South West Monsoon, India Meteorological Department, Meteorological Monograph- Synoptic Meteorology No. 1/ 1976, Delhi, 367 pages.
Senan, R., D.S, Ajith, and D, Sengupta, 2001: Validation of SST and wind speed from TRMM using north Indian Ocean moored buoy observations. Indian Institute of Science Tech. Memo. CAOS Rep. 2001 ASI, Bangalore, India, 29pp.
Sengupta, D and M., Ravichandran, 2001: Oscillation of Bay of Bengal sea surface temperature during the 1998 summer monsoon., J. Geophys. Res., 28, 2033-2036.
Sikka.D.R and S., Gadgil, 1980: On the maximum Cloud zone and the ITCZ over Indian longitudes during the southwest monsoon, Mon. Wea. Rev., 108, 1840-1853. Vecchi, G.A., and D.E. Harrison, 2002: Monsoon Breaks and
Subseasonal Sea Surface Temperature Variability in the Bay of Bengal. J. Climate, 15, 1485-1493.
Vinayachandran, P.N., Y. Mausumoto, T. Mikawa, and T. Yamagata, 1999: Intrusion of the Southwest Monsoon Current into the Bay of Bengal. J. Geophys. Res, 104,
11077-11085
Webster, P.J, E. F. Bradley, C. W. Fairall, J. S. Godfrey, P. Hacker, R. A. Houze Jr., R. Lukas, Y. Serra, J. M. Hummon, T. D. M. Lawrence, C. A. Russell, M. N. Ryan, K. Sahami and P. Zuidema, 2002: The JASMINE Pilot Study, Bull. Amer. Meteorol. Soc., 83, 1603-1630.
Wentz, F.J., 1998: Algorithm theoretical basis document: AMSR Ocean Algorithm. Remote Sensing System Tech Rep. 110398, Santa Rosa, CA, 65 pp.
Yasunari, T, 1981: Structure of an Indian summer monsoon system with around 40-day period. J. Met. Soc. Japan,
1. Introduction
Climate modeling groups around the world have been performing an unprecedented set of coordinated 20th and 21st century climate change experiments, in addition to commitment experiments extending to the 22nd century for the Inter-governmental Panel on Climate Change Fourth Assessment Report (IPCC AR4). The resulting multi-model dataset is a unique resource to assess model performance, model sensitivity and model response to a variety of forcing for the 20th through the 22nd century climate and climate change.
The importance of the monsoon rainfall over a vast populated India, in excess of one billion, as a socio-economic feature with its impacts on the agricultural output and the national economy has been well documented. A recent United Nations report also forecasts that India will surpass China as the world’s most populous nation by 2030. India is estimated to reach a population of 1.593 billion by 2050. Thus this region of high human population and significant monsoon related economy and food production could be highly vulnerable to climate variability/change. Hence the variation in seasonal monsoon rainfall may be considered as a measure to examine climate variability/change over the Indian monsoon domain in the context of global warming.
In view of the above we have analyzed the 20th century simulated summer monsoon (June through September) precipitation over the Indian landmass and neighborhood for all the available models and runs (to date) with respect to the annual cycle, spatial patterns and inter-annual variability (Kripalani et al 2005). These simulated features are compared with the observed features and how well the models agree with each other. Based on this analysis three models viz. (i) Meteo-France/Centre National de Recherches Meteorologiques, France (acronym cnrm_cm3); (ii) Center for Climate System Research (The University of Tokyo), National Institute for Environmental Studies and Frontier Research Center for Global Change (JAMSTEC): Model for Interdisciplinary Research on Climate, Japan (acronym miroc3_2_hires) and (iii) Hadley Center for Climate Prediction and Research / Met Office, UK (acronym ukmo_hadcm3) are selected to examine future precipitation projections.
2. Data and methodology
The IPCC standard output from coupled ocean-atmosphere GCMs is collected and archived by the JSC/ CLIVAR WGCM (Working Group on Coupled Models) Climate Simulation Panel and the Program for Climate Model Diagnosis and Inter-comparison (PCMDI) at the Lawrence Livermore National Laboratory, USA. For
South Asian Monsoon Precipitation Variability: Coupled Climate Model Projections under IPCC AR4
R.H. Kripalani, A Kulkarni and S.S. Sabade
Indian Institute of Tropical Meteorology, Pune 411008, India Corresponding author: [email protected]
the status of the IPCC database, model documentation, related references and other information one can visit the website http://www-pcmdi.llnl.gov/ipcc/info_for_ analysts.php.
One of the highest priority output fields is the precipitation flux (variable name: pr; units: kg/m2/s; multiplying by
86400 gives the value in units of mm/day). The monthly data for this variable for the models and all the available runs (based on different initial conditions) under the control run (acronym ‘20c3m’) were downloaded. There are several scenarios under which projections are available. Here we restrict our analysis and examine transient runs under the 1% per year compounded increase in CO2 until CO2 doubling (experiment acronym
‘1pctto2x’) and held constant thereafter. Results of the transient run (experiment ‘1pctto2x’) are compared with control run (‘20c3m’) results.
For all the 3 models runs for 80 years are available under the 1% per year CO2 increase experiment. However for
the model cnrm_cm3 only a further run of 90 years is available under the CO2 stabilization period. We analyze
time slices for the period centered at the time of doubling (i.e. idealized years 61-80 of the transient run designated here as transient1) and, for model cnrm-cm3, 20 years at the end of the CO2 stabilisation period(transient2). These time-slice projections are compared with the mean simulated climatology for the last 20 years under the ‘20c3m’ experiments (control) with the respective models.
3. Projections
3.1 Projected Spatial Patterns
The projected spatial patterns of seasonal rainfall (Figure 1 (page 18)) are depicted as differences from the control expressed as a percentage of the corresponding control rainfall. On an average model cnrm_cm3 shows an increase of 5 to 10% over the land area around the time of CO2 doubling (Figure 1 (page 18) top left). Even
after CO2 stabilization (top right) there appears to be no
0 20 40 60 80 100 120 140 160 Years into run
600 700 800 900 1000 1100
mm / season
850.3 mm
10 %
20 %
cnrm_cm3
[image:14.595.117.486.73.310.2]CO2 increasing CO2 stabilised
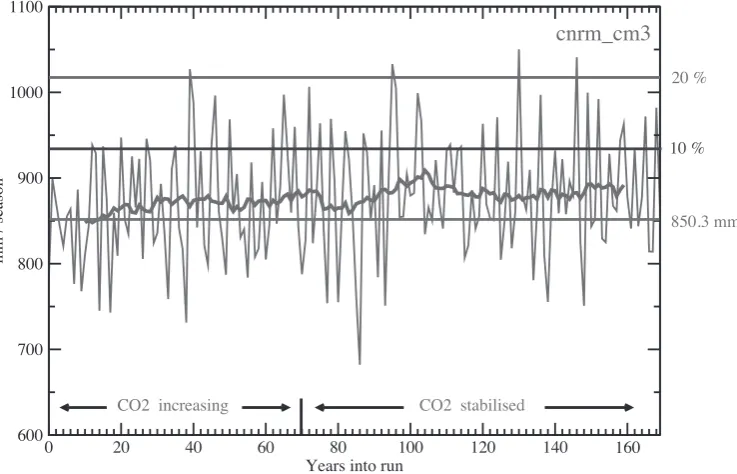
Figure 2: Time series plot of the seasonal rainfall over India for the transient CO2 doubling and stabilization scenarios for the cnrm_cm3 coupled model. The horizontal line of 850.3 mm depicts the control run mean for this model. Lines at 10% and 20% represent values with respect to the control run mean. The solid line super-imposed on the inter-annual variations is a smoothed 21-year low pass filter.
southeast peninsula, and project low rainfall increases (and in the case of cnrm-cm3, a decrease over the oceanic equatorial convergence zone.
3.2 Committed Changes after CO2 Stabilization
Out of the 3 models discussed, an extended run for the CO2 stabilized period is available for the cnrm_cm3
model only. Hence we examine the committed changes / projections based on this model in a little more detail. Time series of the summer monsoon rainfall for this model under the control and transient runs have been prepared by averaging rainfall over the Indian landmass. The transient plot is shown in Figure 2. During the period of CO2 increase, the rate of increase of precipitation
appears to be practically constant till the time of doubling and reaches about 4 % in excess of control Thereafter during the period the CO2 is held constant and allowed
to stabilize, the precipitation rate increases faster for about three decades, followed by a decrease with the rate remaining constant thereafter at about 5 % in excess of control
The observed Indian monsoon rainfall exhibits considerable inter-decadal variability with alternate epochs, which last for about 3 decades, of above and below normal rainfall (e.g. Kripalani et al. 2003). Webster et al. (1998) attribute inter-decadal variability of the Pacific Ocean to be the primary factor for decadal scale variation of monsoon activity. Changes in solar irradiance may also be a probable source of this variability. Further the Indian monsoon rainfall also exhibits biennial oscillation (Meehl 1997). Hence to examine whether these dominant low-frequency modes in the seasonal rainfall time series are likely to change in the warming world, wavelet
analysis is applied to the control run (‘20c3m” 1860-1999) and the transient (‘1pctto2x’ 1860-2029) run series for the cnrm_cm3 model. Wavelet transform (WT) is a common tool for analyzing localized variation of power within a time series. By decomposing a time series into time-frequency space, one is able to determine both the dominant modes of variability and how those modes vary in time (Torrence and Compo 1998). The computational procedure/algorithm for WT is available on website http://ion.research-systems/IONscript/wavelet. The wavelet spectrum for the control and transient run is shown in Figure 3 (page 18). The wavelet spectrum for the control run reveals that in general the maximum variance (red color) is centered in the low-frequency 8-64 year periodicity (above panel). However for the transient run during the CO2 stabilized (lower panel after year 1930)
NEW BOOK
EAST ASIAN MONSOON
Edited by C-P Chang (Naval Postgraduate School, USA) 564pp, ISBN 981-238-769-2, November 2004 http://www.worldscibooks.com/environsci/5482.html
Contents:
•East Asian Summer and Winter Monsoon
Seasonal march of East Asian monsoon (Y Ding, Natl Climate Ctr China); Eastern Asian winter monsoon (J Chan, City U Hong Kong, C Li, Chinese Acad Sci); Maritime Continent monsoon (C-P Chang, P Harr; NPS, J McBride BMRC Australia, H Hsu, Natl Taiwan U).
•Interannual Variations
Interannual variability, global teleconnection, potential predictability associated with Asian summer monsoon (W K M Lau, K Kim, J Li; GSFC/NASA); East Asian monsoon-ENSO interactions (B Wang, T Li, U Hawaii); Climate variations of summer monsoon over China (R Huang, CAS).
•General Circulation Modeling
Coupled atmosphere-ocean model simulations of ENSO-related variability (N-C Lau, M Nath, H Wang, Princeton U); Current status of AGCM monsoon simulations (I-S Kang, Seoul Natl U); Simulation studies using the CCSR/NIES AGCM (A Sumi, X Shen, M Kimoto, U Tokyo).
•Synoptic and Mesoscale Processes
Meiyu research during the past quarter century (G T-J Chen, NTU); Large and mesoscale features of Baiu front (K Ninomiya, FRSGC Japan); Oceanic Asian monsoon convection: Results from SCSMEX (R Johnson, P Ciesielski, Colorado State U, T. Keenan, BMRC Australia).
•Interactions with Other Circulations
Monsoon-related tropical cyclones in East Asia (R Elsberry, NPS); Subtropical anticyclone dynamics (G Wu, Y Liu, P Liu, CAS); Maintenance and seasonal transitions of the stationary waves during East Asian monsoon (M Ting, Columbia U, R Joseph, U Illinois).
4. Summary
Future monsoon precipitation scenarios are examined with respect to 3 models. For country as a whole precipitation is projected to increase by about 5%, but regional precipitation over northwest India and southeast peninsula is projected to increase by about 40%. Wavelet Analysis suggests that in the warming world, the low frequency monsoon variability normally associated with the decadal Pacific variability may shift to high frequency variability related with the biennial Indian Ocean Oscillation.
Acknowledgements
We acknowledge the international modeling groups for providing their data for analysis, the Program for Climate Model Diagnosis and Inter-comparison (PCMDI) for collecting and archiving the model data, the JSC/CLIVAR Working Group on Coupled Modeling (WGCM) and their Coupled Model Inter-comparison Project (CMIP) and Climate Simulation Panel for organizing the model data activity, and the IPCC WG1 TSU for technical support. The IPCC Data Archive at Lawrence Livermore National Laboratory is supported by the Office of Science, U.S. Department of Energy. Finally, thanks are due to Dr. G.B.
Pant, Director, Indian Institute of Tropical Meteorology for encouragement and providing all the facilities to carry out this work at this institute.
References
Kripalani RH, Kulkarni A, Sabade SS and Khandekar ML. 2003. Indian monsoon variability in a global warming scenario. Natural Hazards 29: 189-206.
Kripalani RH, Kulkarni A and Sabade SS. 2005. Indian summer monsoon precipitation variability: Evaluating coupled climate model simulations and projections under IPCC AR4. International Journal of Climatology (submitted) Meehl GA. 1997. The south Asian monsoon and the tropospheric
biennial oscillation. Journal of Climate 10: 1921-1943. Meehl GA and Arblaster JM. 2003. Mechanisms for projected
future changes in south Asian monsoon precipitation. Climate Dynamics 21: 659-675
Torrence C and Compo GP. 1998. A practical guide to wavelet analysis. Bulletin of the American Meteorological Society
79: 61-78.
1. Introduction
The Maritime Continent is a large area of land-sea complex, consisting of Indonesia, Malaysia and the surrounding areas between 10ºS and 10ºN (Ramage 1968). The complex terrain gives rise to strong local variations of the rainfall annual cycle. In addition, the rainfall also exhibits significant interannual variations, and is subject to strong influences of intraseasonal and synoptic scale disturbances. This note is a summary of Chang et al. (2004a,b; 2005a,b).
2. Annual cycles and seasonal transitions
The annual cycle is dominated largely by interactions between the complex terrain and a simple annual reversal of the surface monsoonal winds throughout all monsoon regions, from the Indian Ocean to the equatorial western Pacific. Figure 1 (front cover) shows a clear demarcation of the boreal summer and winter monsoon regimes over the entire region, showing the two regimes intertwining across the equator. There are stronger intrusions of the winter regime northward into the summer regime due to strong northeasterly monsoon winds in the South China Sea and the western Pacific east of the Philippines. These monsoon winds produce strong onshore flow and excess rainfall along the eastern flanks of the major island groups and land masses. During boreal summer, the interaction between the southwest monsoon wind and terrain also affects strongly the distribution of the summer monsoon rainfall, with maximum rainfall occurring on the windward side of terrain in the Indian Ocean, the Indochina Peninsula, and the South China Sea.
Figure 2 (page 18) delineates the asymmetry of the seasonal march between boreal fall and boreal spring. During boreal fall the convection maximum occurs in the eastern Indian Ocean, Malay Peninsula and Sumatra, and southern South China Sea. This general area forms the midpoint of the path of the southeastward progression of convection from the Asian summer monsoon to the Asian winter monsoon. During boreal spring the maximum convection does not retrace the process but stays near and south of the equator. This asymmetric feature is a manifestation of the asymmetric locations of the spring and fall ITCZ noted by many investigators (e.g., Lau and Chan 1983; Meehl 1987; Yatsunari 1991; Matsumoto and Murakami 2000).
The cause of this asymmetry was analyzed from the spring-fall surface pressure differences. The result (not shown) suggests two possible effects: (1) the low-level wind and terrain interactions throughout the region during boreal fall that do not have counterparts in boreal spring, and (2) an intervening region between the equator and 20ºN in the longitudes of Southeast Asia / Maritime Continent that in the low levels has a
The Maritime Continent Monsoon
C.-P. Chang
Department of Meteorology, Naval Postgraduate School, Monterey, California, USA Corresponding author: [email protected]
convergence tendency in boreal fall and a divergence tendency in boreal spring. Both effects can be related to the SLP differences between spring and fall that appear to be the result of the global-scale mass redistribution between the land and ocean regions, which is driven by their different thermal memories. Because of the orientation of the Asian and Australian landmasses, this redistribution facilitates the southeastward march of maximum convection from the Asian summer monsoon to the Asian winter (Australian summer) monsoon, but it deters the reverse march in boreal spring.
3. Interactions of cold surges, synoptic disturbances, and MJO
The western part of the Maritime Continent that surrounds the equatorial South China Sea is influenced by large-scale disturbances that vary over a wide range of time scales: the quasi-biweekly cold surges from the north, the intraseasonal Maddan-Julian Oscillation (MJO) from the west, and the synoptic-scale vortices near the west coast of Borneo. Due to the interaction between northeast monsoon winds and the terrain, these Borneo vortices have the highest frequency of occurrence than any other quasi-stationary synoptic disturbance in the entire equatorial belt.
Nearly 1/3 of boreal winter days have one or more vortex centers in the western Borneo-southern South China Sea region. In days without a Borneo vortex, deep convection tends to be suppressed over the South China Sea and Borneo and enhanced downstream over the landmasses on the western and southern peripheries of the equatorial South China Sea. The pattern is reversed in days with a vortex. The presence of a cold surge enhances these two opposite patterns (Figs. 3a and 3b, page 19). Convection over the southern South China Sea is strongest when both surge and vortex cases are present (Fig. 3b). An extreme case of the interaction between a strong cold surge and a Borneo vortex is the rare formation of Typhoon Vamei near the equator on 26 December 2001 (Chang et al. 2003). However, such a formation is extremely rare because cold surges tend to shift the vortex center towards Borneo, where the vortex is unlikely to intensify into tropical cyclone strength over land.
The frequency of cold surges and vortex days is reduced during periods when the MJO is present, often as a result of the MJO-scale circulation pattern which tends to directly oppose the cold surge wind pattern. Within a MJO cycle the wet phase is associated with a higher cold surge frequency than the dry phase. Primarily due to the impact of the MJO on cold surge intensity and frequency, two-third of the vortex cases occur during non-MJO periods. The Borneo vortex is least likely to appear when the dry phase of the MJO extends to the Maritime
From Lau et al (page 7) Observational evidenc eof effects of absorbing aerosols on season-to-interanuula anomalies of the Asian Monsoon
Figure 2 Time-latitude cross-sections showing composite seasonal evolution during year of high AI of a) the AI anomalies, and b) the observed rainfall anomalies, and c) composite of rainfall and 850 hPa wind pattern during years of high AI anomalies.
From Joseph et al page 10: A Cold Pool in the bay of bengal and its interaction with the active-break cycle of monsoon
Figure 1: Composite SST (TMI) in oC for a) June, b) July and
[image:17.595.58.260.422.747.2]c) August (1998-2003)
Figure 3: Hovmuller of SST (TMI) in oC averaged over longitudes
83oE-95oE for monsoon 1998. The cold pool between 3oN and
10oN is marked by the lines. The warm pool SST variations are
From Kripalani et al, Page 13: South Asian Monsoon Precipitation Variability: Coupled Climate Model Projections under IPCC AR4
[image:18.595.40.277.109.446.2]Fig. 1: Spatial patterns of seasonal rainfall as differences between the transient and the control runs expressed as a percentage of the corresponding control (control: average of last 20 years of control run; transient1: average of 20 years centred at the time of CO2 doubling; transient2: average of last 20 years of the CO2 stabilization period)
Fig. 2 Monsoon Regimes during transition seasons as defined by TRMM PR rainfall. Warm colors are the boreal fall monsoon regime and cool colors are the boreal spring monsoon regime. The regimes are identified if the rainfall during one of these two seasons is the maximum in the annual cycle, and the values plotted are the differences from the rainfall of winter or summer whichever is highest. QuikSCAT winds of the two seasons are plotted for the entire domain.
From C-P Chang page 16: The Maritime Continent Monsoon
[image:18.595.315.530.121.397.2] [image:18.595.99.506.490.734.2]From Zhao et al, page 24: Ccharacteristics of diurnal variations of rainfall in China for the recent years
Fig.3 Mean hours of maximum rainfall in summer of 2002~2004 (left) and ratio (%) of convective rain and total rain in summer of 2004 (right) (calculations from TRMM data
[image:19.595.50.550.402.576.2]Fig.4 the same as Fig.1 except for June, July and August (from left to right)
Fig. 3 Composite maps of convective index and 925 hPa winds(m s-1) for (a) surge and no vortex cases, and (b) surge and vortex cases.
[image:19.595.51.521.616.749.2]Fig. 1 - Time series of the RMS errors of precipitation forecasts from four 4 FSU models, ensemble mean and synthetic superensemble mean over the South America from DJF 1997/98 to 2002/03 (mm/day). The average over whole period is showed in the right side
From Chaves et al (page 30): Seasonal Climate Prediction for South Amerrica with FSU Multi-model Synthetic superensemble Algorithm.
From Druyen et al, page 34: Mesoscale climate analysis over West Africa
-20 -15 -10 -5 0 5 10 15 20 25
31
26
21
16
11
6
1
longitude
3 6 9 12 15 18 21 24
mm/day
-20 -15 -10 -5 0 5 10 15 20 25
31
26
21
16
11
6
1
longitude
3 6 9 12 15 18 21 24
mm/day
[image:20.595.169.427.444.711.2]Continent with large-scale low-level diffluence that acts to restrict the impact of cold surges on convection in the southern South China Sea. This complex relationship among MJO, cold surges and the Borneo vortex and the effects of the topography contribute to the variability in western Maritime Continent convection patterns during boreal winter.
4. Relationship with ENSO
There is considerable influence of ENSO on the Indonesian and Australian rainfall but the impact is very weak during the boreal winter season (e.g., McBride and Nicholls 1983; Hendon 2003). The strong effect of the wind-terrain interactions over the Maritime Continent region may lead to local rainfall-ENSO relationships that vary among different sub-regions during northern winter, when the region is affected by cold surges from the north, Indian Ocean zonal wind anomalies from the west, and cross-equatorial flow from the south. During 1979-2002 the correlations between DJF rainfall and Nino3 SST (Fig. 4) are mostly negative over a significant part of the region except in the vicinity of Sumatra and Malay Peninsula, where the correlations range from zero to weakly positive. Thus, low correlations between Indonesian monsoon rainfall and ENSO may result from averaging of rainfall in regions with opposite characteristics. There is also an interdecadal change around the late 1970s with an overall trend that the rainfall is more negatively correlated with ENSO in the recent decades. However, the correlations remain lower than those of the dry (boreal summer) and transition (boreal fall) seasons. This is especially so for January, which has consistently insignificant correlations for all regions and decadal periods.
References:
Chang, C.-P., C. H. Liu, and H. C. Kuo, 2003: Typhoon Vamei: An equatorial tropical cyclone formation. Geophys. Res. Lett., 30, 50 1-4.
——, P. A. Harr, J. McBride, and H. H. Hsu, 2004a: Maritime Continent monsoon: Annual cycle and boreal winter variability. East Asian Monsoon., ed. by C. P. Chang, World Scientific Series on Meteorology of East Asia. Vol. 2, 107-150.
——, Z. Wang, J. Ju, and T. Li, 2004b: On the relationship between western Maritime Continent monsoon rainfall and ENSO during northern winter. J. Climate, 17, 665-672.
——, P. A. Harr, and H. J. Chen, 2005a: Synoptic disturbances over the equatorial South China Sea and western Maritime Continent during boreal winter. Mon. Wea. Rev., 133, 489-503.
——, Z. Wang, J. McBride, and C. H. Liu, 2005b: Annual cycle of Southeast Asia - Maritime Continent rainfall and the asymmetric monsoon transition. J. Climate, 18, 287-301.
Hendon, H. H. 2003: Indonesia rainfall variability: Impacts of ENSO and local air-sea interaction. J. Climate, 16,
1775–1790.
Lau, K. M. and P. H. Chan, 1983: Short-term climate variability and atmospheric teleconnections from satellite-observed outgoing longwave radiation. Part II: Lagged correlations. J. Atmos. Sci., 40, 2751-2767.
Matsumoto, J. and T. Murakami, 2000: Annual changes of tropical convective activities as revealed from equatorial symmetric OLR Data. J. Meteor. Soc. Japan, 78, 543-561. McBride, J. L. and N. Nicholls, 1983: Seasonal relationships
between Australian rainfall and the Southern Oscillation. Mon. Wea. Rev., 111, 1998-2004.
Meehl, G. A., 1987: The annual cycle and interannual variability in the tropical Pacific and Indian Ocean region. Mon. Wea. Rev., 115, 27-50.
Ramage, C. S., 1968: Role of a tropical “Maritime Continent” in the atmospheric circulation. Mon. Wea. Rev., 96, 365-369.
[image:21.595.42.400.550.783.2]Yasunari, T., 1991: The monsoon year - a new concept of the climatic year in the tropics. Bull. Amer. Meteor. Soc., 72, 1331-1338.