0022-538X/04/$08.00⫹0 DOI: 10.1128/JVI.78.11.5820–5834.2004
Copyright © 2004, American Society for Microbiology. All Rights Reserved.
Microarray Analysis Reveals Characteristic Changes of Host Cell Gene
Expression in Response to Attenuated Modified Vaccinia Virus
Ankara Infection of Human HeLa Cells
Susana Guerra,
1Luis A. Lo´pez-Ferna´ndez,
2Raquel Conde,
1Alberto Pascual-Montano,
3Keith Harshman,
2and Mariano Esteban
1*
Department of Molecular and Cellular Biology,1Department of Immunology and Oncology,2and Biocomputing
Unit,3Centro Nacional de Biotecnología, Consejo Superior de Investigaciones Científicas, Campus
Universidad Auto´noma, E-28049 Madrid, Spain
Received 5 December 2003/Accepted 23 January 2004
The potential use of the modified vaccinia virus Ankara (MVA) strain as a live recombinant vector to deliver antigens and elicit protective immune responses against infectious diseases demands a comprehensive under-standing of the effect of MVA infection on human host gene expression. We used microarrays containing more than 15,000 human cDNAs to identify gene expression changes in human HeLa cell cultures at 2, 6, and 16 h postinfection. Clustering of the 410 differentially regulated genes identified 11 discrete gene clusters with altered expression patterns after MVA infection. Clusters 1 and 2 (accounting for 16.59% [68 of 410] of the genes) contained 68 transcripts showing a robust induction pattern that was maintained during the course of infection. Changes in cellular gene transcription detected by microarrays after MVA infection were confirmed for selected genes by Northern blot analysis and by real-time reverse transcription-PCR. Upregulated tran-scripts in clusters 1 and 2 included 20 genes implicated in immune responses, including interleukin 1A (IL-1A), IL-6, IL-7, IL-8, and IL-15 genes. MVA infection also stimulated the expression of NF-B and components of the NF-B signal transduction pathway, including p50 and TRAF-interacting protein. A marked increase in the expression of histone family members was also induced during MVA infection. Expression of the Wiskott-Aldrich syndrome family members WAS, WASF1, and the small GTP-binding protein RAC-1, which are involved in actin cytoskeleton reorganization, was enhanced after MVA infection. This study demonstrates that MVA infection triggered the induction of groups of genes, some of which may be involved in host resistance and immune modulation during virus infection.
Interaction between mammalian cells and viruses has an impact on a diverse set of cellular processes. Many of these interactions are characterized by antiviral immune responses and changes in cellular transcriptional, translational, and traf-ficking machinery that in turn depend on the infection stage and the biological condition of the infected cell. The modified vaccinia virus (VV) Ankara (MVA), derived from the Ankara strain, is a highly attenuated virus. MVA has been passaged more than 500 times in chicken embryo fibroblasts. During the course of attenuation, 15% of the parental viral genome was lost (2, 25); the structural genes remained unaltered, but genes involved in immune evasion factors (4) and host range genes (1, 25, 42) have been deleted or fragmented. MVA produces an infectious cycle in chicken embryo fibroblasts and baby hamster kidney (BHK) cells but not in various human cell lines, including the HeLa cell line (7, 11). Although viral rep-lication depends on cell type, blockade of the morphogenetic program in nonpermissive cells occurs in steps after the for-mation of immature viral forms, with no alteration in early or late viral gene expression (34, 36). In cultured cells, MVA recombinants produced levels of heterologous protein similar to or higher than those of VV-derived vectors (8, 33, 36). In
mammals, MVA recombinants induce protective immunity against a wide spectrum of pathogens (7, 18, 23, 24, 35, 37). MVA may be of use in the generation of live vaccines against infectious diseases and in cancer therapy due to its safety and its ability to evoke protection. The generation of such vaccines demands a comprehensive understanding of the effect of MVA infection on human host gene expression. With DNA microar-ray technology, the expression of several thousand individual genes can be monitored (19), and this technology has been used to identify cellular genes that are differentially expressed in response to infection with several animal viruses (5, 9, 16, 17, 20, 30, 41, 43). Here, we analyzed host gene expression changes in cultures of the human cervical carcinoma cell line HeLa at 2, 6, and 16 h postinfection by using cDNA microarray tech-nology. During MVA infection, we found increased expression of cellular genes associated with the immune response and with a variety of cellular pathways. This study represents the first global analysis of the transcriptional response of HeLa cells to MVA infection.
MATERIALS AND METHODS
Cells, viruses, and infection conditions.HeLa cells (from the American Type Culture Collection) were cultured in Dulbecco’s medium supplemented with 10% newborn bovine serum and antibiotics. MVA was cultured in BHK-21 cells, purified by banding on sucrose gradients, and titrated on BHK-21 cells by immunostaining of fixed infected cultures with a polyclonal anti-VV protein antibody. The VV Western Reserve (WR) strain was grown in monkey BSC-40 cells, purified by sucrose gradient banding, and titrated on BSC-40 cells by
* Corresponding author. Mailing address: Centro Nacional de Bio-tecnología, CSIC, Campus Universidad Auto´noma, 28049 Madrid, Spain. Phone: (34) 91/585-4553. Fax: (34) 91/585-4506. E-mail: [email protected].
5820
on November 8, 2019 by guest
http://jvi.asm.org/
plaque assay. MVA and WR infections were carried out at a multiplicity of infection of 5 PFU/cell.
Microarray fabrication.The Research Genetics 40K sequence-verified clone human cDNA library (http://www.resgen.com/products/SVHcDNA.php3) was used to generate cDNA arrays as described previously (17). Slides contained 15,360 cDNAs, of which 13,295 correspond to known genes and 2,257 correspond to control genes. Printing on CMT-GAPS II slides (Corning) was performed with a Microgrid II (BioRobotics) at 22°C and 40 to 45% relative humidity.
Microarray hybridization.Total RNA was isolated from MVA-infected (5 PFU/cell) or mock-infected HeLa cells cultured in 10-cm plates with Ultra-spect-II RNA (Biotecx) by following the manufacturer’s instructions. Uninfected samples were isolated at each infection time point and processed in parallel with infected cells. Two different samples of RNA from MVA-infected cells at 2, 6, and 16 h postinfection and RNA from corresponding mock-infected cells were processed for analysis. Each RNA was used in two different hybridizations. In one hybridization, the mock-infected sample was labeled with dUTP-Cy3 and the MVA-infected sample was labeled with dUTP-Cy5; in the other, the mock-infected sample was labeled with dUTP-Cy5 and the MVA-mock-infected sample was labeled with dUTP-Cy3. Double labeling was used to abolish labeling and hy-bridization differences due to specific Cy-dUTP characteristics. A mixture
con-taining 40g of RNA, 150 pmol of oligo(dT)20,0.5 mM dATP, 0.5 mM dGTP,
0.5 mM dCTP, 0.1 mM dTTP, 0.05 mM Cy3/Cy5 dUTP (Amersham), 1⫻
first-strand reaction buffer (Invitrogen), and 10 mM dithiothreitol in a volume of 38
l was heated (65°C, 5 min) and preincubated (42°C, 5 min), after which 400 U
of SuperScript II (Invitrogen) and 40 U of RNase Inhibitor (Roche) were added and the mixture was incubated (42°C, 2.5 h). The reaction was terminated with
EDTA, and starting RNA template was removed by adding 2l of 10 N NaOH,
followed by incubation (20 min, 65°C). The reaction was neutralized by adding 4
l of 5 M acetic acid. Cy5 and Cy3 probes were mixed, and unincorporated dyes
were removed by isopropanol precipitation. Probes were resuspended in
deion-ized water; blocking reagents added to increase specificity were poly(A) (20g;
Sigma), tRNA (20g; Sigma), and human Cot-1 DNA (20g; Invitrogen).
While probes were drying in a Speed-Vac, microarray slides were prehybridized
in a mixture containing 6⫻SSC (1⫻SSC is 0.15 M NaCl plus 0.015 M sodium
citrate), 0.5% sodium dodecyl sulfate (SDS), and 1% bovine serum albumin
(42°C, 1 h), rinsed five times with water, and dried by centrifugation (563⫻g, 1
min). Probes were resuspended in 40l of hybridization buffer (50% formamide,
6⫻SSC, 0.5% SDS, 5⫻Denhardt’s solution) and incubated with slides (42°C,
16 h) in hybridization chambers (Array-It) in a water bath in the dark. After
incubation, slides were washed twice in 0.1⫻SSC–0.1% SDS for 5 min each time
and three times in 0.1⫻SSC for 5 min each time. Finally, slides were dried by
centrifugation as described above and scanned on a ScanArray 4000 (Packard Biosciences) by using ScanArray 3.1 software. Raw data were obtained from Cy5 and Cy3 images by using QuantArray 3.0 software (Packard Biosciences) and processed by using SOLAR software (BioALMA, Madrid, Spain). Briefly,
back-ground is subtracted from the signal, log10(signal) is plotted versus log2(ratio)
[image:2.603.47.537.75.429.2]and, a lowess normalization is done to adjust most spots to log ratio 0. This value is calculated for all four replicates and a table is obtained with mean signal,
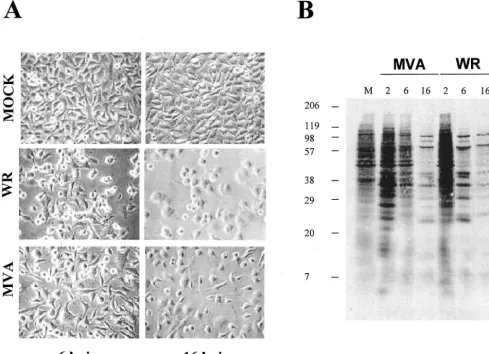
FIG. 1. Cytopathic effect and protein synthesis pattern of HeLa cells infected with VV WR and MVA strains. (A) Cell morphology after virus infection. Monolayer-cultured HeLa cells were infected with WR or MVA (5 PFU/cell), and CPEs were visualized by phase-contrast microscopy at the indicated times postinfection. hpi, hours postinfection. (B) Pattern of viral protein synthesis. HeLa cells were infected as described above and labeled with [35S]methionine (50Ci, 30 min) at the times indicated. Cells lysates were analyzed by SDS–12% PAGE and visualized by
autoradiography. Based on protein standards, molecular mass (in kDa) is indicated. Uninfected cells (M) served as the control. Postinfection times (in hours) are noted above the gels.
on November 8, 2019 by guest
http://jvi.asm.org/
change (n-fold), log ratio, standard deviation of the log ratio, andzscore (a measure of the proximity of one value [log ratio] to other values with similar signals) (32).
Gene expression analysis.The original data set containing 13,295 clones per slide was prepared for clustering. Genes with an interreplicate standard deviation
of⬎1 were removed from the analysis. The resulting data set was reduced to
9,749 transcripts that showed a consistent expression value among the four
replicates. Thezscore value was used to eliminate genes that did not show
significant expression under at least one experimental condition (32). In this way,
only genes withzscores of⬎2 were selected for clustering. A new data set was
created with the 410 transcripts that successfully passed through the filter. After the data were preprocessed, genes were clustered by using Kohonen’s classical self-organizing map (12, 22, 40). The resulting 7-by-5 map was analyzed by using
the Engene software package (15), available at http://www.engene.cnb.uam.es.
Quantitative real-time RT-PCR.RNA (1g) was reverse transcribed by using the Superscript first-strand synthesis system for reverse transcription-PCR (RT-PCR) (Invitrogen). A 1:40 dilution of the RT reaction mixture was used for quantitative PCR. Primers and the probe set used to amplify H2BFB, PCNT2, WASF1, WAS, interleukin 7 (IL-7), IL-6, IFNG, APEXL2, and FLJ20643 were purchased from Applied Biosystems. RT-PCRs were performed by using Assay-on-Demand optimized to work with TaqMan Universal PCR Master Mix, No AmpErase UNG, as previously described (17). All samples were assayed in duplicate. Threshold cycle values were used to plot a standard curve in which the threshold cycle value decreased in linear proportion to the log of the template
copy number. The correlation values of standard curves were always⬎99%.
Western blot.HeLa cells were infected at 5 PFU/cell with MVA or WR and collected at 2, 6, and 16 h postinfection in lysis buffer (50 mM Tris-HCl [pH 8.0],
0.5 M NaCl, 10% NP-40, 1% SDS). Equal amounts of protein lysates (10g)
were separated by SDS-polyacrylamide gel electrophoresis (SDS-PAGE) on 14 or 8% gels, transferred to nitrocellulose membranes, and incubated with primary
antiactin (Sigma), antitubulin (Sigma), anti-NF-B (Santa Cruz), anti-RAC-1
(kindly provided by J. C. Gallego), anti-WAS (Santa Cruz), and anti-WAVE (Santa Cruz), followed by peroxidase-conjugated mouse and rabbit secondary antibodies. The blots were developed by using the ECL protocol (Amersham).
Analysis of [35S]methionine labeled proteins.HeLa cell monolayers in 12-well
plates were mock infected or infected with WR or MVA at 5 PFU/cell. At the indicated times post infection, cells were washed with methionine-free medium
and incubated with methionine-free medium containing 50Ci of [35
S]methi-onine per well (30 min, 37°C). Proteins in cell extracts prepared in lysis buffer were fractionated by SDS–12% PAGE and developed by autoradiography.
ELISA.Secreted IL-6 and gamma interferon (IFN-␥) in the medium of MVA-or WR-infected HeLa cells were measured with the quantitative human IL-6 and
IFN-␥kit (BD Biosciences). Aliquots (100l) of supernatant from uninfected or
infected HeLa cells at 2, 6, and 16 h postinfection were used for ELISA
accord-ing to the manufacturer’s instructions. Captured IL-6 and IFN-␥were quantified
at 450 nm with a spectrophotometer. Duplicate samples were measured in two independent experiments.
RESULTS
Gene expression analysis. To study the cellular transcrip-tional response after MVA infection, we first defined the cy-topathic effect (CPE) and shutoff of MVA-infected HeLa cells compared to cells infected with the WR strain. WR produced a pronounced CPE at 6 and 16 h postinfection, and this CPE was reduced in MVA-infected cells (Fig. 1A). At a multiplicity of infection of 5 PFU/cell, over 99% of the cells were infected. At 16 h postinfection, more rounded cells were observed after WR infection, whereas MVA produced rounded and bipolar cells, as previously noted (14). The pattern of protein synthesis is shown in Fig. 1B. At 6 h postinfection, WR-infected cells showed a more evident shutoff than MVA-infected cells, while at 16 h postinfection, shutoffs induced by both viruses were similar.
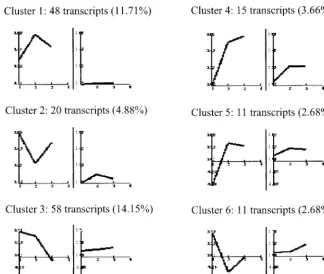
FIG. 2. Representation of 7-by-5 map obtained by the self-organizing maps algorithm, showing the gene expression cluster for MVA-infected HeLa cells. Each map node represents the average expression profile for a set of similar genes in the data set. Experimental points on thexaxis are 1 for 2 h postinfection, 2 for 6 h postinfection, and 3 for 16 h postinfection. Theyaxis shows normalized expression values. Each cluster is shaded from white to gray and numbered from 1 to 11.
on November 8, 2019 by guest
http://jvi.asm.org/
We performed cDNA microarray analysis to determine the relative abundance of specific mRNAs induced in MVA-in-fected cells compared to that induced in mock-inMVA-in-fected cells. The gene expression clusters of the 410 differentially regulated genes are depicted in Fig. 2. Detailed profile analysis led us to group the genes into 11 main clusters according to their be-havior at the three time points of MVA infection by using Engene software (15). Clusters 1 and 2 contained 68 tran-scripts, representing 16.59% of the 410 genes, showing a robust induction pattern that was maintained during the course of infection. Cluster 3 contained 58 transcripts (14.15%), includ-ing genes with a generalized induction pattern maintained from 2 to 6 h postinfection that returned to basal levels at 16 h postinfection. Cluster 4 had 15 transcripts (3.66%), with an upregulation pattern maintained from 6 to 16 h postinfection. Cluster 5 contained 11 transcripts (2.68%) that were down-regulated at 2 h postinfection and updown-regulated at 6 and 16 h postinfection. Cluster 6 contained 11 transcripts (2.68%) with upregulated expression only at 2 h postinfection. The average profiles for clusters 1 to 6 are shown in Fig. 3; these six clusters include genes involved in adhesion, cell cycles, immune re-sponse, signal transmission, metabolic pathways, and other vi-tal cell processes. Representative human genes upregulated by MVA infection in clusters 1 to 6 are shown in Table 1. Genes whose expression was repressed after MVA infection repre-sented 60.24% of the 410 genes; representative human genes downregulated by MVA in clusters 7 to 11 are detailed in Table 2.
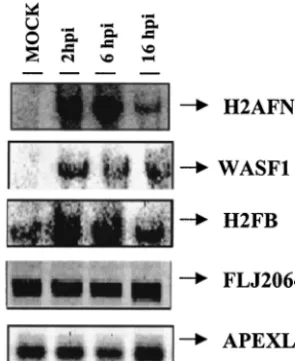
Confirmation of microarray data for selected genes by Northern blot analysis and real-time RT-PCR.Selected genes with distinct expression patterns after MVA infection, as iden-tified by microarray analysis, were chosen for target verifica-tion by Northern blotting. Total RNA was purified from unin-fected or MVA-inunin-fected cells at 2, 6, and 16 h postinfection, fractionated by gel electrophoresis, blotted, and probed by using32P-labeled PCR products that were spotted on the
mi-croarray. The RNA preparation used for this analysis was the same as that used in the microarray. The amount of RNA on the blot was normalized based on rRNA content. The North-ern blot analysis confirmed microarray results in all cases (Fig. 4). Whereas the expression pattern of histone family member N (H2AFN) was weakly detected in mock-infected cells, strong activation compared to that for the uninfected control was observed at 2, 6, and 16 h postinfection. A similar expression pattern was observed for WAS protein family member 1 (WASF1). Peaks of histone F gene H2FB mRNA expression were reached at 2 and 6 h postinfection. A constitutive expres-sion pattern of the apurinic/apyridiminic endonuclease gene (APEXL2) and the EST FLJ20643 was observed in the pres-ence and in the abspres-ence of MVA.
As an alternative to the Northern blot analysis, real-time RT-PCR was used to verify the transcriptional changes in selected genes detected by microarray analysis. Six upregulated genes (H2BFB, PCNT2, WASF1, WAS, IL-7, and IL-6) and three unaltered genes (IFNG, APEXL2, and FLJ20643) were analyzed; hypoxanthine phosphoribosyltransferase was used as
FIG. 3. Characteristic expression patterns represented in clusters 1 to 6. Shown are mean values (left) and standard deviations (right) of the expression profiles of genes assigned to each cluster. Experimental points on thexaxis are 1 for 2 h postinfection, 2 for 6 h postinfection, and 3 for 16 h postinfection. Theyaxis shows normalized expression values. The values in parentheses are percentages of genes in each cluster with reference to the total of 410 differentially expressed genes.
on November 8, 2019 by guest
http://jvi.asm.org/
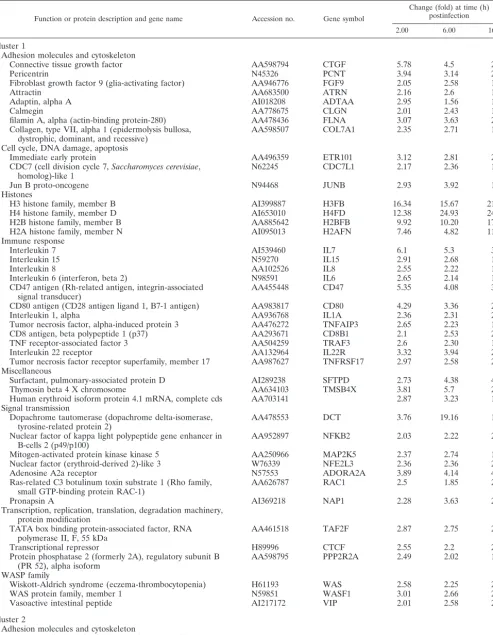
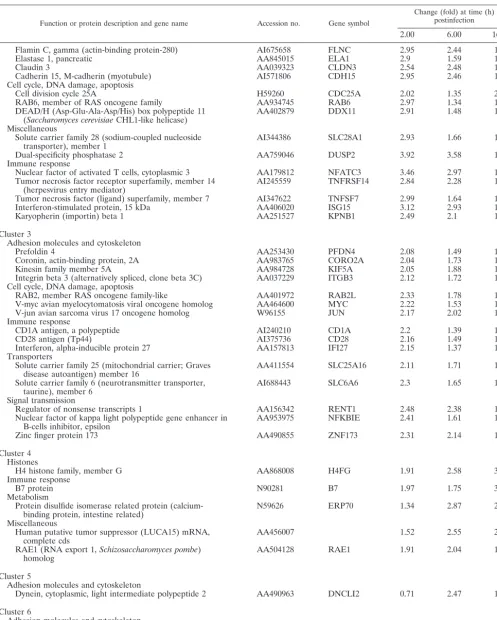
TABLE 1. Representative human genes in clusters 1 to 6 (upregulated by MVA)a
Function or protein description and gene name Accession no. Gene symbol
Change (fold) at time (h) postinfection
2.00 6.00 16.00
Cluster 1
Adhesion molecules and cytoskeleton
Connective tissue growth factor AA598794 CTGF 5.78 4.5 2.17
Pericentrin N45326 PCNT 3.94 3.14 2.38
Fibroblast growth factor 9 (glia-activating factor) AA946776 FGF9 2.05 2.58 1.41
Attractin AA683500 ATRN 2.16 2.6 1.41
Adaptin, alpha A AI018208 ADTAA 2.95 1.56 1.78
Calmegin AA778675 CLGN 2.01 2.43 1.29
filamin A, alpha (actin-binding protein-280) AA478436 FLNA 3.07 3.63 2.79
Collagen, type VII, alpha 1 (epidermolysis bullosa,
dystrophic, dominant, and recessive) AA598507 COL7A1 2.35 2.71 1.47
Cell cycle, DNA damage, apoptosis
Immediate early protein AA496359 ETR101 3.12 2.81 2.11
CDC7 (cell division cycle 7,Saccharomyces cerevisiae,
homolog)-like 1 N62245 CDC7L1 2.17 2.36 1.72
Jun B proto-oncogene N94468 JUNB 2.93 3.92 1.06
Histones
H3 histone family, member B AI399887 H3FB 16.34 15.67 21.71
H4 histone family, member D AI653010 H4FD 12.38 24.93 24.93
H2B histone family, member B AA885642 H2BFB 9.92 10.20 17.03
H2A histone family, member N AI095013 H2AFN 7.46 4.82 11.55
Immune response
Interleukin 7 AI539460 IL7 6.1 5.3 3.2
Interleukin 15 N59270 IL15 2.91 2.68 1.59
Interleukin 8 AA102526 IL8 2.55 2.22 1.84
Interleukin 6 (interferon, beta 2) N98591 IL6 2.65 2.14 1.56
CD47 antigen (Rh-related antigen, integrin-associated
signal transducer) AA455448 CD47 5.35 4.08 3.16
CD80 antigen (CD28 antigen ligand 1, B7-1 antigen) AA983817 CD80 4.29 3.36 2.57
Interleukin 1, alpha AA936768 IL1A 2.36 2.31 2.44
Tumor necrosis factor, alpha-induced protein 3 AA476272 TNFAIP3 2.65 2.23 1.96
CD8 antigen, beta polypeptide 1 (p37) AA293671 CD8B1 2.1 2.53 2.47
TNF receptor-associated factor 3 AA504259 TRAF3 2.6 2.30 1.67
Interleukin 22 receptor AA132964 IL22R 3.32 3.94 2.2
Tumor necrosis factor receptor superfamily, member 17 AA987627 TNFRSF17 2.97 2.58 2.24 Miscellaneous
Surfactant, pulmonary-associated protein D AI289238 SFTPD 2.73 4.38 4.14
Thymosin beta 4 X chromosome AA634103 TMSB4X 3.81 5.7 2.91
Human erythroid isoform protein 4.1 mRNA, complete cds AA703141 2.87 3.23 1.93
Signal transmission
Dopachrome tautomerase (dopachrome delta-isomerase,
tyrosine-related protein 2) AA478553 DCT 3.76 19.16 1.79
Nuclear factor of kappa light polypeptide gene enhancer in
B-cells 2 (p49/p100) AA952897 NFKB2 2.03 2.22 2.34
Mitogen-activated protein kinase kinase 5 AA250966 MAP2K5 2.37 2.74 1.69
Nuclear factor (erythroid-derived 2)-like 3 W76339 NFE2L3 2.36 2.36 2.52
Adenosine A2a receptor N57553 ADORA2A 3.89 4.14 4.11
Ras-related C3 botulinum toxin substrate 1 (Rho family,
small GTP-binding protein RAC-1) AA626787 RAC1 2.5 1.85 2.9
Pronapsin A AI369218 NAP1 2.28 3.63 2.43
Transcription, replication, translation, degradation machinery, protein modification
TATA box binding protein-associated factor, RNA
polymerase II, F, 55 kDa AA461518 TAF2F 2.87 2.75 2.82
Transcriptional repressor H89996 CTCF 2.55 2.2 2.23
Protein phosphatase 2 (formerly 2A), regulatory subunit B
(PR 52), alpha isoform AA598795 PPP2R2A 2.49 2.02 1.68
WASP family
Wiskott-Aldrich syndrome (eczema-thrombocytopenia) H61193 WAS 2.58 2.25 2.61
WAS protein family, member 1 N59851 WASF1 3.01 2.66 2.11
Vasoactive intestinal peptide AI217172 VIP 2.01 2.58 2.32
Cluster 2
Adhesion molecules and cytoskeleton
Inter-alpha (globulin) inhibitor H4 (plasma
Kallikrein-sensitive glycoprotein) N73625 ITIH4 2.99 2.43 1.16
Continued on facing page
on November 8, 2019 by guest
http://jvi.asm.org/
TABLE 1—Continued
Function or protein description and gene name Accession no. Gene symbol
Change (fold) at time (h) postinfection
2.00 6.00 16.00
Flamin C, gamma (actin-binding protein-280) AI675658 FLNC 2.95 2.44 1.15
Elastase 1, pancreatic AA845015 ELA1 2.9 1.59 1.25
Claudin 3 AA039323 CLDN3 2.54 2.48 1.32
Cadherin 15, M-cadherin (myotubule) AI571806 CDH15 2.95 2.46 1.15
Cell cycle, DNA damage, apoptosis
Cell division cycle 25A H59260 CDC25A 2.02 1.35 2.14
RAB6, member of RAS oncogene family AA934745 RAB6 2.97 1.34 1.64
DEAD/H (Asp-Glu-Ala-Asp/His) box polypeptide 11
(Saccharomyces cerevisiaeCHL1-like helicase) AA402879 DDX11 2.91 1.48 1.37
Miscellaneous
Solute carrier family 28 (sodium-coupled nucleoside
transporter), member 1 AI344386 SLC28A1 2.93 1.66 1.74
Dual-specificity phosphatase 2 AA759046 DUSP2 3.92 3.58 1.00
Immune response
Nuclear factor of activated T cells, cytoplasmic 3 AA179812 NFATC3 3.46 2.97 1.30
Tumor necrosis factor receptor superfamily, member 14
(herpesvirus entry mediator) AI245559 TNFRSF14 2.84 2.28 1.68
Tumor necrosis factor (ligand) superfamily, member 7 AI347622 TNFSF7 2.99 1.64 1.3
Interferon-stimulated protein, 15 kDa AA406020 ISG15 3.12 2.93 1.61
Karyopherin (importin) beta 1 AA251527 KPNB1 2.49 2.1 1.26
Cluster 3
Adhesion molecules and cytoskeleton
Prefoldin 4 AA253430 PFDN4 2.08 1.49 1.17
Coronin, actin-binding protein, 2A AA983765 CORO2A 2.04 1.73 1.04
Kinesin family member 5A AA984728 KIF5A 2.05 1.88 1.73
Integrin beta 3 (alternatively spliced, clone beta 3C) AA037229 ITGB3 2.12 1.72 1.41 Cell cycle, DNA damage, apoptosis
RAB2, member RAS oncogene family-like AA401972 RAB2L 2.33 1.78 1.38
V-myc avian myelocytomatosis viral oncogene homolog AA464600 MYC 2.22 1.53 1.05
V-jun avian sarcoma virus 17 oncogene homolog W96155 JUN 2.17 2.02 1.31
Immune response
CD1A antigen, a polypeptide AI240210 CD1A 2.2 1.39 1.45
CD28 antigen (Tp44) AI375736 CD28 2.16 1.49 1.27
Interferon, alpha-inducible protein 27 AA157813 IFI27 2.15 1.37 1.92
Transporters
Solute carrier family 25 (mitochondrial carrier; Graves
disease autoantigen) member 16 AA411554 SLC25A16 2.11 1.71 1.57
Solute carrier family 6 (neurotransmitter transporter,
taurine), member 6 AI688443 SLC6A6 2.3 1.65 1.43
Signal transmission
Regulator of nonsense transcripts 1 AA156342 RENT1 2.48 2.38 1.56
Nuclear factor of kappa light polypeptide gene enhancer in
B-cells inhibitor, epsilon AA953975 NFKBIE 2.41 1.61 1.12
Zinc finger protein 173 AA490855 ZNF173 2.31 2.14 1.39
Cluster 4 Histones
H4 histone family, member G AA868008 H4FG 1.91 2.58 3.34
Immune response
B7 protein N90281 B7 1.97 1.75 3.53
Metabolism
Protein disulfide isomerase related protein
(calcium-binding protein, intestine related) N59626 ERP70 1.34 2.87 2.06
Miscellaneous
Human putative tumor suppressor (LUCA15) mRNA,
complete cds AA456007 1.52 2.55 2.28
RAE1 (RNA export 1,Schizosaccharomyces pombe)
homolog AA504128 RAE1 1.91 2.04 1.95
Cluster 5
Adhesion molecules and cytoskeleton
Dynein, cytoplasmic, light intermediate polypeptide 2 AA490963 DNCLI2 0.71 2.47 1.82 Cluster 6
Adhesion molecules and cytoskeleton
Lamin B1 AA983462 LMNB1 2.00 1.54 1.91
aGenes in each cluster are grouped according to predicted biological function.
on November 8, 2019 by guest
http://jvi.asm.org/
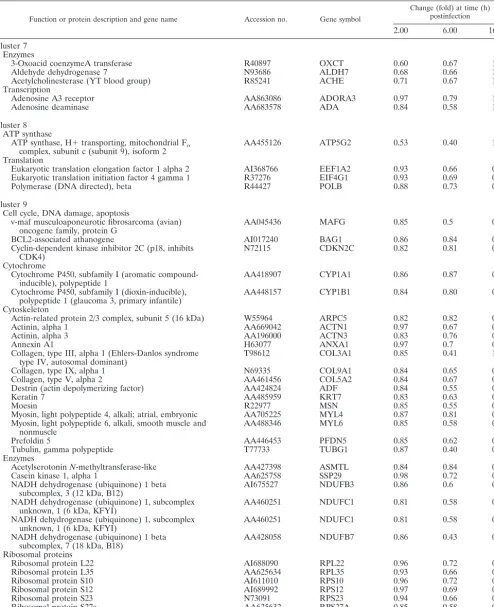
TABLE 2. Representative human genes in clusters 7 to 11 (downregulated by MVA)a
Function or protein description and gene name Accession no. Gene symbol
Change (fold) at time (h) postinfection
2.00 6.00 16.00
Cluster 7 Enzymes
3-Oxoacid coenzymeA transferase R40897 OXCT 0.60 0.67 1.05
Aldehyde dehydrogenase 7 N93686 ALDH7 0.68 0.66 1.02
Acetylcholinesterase (YT blood group) R85241 ACHE 0.71 0.67 1.10
Transcription
Adenosine A3 receptor AA863086 ADORA3 0.97 0.79 1.73
Adenosine deaminase AA683578 ADA 0.84 0.58 1.49
Cluster 8 ATP synthase
ATP synthase, H⫹transporting, mitochondrial Fo
complex, subunit c (subunit 9), isoform 2 AA455126 ATP5G2 0.53 0.40 1.12
Translation
Eukaryotic translation elongation factor 1 alpha 2 AI368766 EEF1A2 0.93 0.66 0.91
Eukaryotic translation initiation factor 4 gamma 1 R37276 EIF4G1 0.93 0.69 0.90
Polymerase (DNA directed), beta R44427 POLB 0.88 0.73 0.64
Cluster 9
Cell cycle, DNA damage, apoptosis
v-maf musculoaponeurotic fibrosarcoma (avian)
oncogene family, protein G AA045436 MAFG 0.85 0.5 0.66
BCL2-associated athanogene AI017240 BAG1 0.86 0.84 0.68
Cyclin-dependent kinase inhibitor 2C (p18, inhibits
CDK4) N72115 CDKN2C 0.82 0.81 0.68
Cytochrome
Cytochrome P450, subfamily I (aromatic
compound-inducible), polypeptide 1 AA418907 CYP1A1 0.86 0.87 0.68
Cytochrome P450, subfamily I (dioxin-inducible),
polypeptide 1 (glaucoma 3, primary infantile) AA448157 CYP1B1 0.84 0.80 0.66
Cytoskeleton
Actin-related protein 2/3 complex, subunit 5 (16 kDa) W55964 ARPC5 0.82 0.82 0.6
Actinin, alpha 1 AA669042 ACTN1 0.97 0.67 0.75
Actinin, alpha 3 AA196000 ACTN3 0.83 0.76 0.51
Annexin A1 H63077 ANXA1 0.97 0.7 0.67
Collagen, type III, alpha 1 (Ehlers-Danlos syndrome
type IV, autosomal dominant) T98612 COL3A1 0.85 0.41 1.25
Collagen, type IX, alpha 1 N69335 COL9A1 0.84 0.65 0.66
Collagen, type V, alpha 2 AA461456 COL5A2 0.84 0.67 0.51
Destrin (actin depolymerizing factor) AA424824 ADF 0.84 0.55 0.43
Keratin 7 AA485959 KRT7 0.83 0.63 0.53
Moesin R22977 MSN 0.85 0.55 0.44
Myosin, light polypeptide 4, alkali; atrial, embryonic AA705225 MYL4 0.87 0.81 0.35 Myosin, light polypeptide 6, alkali, smooth muscle and
nonmuscle AA488346 MYL6 0.85 0.58 0.45
Prefoldin 5 AA446453 PFDN5 0.85 0.62 0.58
Tubulin, gamma polypeptide T77733 TUBG1 0.87 0.40 0.69
Enzymes
AcetylserotoninN-methyltransferase-like AA427398 ASMTL 0.84 0.84 0.67
Casein kinase 1, alpha 1 AA625758 SSP29 0.98 0.72 0.58
NADH dehydrogenase (ubiquinone) 1 beta
subcomplex, 3 (12 kDa, B12) AI675527 NDUFB3 0.86 0.6 0.62
NADH dehydrogenase (ubiquinone) 1, subcomplex
unknown, 1 (6 kDa, KFYI) AA460251 NDUFC1 0.81 0.58 0.54
NADH dehydrogenase (ubiquinone) 1, subcomplex
unknown, 1 (6 kDa, KFYI) AA460251 NDUFC1 0.81 0.58 0.54
NADH dehydrogenase (ubiquinone) 1 beta
subcomplex, 7 (18 kDa, B18) AA428058 NDUFB7 0.86 0.43 0.46
Ribosomal proteins
Ribosomal protein L22 AI688090 RPL22 0.96 0.72 0.56
Ribosomal protein L35 AA625634 RPL35 0.93 0.66 0.76
Ribosomal protein S10 AI611010 RPS10 0.96 0.72 0.65
Ribosomal protein S12 AI689992 RPS12 0.97 0.69 0.62
Ribosomal protein S23 N73091 RPS23 0.94 0.66 0.71
Ribosomal protein S27a AA625632 RPS27A 0.85 0.58 0.72
Ribosomal protein S28 AA856556 RPS28 0.89 0.63 0.69
Ribosomal protein S5 AA456616 RPS5 0.95 0.71 0.65
Continued on facing page
on November 8, 2019 by guest
http://jvi.asm.org/
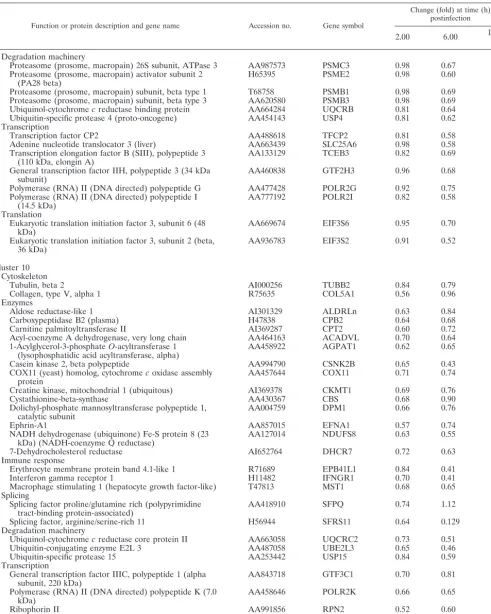
TABLE 2—Continued
Function or protein description and gene name Accession no. Gene symbol
Change (fold) at time (h) postinfection
2.00 6.00 16.00
Degradation machinery
Proteasome (prosome, macropain) 26S subunit, ATPase 3 AA987573 PSMC3 0.98 0.67 0.69 Proteasome (prosome, macropain) activator subunit 2
(PA28 beta) H65395 PSME2 0.98 0.60 0.59
Proteasome (prosome, macropain) subunit, beta type 1 T68758 PSMB1 0.98 0.69 0.73
Proteasome (prosome, macropain) subunit, beta type 3 AA620580 PSMB3 0.98 0.69 0.71
Ubiquinol-cytochromecreductase binding protein AA664284 UQCRB 0.81 0.64 0.56
Ubiquitin-specific protease 4 (proto-oncogene) AA454143 USP4 0.81 0.62 0.54
Transcription
Transcription factor CP2 AA488618 TFCP2 0.81 0.58 0.49
Adenine nucleotide translocator 3 (liver) AA663439 SLC25A6 0.98 0.58 0.44
Transcription elongation factor B (SIII), polypeptide 3
(110 kDa, elongin A) AA133129 TCEB3 0.82 0.69 0.70
General transcription factor IIH, polypeptide 3 (34 kDa
subunit) AA460838 GTF2H3 0.96 0.68 0.74
Polymerase (RNA) II (DNA directed) polypeptide G AA477428 POLR2G 0.92 0.75 0.60
Polymerase (RNA) II (DNA directed) polypeptide I
(14.5 kDa) AA777192 POLR2I 0.82 0.58 0.42
Translation
Eukaryotic translation initiation factor 3, subunit 6 (48
kDa) AA669674 EIF3S6 0.95 0.70 0.55
Eukaryotic translation initiation factor 3, subunit 2 (beta,
36 kDa) AA936783 EIF3S2 0.91 0.52 0.42
Cluster 10 Cytoskeleton
Tubulin, beta 2 AI000256 TUBB2 0.84 0.79 0.48
Collagen, type V, alpha 1 R75635 COL5A1 0.56 0.96 0.67
Enzymes
Aldose reductase-like 1 AI301329 ALDRLn 0.63 0.84 0.79
Carboxypeptidase B2 (plasma) H47838 CPB2 0.64 0.68 0.88
Carnitine palmitoyltransferase II AI369287 CPT2 0.60 0.72 0.63
Acyl-coenzyme A dehydrogenase, very long chain AA464163 ACADVL 0.70 0.64 0.74
1-Acylglycerol-3-phosphateO-acyltransferase 1
(lysophosphatidic acid acyltransferase, alpha) AA458922 AGPAT1 0.62 0.65 0.72
Casein kinase 2, beta polypeptide AA994790 CSNK2B 0.65 0.43 0.50
COX11 (yeast) homolog, cytochromecoxidase assembly
protein AA457644 COX11 0.71 0.74 0.84
Creatine kinase, mitochondrial 1 (ubiquitous) AI369378 CKMT1 0.69 0.76 0.64
Cystathionine-beta-synthase AA430367 CBS 0.68 0.90 0.71
Dolichyl-phosphate mannosyltransferase polypeptide 1,
catalytic subunit AA004759 DPM1 0.66 0.76 0.68
Ephrin-A1 AA857015 EFNA1 0.57 0.74 0.69
NADH dehydrogenase (ubiquinone) Fe-S protein 8 (23
kDa) (NADH-coenzyme Q reductase) AA127014 NDUFS8 0.63 0.55 0.55
7-Dehydrocholesterol reductase AI652764 DHCR7 0.72 0.63 0.64
Immune response
Erythrocyte membrane protein band 4.1-like 1 R71689 EPB41L1 0.84 0.41 0.45
Interferon gamma receptor 1 H11482 IFNGR1 0.70 0.41 0.44
Macrophage stimulating 1 (hepatocyte growth factor-like) T47813 MST1 0.68 0.65 0.74 Splicing
Splicing factor proline/glutamine rich (polypyrimidine
tract-binding protein-associated) AA418910 SFPQ 0.74 1.12 0.66
Splicing factor, arginine/serine-rich 11 H56944 SFRS11 0.64 0.129 0.30
Degradation machinery
Ubiquinol-cytochromecreductase core protein II AA663058 UQCRC2 0.73 0.51 0.70
Ubiquitin-conjugating enzyme E2L 3 AA487058 UBE2L3 0.65 0.46 0.62
Ubiquitin-specific protease 15 AA253442 USP15 0.84 0.59 0.64
Transcription
General transcription factor IIIC, polypeptide 1 (alpha
subunit, 220 kDa) AA843718 GTF3C1 0.70 0.81 0.86
Polymerase (RNA) II (DNA directed) polypeptide K (7.0
kDa) AA458646 POLR2K 0.66 0.65 0.71
Ribophorin II AA991856 RPN2 0.52 0.60 0.54
B-cell CLL/lymphoma 10 AA456036 BCL10 0.70 0.88 0.67
Adenine nucleotide translocator 3 (liver) AA496376 SLC25A6 0.69 0.59 0.54
Continued on following page
on November 8, 2019 by guest
http://jvi.asm.org/
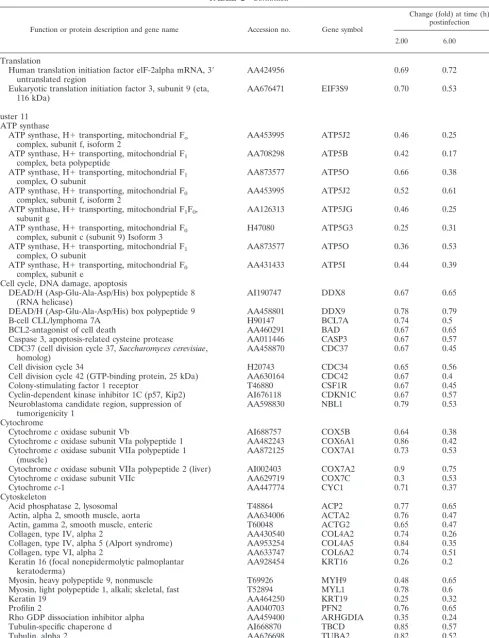
TABLE 2—Continued
Function or protein description and gene name Accession no. Gene symbol
Change (fold) at time (h) postinfection
2.00 6.00 16.00
Translation
Human translation initiation factor elF-2alpha mRNA, 3⬘
untranslated region AA424956 0.69 0.72 0.65
Eukaryotic translation initiation factor 3, subunit 9 (eta,
116 kDa) AA676471 EIF3S9 0.70 0.53 0.70
Cluster 11 ATP synthase
ATP synthase, H⫹transporting, mitochondrial Fo
complex, subunit f, isoform 2 AA453995 ATP5J2 0.46 0.25 0.25
ATP synthase, H⫹transporting, mitochondrial F1
complex, beta polypeptide AA708298 ATP5B 0.42 0.17 0.16
ATP synthase, H⫹transporting, mitochondrial F1
complex, O subunit AA873577 ATP5O 0.66 0.38 0.19
ATP synthase, H⫹transporting, mitochondrial F0
complex, subunit f, isoform 2 AA453995 ATP5J2 0.52 0.61 0.25
ATP synthase, H⫹transporting, mitochondrial F1F0,
subunit g AA126313 ATP5JG 0.46 0.25 0.36
ATP synthase, H⫹transporting, mitochondrial F0
complex, subunit c (subunit 9) Isoform 3 H47080 ATP5G3 0.25 0.31 0.36
ATP synthase, H⫹transporting, mitochondrial F1
complex, O subunit AA873577 ATP5O 0.36 0.53 0.23
ATP synthase, H⫹transporting, mitochondrial F0
complex, subunit e AA431433 ATP5I 0.44 0.39 0.10
Cell cycle, DNA damage, apoptosis
DEAD/H (Asp-Glu-Ala-Asp/His) box polypeptide 8
(RNA helicase) AI190747 DDX8 0.67 0.65 0.45
DEAD/H (Asp-Glu-Ala-Asp/His) box polypeptide 9 AA458801 DDX9 0.78 0.79 0.55
B-cell CLL/lymphoma 7A H90147 BCL7A 0.74 0.5 0.52
BCL2-antagonist of cell death AA460291 BAD 0.67 0.65 0.45
Caspase 3, apoptosis-related cysteine protease AA011446 CASP3 0.67 0.57 0.54
CDC37 (cell division cycle 37,Saccharomyces cerevisiae,
homolog) AA458870 CDC37 0.67 0.45 0.54
Cell division cycle 34 H20743 CDC34 0.65 0.56 0.51
Cell division cycle 42 (GTP-binding protein, 25 kDa) AA630164 CDC42 0.67 0.4 0.42
Colony-stimulating factor 1 receptor T46880 CSF1R 0.67 0.45 0.54
Cyclin-dependent kinase inhibitor 1C (p57, Kip2) AI676118 CDKN1C 0.67 0.57 0.54
Neuroblastoma candidate region, suppression of
tumorigenicity 1 AA598830 NBL1 0.79 0.53 0.72
Cytochrome
Cytochromecoxidase subunit Vb AI688757 COX5B 0.64 0.38 0.33
Cytochromecoxidase subunit VIa polypeptide 1 AA482243 COX6A1 0.86 0.42 0.37
Cytochromecoxidase subunit VIIa polypeptide 1
(muscle) AA872125 COX7A1 0.73 0.53 0.58
Cytochromecoxidase subunit VIIa polypeptide 2 (liver) AI002403 COX7A2 0.9 0.75 0.67
Cytochromecoxidase subunit VIIc AA629719 COX7C 0.3 0.53 0.52
Cytochromec-1 AA447774 CYC1 0.71 0.37 0.23
Cytoskeleton
Acid phosphatase 2, lysosomal T48864 ACP2 0.77 0.65 0.4
Actin, alpha 2, smooth muscle, aorta AA634006 ACTA2 0.76 0.47 0.44
Actin, gamma 2, smooth muscle, enteric T60048 ACTG2 0.65 0.47 0.42
Collagen, type IV, alpha 2 AA430540 COL4A2 0.74 0.26 0.34
Collagen, type IV, alpha 5 (Alport syndrome) AA953254 COL4A5 0.84 0.35 0.18
Collagen, type VI, alpha 2 AA633747 COL6A2 0.74 0.51 0.59
Keratin 16 (focal nonepidermolytic palmoplantar
keratoderma) AA928454 KRT16 0.26 0.2 0.16
Myosin, heavy polypeptide 9, nonmuscle T69926 MYH9 0.48 0.65 0.25
Myosin, light polypeptide 1, alkali; skeletal, fast T52894 MYL1 0.78 0.6 0.53
Keratin 19 AA464250 KRT19 0.25 0.32 0.2
Profilin 2 AA040703 PFN2 0.76 0.65 0.45
Rho GDP dissociation inhibitor alpha AA459400 ARHGDIA 0.35 0.24 0.39
Tubulin-specific chaperone d AI668870 TBCD 0.85 0.57 0.49
Tubulin, alpha 2 AA626698 TUBA2 0.82 0.52 0.77
Actin-related protein 2/3 complex, subunit 1A (41 kDa) AA490209 ARPC1A 0.73 0.46 0.36
Continued on facing page
on November 8, 2019 by guest
http://jvi.asm.org/
an internal control. The RT-PCR data confirmed the microar-ray results, showing the same relative transcription regulation of the selected genes (Table 3). These findings validate those of the Northern and microarray analyses. Absolute values are not identical when microarray and RT-PCR data are com-pared, probably due to intrinsic differences in the techniques.
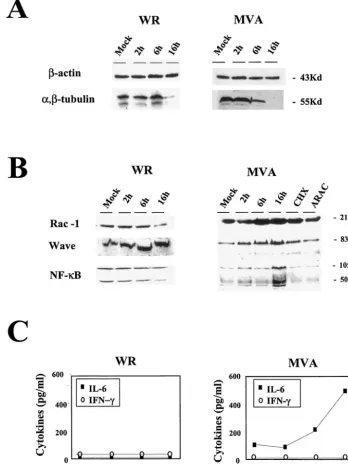
Target verification by Western blot analysis and ELISA of representative cell proteins.To correlate transcription changes with protein levels, we defined the effects of MVA infection on some cellular components, analyzing protein expression levels by Western blotting. After MVA infection, microarray data indicated that tubulin expression was downregulated (Table 2),
a finding confirmed by Western blotting (Fig. 5A). Although actin gene expression was downregulated after 2 h postinfec-tion in microarray analysis (Table 2), the protein was present in equal amounts in mock-infected and MVA-infected cells at 2, 6, and 16 h postinfection (Fig. 5A). This result is probably due to the stability of actin. Similar results were obtained with WR-infected HeLa cells (Fig. 5A). These findings show that the correlation between mRNA and protein levels depends on protein stability.
[image:10.603.59.540.77.560.2]For other proteins, we confirmed microarray data with pro-tein expression patterns. For these analyses, we used the Rho family small GTP-binding protein (RAC-1), the WASP family
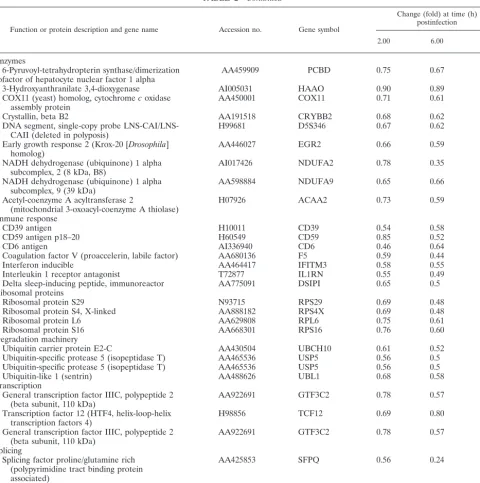
TABLE 2—Continued
Function or protein description and gene name Accession no. Gene symbol
Change (fold) at time (h) postinfection
2.00 6.00 16.00
Enzymes
6-Pyruvoyl-tetrahydropterin synthase/dimerization
cofactor of hepatocyte nuclear factor 1 alpha AA459909 PCBD 0.75 0.67 0.62
3-Hydroxyanthranilate 3,4-dioxygenase AI005031 HAAO 0.90 0.89 0.6
COX11 (yeast) homolog, cytochromecoxidase
assembly protein AA450001 COX11 0.71 0.61 0.61
Crystallin, beta B2 AA191518 CRYBB2 0.68 0.62 0.62
DNA segment, single-copy probe
LNS-CAI/LNS-CAII (deleted in polyposis) H99681 D5S346 0.67 0.62 0.64
Early growth response 2 (Krox-20 [Drosophila]
homolog) AA446027 EGR2 0.66 0.59 0.61
NADH dehydrogenase (ubiquinone) 1 alpha
subcomplex, 2 (8 kDa, B8) AI017426 NDUFA2 0.78 0.35 0.31
NADH dehydrogenase (ubiquinone) 1 alpha
subcomplex, 9 (39 kDa) AA598884 NDUFA9 0.65 0.66 0.59
Acetyl-coenzyme A acyltransferase 2
(mitochondrial 3-oxoacyl-coenzyme A thiolase) H07926 ACAA2 0.73 0.59 0.56
Immune response
CD39 antigen H10011 CD39 0.54 0.58 0.85
CD59 antigen p18–20 H60549 CD59 0.85 0.52 0.44
CD6 antigen AI336940 CD6 0.46 0.64 0.41
Coagulation factor V (proaccelerin, labile factor) AA680136 F5 0.59 0.44 0.40
Interferon inducible AA464417 IFITM3 0.58 0.55 0.24
Interleukin 1 receptor antagonist T72877 IL1RN 0.55 0.49 0.46
Delta sleep-inducing peptide, immunoreactor AA775091 DSIPI 0.65 0.5 0.26
Ribosomal proteins
Ribosomal protein S29 N93715 RPS29 0.69 0.48 0.37
Ribosomal protein S4, X-linked AA888182 RPS4X 0.69 0.48 0.37
Ribosomal protein L6 AA629808 RPL6 0.75 0.61 0.48
Ribosomal protein S16 AA668301 RPS16 0.76 0.60 0.54
Degradation machinery
Ubiquitin carrier protein E2-C AA430504 UBCH10 0.61 0.52 0.39
Ubiquitin-specific protease 5 (isopeptidase T) AA465536 USP5 0.56 0.5 0.50
Ubiquitin-specific protease 5 (isopeptidase T) AA465536 USP5 0.56 0.5 0.50
Ubiquitin-like 1 (sentrin) AA488626 UBL1 0.68 0.58 0.5
Transcription
General transcription factor IIIC, polypeptide 2
(beta subunit, 110 kDa) AA922691 GTF3C2 0.78 0.57 0.52
Transcription factor 12 (HTF4, helix-loop-helix
transcription factors 4) H98856 TCF12 0.69 0.80 0.84
General transcription factor IIIC, polypeptide 2
(beta subunit, 110 kDa) AA922691 GTF3C2 0.78 0.57 0.52
Splicing
Splicing factor proline/glutamine rich (polypyrimidine tract binding protein associated)
AA425853 SFPQ 0.56 0.24 0.44
Splicing factor (CC1.3) AA193573 CC1.3 0.65 0.62 0.23
aGenes in each cluster are grouped according to predicted biological function.
on November 8, 2019 by guest
http://jvi.asm.org/
member WAVE (WASF1), and the nuclear factor kappa light polypeptide (NFK1). The RAC-1 protein signal increased in MVA-infected cells, with a peak at 6 h postinfection (Fig. 5B). At this time point, the amount of RAC-1 in MVA-infected cells was about threefold higher than that in control cells. WAVE showed a peak of expression at 16 h postinfection, when the amount of protein was about threefold higher than that in control cells. NF-B protein expression was more than threefold higher than that in controls at 16 h postinfection, whereas there was no evidence of protein increases at early times postinfection (Fig. 5B). In the case of WR-infected cells, WAVE protein levels were similar for WR- and MVA-infected cells. RAC-1 and NF-B showed different levels of protein expression at 16 h postinfection; these levels increased with MVA infection and decreased with WR infection (Fig. 5B). Evidence that viral late gene functions are necessary for the increases in RAC-1, WAVE, and NF-B protein levels was
obtained (Fig. 5B) by Western blot analysis of MVA-infected cells cultured in the presence of cytosine-arabinoside (AraC) and an inhibitor of viral DNA replication (21). Moreover, the increase in RAC-1, WAVE, and NF-B protein expression required de novo protein synthesis, since the accumulation of these proteins was prevented by cycloheximide treatment (Fig. 5B). This result eliminates the possibility that MVA infection might increase protein levels by enhancing protein stability.
We further analyzed the levels of IL-6 and IFN-␥secreted after MVA infection to confirm the data obtained by microar-rays and quantitative RT-PCR. The amounts of secreted IL-6 and IFN-␥were determined by ELISA with uninfected and MVA-infected HeLa cells (5 PFU/cell) at 2, 6, and 16 h postin-fection. In agreement with data obtained in microarray and quantitative RT-PCR analyses, there was no detectable IFN-␥
in supernatants from MVA-infected cells (Fig. 5C). In con-trast, we observed a strong increase with time in the amount of secreted IL-6 after MVA infection, in full agreement with the microarray and quantitative RT-PCR data (Fig. 5C). When HeLa cells were WR-infected, no IL-6 or IFN-␥was detected by ELISA in cell-free supernatants (Fig. 5C).
DISCUSSION
The interaction between viruses and the host cell are com-plex, multifaceted processes. While viruses attempt to take over cellular functions to their advantage, the cell counteracts by mounting a variety of defensive responses that may include induction of interferon, stress response, or apoptotic pathways, all of which are accompanied by changes in gene expression.
In this study, we analyzed the response of the human HeLa cell line to MVA infection by using cDNA microarrays. It was reported previously that MVA undergoes limited replication in HeLa cells (7, 11, 14); virus replication is restricted during infection of HeLa cells after immature virions are formed (7, 14, 34, 36), allowing efficient production of proteins (33, 37, 42). Due to the interest in MVA-based vectors as potential vaccines against pathogens and tumors and current phase I clinical trials with this vector, there is a need to understand the host response to MVA infection. We used microarrays to an-alyze the changes in host gene expression profiling after MVA infection of cultured human cells.
A total of 410 of 13,295 genes in the array were significantly regulated after MVA infection and assigned to 11 clusters (Fig. 2). Clusters 1 and 2 included 68 genes that were upregulated at 2, 6, and 16 h postinfection. A total of 58 genes were identified in cluster 3; their expression increased at 2 and 6 h postinfec-tion. In cluster 4, we observed 15 genes upregulated at 6 and 16 h postinfection. In cluster 5, 11 genes were downregulated at 2 h but upregulated at 6 and 16 h postinfection. The 11 genes in cluster 6 were upregulated only at 2 h postinfection. The remaining genes, a total of 247, were downregulated with dif-ferent expression profiling and are represented in clusters 6 to 11 (Table 2). Indeed, these findings differ from the host tran-scriptional responses observed after WR infection, for which only 37 cellular genes were upregulated in HeLa cells infected at 2, 6, and 16 h postinfection (17). A comparison of gene expression profiles based on data obtained in this study and those from previous work with WR (17) is shown for repre-sentative genes in Table 4. In MVA- or WR-infected HeLa
[image:11.603.88.236.72.253.2]FIG. 4. Validation of microarray data by Northern blotting. Total RNA (20g) purified from uninfected or MVA-infected cells at 2, 6, and 16 h postinfection was hybridized with probes derived from the PCR products spotted on the microarray. Genes included in the au-toradiogram are H2AFN (histone N), WASF1 (Wiskott-Aldrich syn-drome protein), H2FB (histone B), FLJ20643 (EST), and APEXL2 (apurinic/apyridiminic endonuclease). hpi, hours postinfection.
TABLE 3. Confirmation of microarray data by quantitative real-time RT-PCRa
Gene product
Change (fold) determined by assay at time (h) postinfection
Microarray RT-PCR
2 6 16 2 6 16
H2BFB 9.92 10.20 17.03 25 18 19
PCNT2 3.94 3.14 2.17 4.36 4.44 3.4
WASF1 3.01 2.66 1.11 3.73 2.72 1.53
WAS 2.58 2.25 1.61 5.08 15.2 2.3
IL7 6.10 5.30 3.2 6.86 5.8 4.9
IL6 2.45 3.02 1.90 1.75 2.07 2.28
IFNG 1.27 1.36 1.45 1.35 1.15 1.19
APEXL2 1.10 0.98 1.11 0.96 1.2 0.84
FLJ 0.98 1.25 1.01 1.1 1.02 0.93
aRT-PCR conditions are described in Materials and Methods.
on November 8, 2019 by guest
http://jvi.asm.org/
cells, there is a group of cellular genes upregulated by both viruses; other genes are upregulated selectively by MVA or WR, and a large number of genes are downregulated by both viruses. These results suggest that MVA and WR use different strategies to regulate cellular transcriptional responses, prob-ably as a consequence of deletions in the MVA genome. This idea is supported by the observed differences in MVA-induced CPE and shutoff of host protein synthesis and those induced by WR (Fig. 1) and is consistent with previous results of analyses of the biology of MVA (14, 33).
Examination and analysis of the list of the cellular genes upregulated by MVA indicated several gene families with sig-nificant, distinct biological functions (Table 1). Some of these groups include genes involved in adhesion, the cytoskeleton, the cell cycle, apoptosis, histone, and immune modulation. Some of these genes may be involved in processes such as viral replication or cell defense.
[image:12.603.116.465.79.544.2]Transcription of several genes involved in the immune re-sponse (20 transcripts) was activated by MVA infection. At least five cytokines (IL-1A, IL-6, IL-7, IL-8, and IL-15) and five
FIG. 5. Validation of microarray data by protein level and comparison between MVA and WR infections. Shown are Western blots of different cellular proteins at various times (2, 6, and 16 h postinfection). (A) Actin and tubulin protein levels in HeLa cells (5 PFU/cell). (B) RAC-1, WAVE, and NF-B protein levels in MVA- or WR-infected HeLa cells (5 PFU/cell) and in cells infected with MVA in the presence of cycloheximide (CHX; 100g/ml) or cytosine arabinoside (ARAC; 50g/ml) for 16 h. (C) Levels of IL-6 and IFN-␥secreted from HeLa cells after MVA or WR infection (5 PFU/cell), as determined by ELISA. Protein levels of IL-6 and IFN-␥in supernatants of uninfected and MVA- or WR-infected cells were measured at 2, 6, and 16 h postinfection. Duplicate samples were measured in two independent experiments. Kd, kilodaltons
on November 8, 2019 by guest
http://jvi.asm.org/
members of the tumor necrosis factor receptor (TNF) family (TNFRSF7, TNFAIP3, TNFRSF14, TNFRSF17, and TRAF3) were upregulated in response to MVA. Genes encoding CD47 and CD80 antigens showed marked inductions at early and late times after MVA infection (Table 1). The immune modulator gene IL-7 upregulation was more than sixfold compared to levels for control cells at early times postinfection (Table 1), a result validated by quantitative RT-PCR (Table 3). The MVA-induced increase in IL-15 gene expression is a characteristic also observed for other viruses (3). At the protein level, we observed elevated IL-6 levels in supernatants from MVA-in-fected HeLa cells but not in those from cells inMVA-in-fected with WR (Fig. 5C). A similar increase in IL-6 and TNF-␣ levels was found in spleen homogenates from MVA-infected mice but not in those from WR-infected mice (33). These results
indi-cate that MVA and WR induce different proinflammatory cytokine profiles both in vivo and in vitro.
[image:13.603.47.540.81.508.2]We observed clear upregulation of NF-B expression during MVA infection, as determined by mRNA (Table 1) and pro-tein levels (Fig. 5B). In the case of WR, NF-B expression was downregulated at late times postinfection (Table 4). The in-crease in NF-B protein required viral DNA replication, as seen with cells infected in the presence of adenosine arabino-side, an inhibitor of virus DNA synthesis. Moreover, the in-crease in NF-B protein levels required de novo protein syn-thesis, as observed after cycloheximide treatment (Fig. 5B). These findings concur with the observation by Oie and Pickup (31) of an increase in NF-B activity in extracts from MVA-infected 293 cells but not in cells MVA-infected with the Copenhagen strain of VV. The NF-B family has a central role in the
TABLE 4. Representative gene expression profiling of WR and MVA strains in human HeLa cellsa
Effect and gene name Gene symbol
Change (fold) with strain at time (h) postinfection
MVA WR
2 6 16 2 6 16
Increased genes in MVA and WR
Pericentrin PCNT 3.94 3.14 2.38 3.20 7.11 1.58
Claudin 3 CLDN3 2.54 2.48 1.32 1.78 2.13 2.30
H3 histone family, member B H3FB 16.34 15.67 21.71 4.92 1.12 1.11
CD80 antigen CD80 4.29 3.36 2.57 1.75 2.58 2.06
Thymosin beta 4 X chromosome TMSB4X 3.81 5.7 2.91 3.81 5.70 2.91
Adenosine A2a receptor, ADORA2A 3.89 4.14 4.11 3.89 4.14 4.11
WAS protein family, member 1 WASF1 3.01 2.66 2.11 2.35 2.43 2.99
H3 histone family, member B H3FB 16.34 15.67 21.71 1.17 1.12 1.11
H4 histone family, member D H4FD 12.38 24.93 24.93 2.41 0.97 1.01
H2B histone family, member B H2BFB 9.92 10.20 17.03 5.94 0.78 0.61
Increased genes in MVA
Interleukin 7 IL-7 6.1 5.3 3.2 1.12 0.95 0.76
B7 protein B7 1.97 1.75 3.53 1.03 0.94 0.88
CD47 antigen CD47 5.35 4.08 3.16 1.1 0.99 1.01
Interleukin 6 IL-6 2.65 2.14 1.56 1.32 0.87 1.06
Nuclear factor of kappa light polypeptide epsilon NFKBIE 2.41 1.61 1.12 1.01 1.01 0.75
Mitogen-activated protein kinase kinase 5 MAP2K5 2.37 2.74 1.69 1.06 1.23 0.69
Nuclear factor (erythroid-derived 2)-like 3 NFE2L3 2.36 2.36 2.52 1.12 0.89 1.01
Nuclear factor of kappa light polypeptide 2 NFKB2 2.03 2.22 2.34 1.2 0.54 0.59
Kinesin family member 5A KIF5A 2.05 1.88 1.73 2.31 0.17 0.17
Nuclear factor of activated T cells, cytoplasmic 3 NFATC3 3.46 2.97 1.30 1.01 0.97 1.33 Increased genes in WR
Diacylglycerol kinase delta DGKD 1.32 1.56 1.59 2.01 1.17 0.9
Selenophosphate synthetase SPS 1.12 1.32 0.95 3.73 7.11 2.17
Glutamate decarboxylase 2 (pancreatic islets and brain, 65 kDa) GAD2 1.98 1.1 0.74 3.56 2.38 3.14
Golgi resident protein GCP60 1.02 0.87 0.65 1.41 2.00 1.79
Decreased genes in MVA and WR
ATP synthase, subunit c (subunit 9), isoform 2 ATP9C2 0.84 0.21 0.16 1.43 0.20 0.09
ATP synthase, subunit b, isoform 1 ATP1B 0.53 0.40 1.12 1.39 0.18 0.12
Cytochromec-1 CYC1 0.71 0.37 0.23 0.30 0.21 0.04
Tubulin, beta 2 TUBB2 0.84 0.79 0.48 0.73 0.22 0.26
Actin, alpha 2, smooth muscle, aorta ACTA2 0.76 0.47 0.44 0.84 0.56 0.12
Interleukin 1 receptor antagonist IL1RN 0.55 0.49 0.46 0.15 0.21 0.18
Macrophage stimulating 1 (hepatocyte growth factor-like) MST1 0.68 0.65 0.74 0.55 0.16 0.11
Ribosomal protein S27a RPS27A 0.85 0.58 0.72 0.84 0.34 0.43
Ribosomal protein S28 RPS28 0.89 0.63 0.69 0.65 0.31 0.41
Ubiquitin carrier protein E2-C UBCH10 0.61 0.52 0.39 0.78 0.24 0.26
Proteasome (prosome, macropain) subunit, beta type 3 PSMB3 0.98 0.69 0.71 0.50 0.17 0.17
aRepresentative groups of genes from the microarray data obtained for MVA (this report) and from previous work with WR (17) were selected according to their
up- or downregulation. For comparative purposes, we show cellular genes that are upregulated by both viruses, genes that are upregulated selectively by MVA or WR, and genes that are downregulated by the two viruses. Genes in each cluster were grouped according to predicted biological function.
on November 8, 2019 by guest
http://jvi.asm.org/
transcriptional regulation of inflammatory cytokines and other genes essential for activating immune responses (10). NF-B also regulates the expression of genes involved in the control of cell proliferation and apoptosis (10, 31). It can be speculated that the increase observed in NF-B mRNA and protein levels in response to MVA infection corresponds to enhanced NF-B activity. An increase in NF-B protein levels, together with the IB-␣degradation previously observed in MVA-infected cells (31), will contribute to the transcription of B-dependent genes and to the clearance of virus infection as a result of the induction of apoptosis and specific immune responses. Since MVA has large genome deletions, viral genes that interfere with NF-B, present in orthopoxviruses, might be absent (31). In accord with previous microarray results for WR-infected cells (17), we observed increased levels of WASF1, claudin 3, CD-80, thymosin-beta-4, and adenosine-A2a receptor during MVA infection (Table 4). Comparison of WR and MVA none-theless showed differences in expression levels of other genes, including kinesin-5 and histone family members, during infec-tion. In WR-infected cells, these genes were upregulated early but not late in infection, whereas in MVA-infected cells, levels were maintained throughout infection. Among genes with an important role in motility and WR spreading is the Wiskott-Aldrich syndrome protein family member N-WASP (WASL gene) (13). WAS and WASF1 were upregulated in MVA-infected cells, whereas in WR-MVA-infected cells, only WASF1 was upregulated. Significantly, the small GTP-binding protein RAC-1 was also induced after MVA infection. Although the role of WAS proteins in the cell is well established (6, 27), the biological meaning of WASP family upregulation by a nonpro-ductive virus is not immediately clear, in contrast to the case for WR, in which it appears to be important for viral spreading (6, 26, 38, 39).
It was reported that MVA has lost functional receptors for TNF, IFN-␥, IFN␣/, and CC chemokines (4, 7, 28, 29). The absence of these viral proteins and the induction of different host immune response molecules such as TNF may be the reason for MVA attenuation and for the potent immune re-sponse elicited by MVA recombinants to specific antigens compared with that elicited by VV recombinants (33). Induc-tion of innate and adaptive immune responses during MVA infection could have a beneficial effect when MVA is used as a vaccine. MVA is known to trigger a poor immune response against itself, while it activates a potent immune response to specific antigens delivered by the vector (33). The enhanced expression of genes encoding immunomodulatory molecules (Table 1) during MVA infection might create a microenviron-ment that allows antigen-presenting cells and activated T cells to help expand CD4⫹ and CD8⫹ T cell populations. This
possibility may be relevant when immunization protocols that include prime-booster immunization with heterologous vectors are used (33, 35). Maintenance of specific T cells could con-tribute to MVA-induced expression of cytokines such as IL-15. MVA induction of cellular genes with immunomodulatory functions may be a major contributing factor in the enhanced immunogenicity of MVA-derived vaccines.
In conclusion, through analyses of host cell gene expression profiling after MVA infection of cultured human cells, we found a number of cellular genes whose expression levels are markedly modified by MVA infection and suggest potential
roles as regulators of viral infection. Some of these upregu-lated genes may be involved in the enhanced immune response to specific antigens observed in animals after infection with MVA recombinants. Identification of genes that are differen-tially regulated and the characterization of their functions is important when the potential benefit of MVA as a vector for vaccination against pathogens and tumors is considered.
ACKNOWLEDGMENTS
We are indebted to R. Bablanian, M. Krupa, and C. Mark for critical reviews of the manuscript, to J. C. Gallego for kindly providing the RAC-1 antibody, to J. C. Oliveros for bioinformatic assistance, and to V. Jime´nez for expert technical assistance.
This work was supported by grants from the Spanish Ministry of Science and Technology (grants BIO2000-0340P4 and BIO2001-2269), the Spanish Foundation for AIDS Research (grant FIPSE 36344/02), and the EU (grants QLRT-PL-1999-01321 and QLK2-CT-2002-01867) to M.E. A.P.-M was partially supported by Spanish CICYT grant number BIO2001-1237. The Department of Immunology and Oncol-ogy was founded and is supported by the Spanish Council for Scientific Research (CSIC) and Pfizer.
REFERENCES
1. Altenburger, W., C.-P. Su¨tter, and J. Altenburger.1989. Partial deletion of the human host range in the attenuated vaccinia virus MVA. Arch. Virol.
105:15–27.
2. Antonie, G., F., Scheiflinger, F. Dorner, and F. G. Falkner.1998. The com-plete genomic sequence of the modified vaccinia Ankara strain: comparison
with other orthopoxviruses. Virology244:365–396.
3. Azimi, N., K. Brown, R. N. Bamford, Y. Tagaya, U. Siebenlist, and T. A. Waldmann. 1998. Human T cell lymphotropic virus type I Tax protein
trans-activates interleukin 15 gene transcription through an NF-B site.
Proc. Natl. Acad. Sci. USA95:2452–2457.
4. Blanchard, T. J., A. Alcamí, P. Andrea, and G. L. Smith.1998. Modified vaccinia virus Ankara undergoes limited replication in human cells and lacks several immunomodulatory proteins: implication for use as a human vaccine.
J. Gen. Virol.79:1159–1167.
5. Bolt, G., K. Berg, and M. Blixenkrone-Moller.2002. Measles virus-induced
modulation of host-cell gene expression. J. Gen. Virol.83:1157–1165.
6. Caron, E.2002. Regulation of Wiskott-Aldrich syndrome protein and related
molecules. Curr. Opin. Cell Biol.14:82–87.
7. Carroll, M. W., and B. Moss.1997. Host range and cytopathogenicity of the highly attenuated MVA strain of vaccinia virus: propagation and generation
of recombinant viruses in a nonhuman mammalian cell line. Virology238:
198–211.
8. Carroll, M. W., W. W. Overwijk, R. S. Chamberlain, S. A. Rosenberg, B. Moss, and N. P. Restifo.1997. Highly attenuated modified vaccinia virus Ankara (MVA) as an effective recombinant vector: a murine tumor model.
Vaccine15:387–394.
9. Chang, Y. E., and L. A. Laimins.2000. Microarray analysis identifies inter-feron-inducible genes and stat-1 as major transcriptional target of human
papillomavirus type 31. J. Virol.74:4174–4182.
10. Chen, F., V. Castranova, X. Shi, and L. M. Demers.1999. New insights into
the role of nuclear factor-B, a ubiquitous transcription factor in the
initi-ation of diseases. Clin. Chem.45:7–17.
11. Drexler, I., K. Heller, B. Wahren, V. Erfle, and G. Su¨tter.1998. Highly attenuated modified vaccinia virus Ankara replicates in baby hamster kidney cells, a potential host for virus propagation, but not in various human
trans-formed and primary cells. J. Gen. Virol.79:347–352.
12. Eisen, M. B., P. T. Spellman, P. O. Brown, and D. Botstein.1998. Cluster analysis and display of genome-wide expression patterns. Proc. Natl. Acad.
Sci. USA95:14863–14868.
13. Frischknecht, F., V. Moreau, S. Rottger, I. Reckmann, C. Superti-Furga, and M. Way.1999. Actin based motility of vaccinia virus mimics receptor tyrosine
kinase signalling. Nature404:1007–1011.
14. Gallego-Go´mez, J. C., C. Risco, D. Rodriguez, P. Cabezas, S. Guerra, J. L. Carrascosa, and M. Esteban.2003. Differences in virus-induced cell mor-phology and virus maturation between the WR and MVA strains of vaccinia
virus. J. Virol.77:10606–10622.
15. García de la Nava, J., D. Franco Santaella, J. Cuenca Alba, J. M. Carazo, O. Trelles, and A. Pascual-Montano.2003. Engene: the processing and
explor-atory analysis of gene expression data. Bioinformatics19:657–658.
16. Geiss, G. K., R. E. Bumgarner, M. C. An, A. B. Agy, A. B. van’t Wout, E. Hammersmark, V. S. Carter, D. Upchurch, J. I. Mullins, and M. G. Katze.
2001. Large-scale monitoring of host gene expression during HIV-1 infection
using cDNA microarrays. Virology266:8–16.
on November 8, 2019 by guest
http://jvi.asm.org/
17. Guerra, S., L. A. Lo´pez-Fernandez, A. Pascual-Montano, M. Mun˜oz, K. Harshman, and M. Esteban.2003. Cellular gene expression survey of
vac-cinia virus infection of human HeLa cells. J. Virol.77:6493–6506.
18. Hirsch, V. M., T. R. Fuerst, G. Sutter, M. W. Carroll, L. C. Yang, S. Goldstein, M. Piatak, Jr., W. R. Elkins, W. G. Alvord, D. C. Montefiori, B. Moss, and J. D. Lifston.1996. Patterns of viral replication correlate with outcome in simian immunodeficiency virus (SIV)-infected macaques: effect of prior immunization with a trivalent SIV vaccine in modified vaccinia virus
Ankara. J. Virol.70:3741–3752.
19. Hughes, T. R., M. J. Marton, A. R. Jones, C. J. Roberts, R. Stoughton, C. D. Armour, H. A. Bennett, E. Coffey, H. Dai, Y. D. He, M. J. Kidd, A. M. King, M. R. Meyer, D. Slade, P. Y. Lum, S. B. Stepaniants, D. D. Shoemaker, D. Gachotte, K. Chakraburtty, J. Simon, M. Bard, and S. H. Friend.2000.
Functional discovery via a compendium of expression profiles. Cell102:109–
126.
20. Jones, J. O., and A. M. Arvin.2003. Microarray analysis of host cell gene transcription in response to Varicella-Zoster virus infection of human T cells
and fibroblasts in vitro and SCIDhu skin xenografts in vivo. J. Virol.77:
1268–1280.
21. Keck, J. G., C. J. Baldick, Jr., and B. Moss.1990. Role of DNA replication in vaccinia virus gene expression: a naked template is required for
transcrip-tion of three late trans-activator genes. Cell61:801–809.
22. Kohonen, T.1997. Self-organizing maps, 2nd ed. Springer-Verlag, Heidel-berg, Germany.
23. Mahnel, H., and A. Mayr.2002. Experiences with immunization against orthopox viruses of humans and animals using vaccine strain MVA. Berl.
Muench. Tieraerztl. Wochenschr.107:253–256.
24. Mayr, A., H. Stickl, H. K. Muller, K. Danner, and H. Singer.1978. The smallpox vaccination strain MVA: marker, genetic structure, experience gained with parenteral vaccination and behaviour in organism with a
debil-itated defense mechanism. Zentbl. Bakteriol. B167:375–390.
25. Meyer, H., G. Sutter, and A. Mayr.1991. Mapping of deletions in the genome of highly attenuated vaccinia virus MVA and their influence on
virulence. J. Gen. Virol.72:1031–1038.
26. Miki, H., K. Minura, and T. Takenawa.1996. N-WASP, a novel actin-depolymerizing protein, regulates the cortical cytoskeletal rearrangement in
a PIP2-dependent manner downstream of tyrosine kinases. EMBO J.15:
5326–5335.
27. Moreau, V., F. Frischknecht, I. Reckmann, G. Superti-Furga, and M. Way.
2000. A complex of N-WASP and WIP integrates signalling cascades that
lead to actin polymerization. Nat. Cell Biol.2:441–448.
28. Moss, B., M. W. Carroll, L. S. Wyatt, J. R. Bennink, V. M. Hirsch, S. Golldstein, W. R. Elkins, W. Overwijk, R. Chamberlain, S. A. Rosenberg, and G. Sutter.1996. Host range restricted, non-replicating vaccinia virus
vectors as vaccine candidates. Adv. Exp. Med. Biol.397:7–13.
29. Moss, B., and J. L. Shisler.2001. Immunology 101 at poxvirus U: immune
evasion genes. Semin. Immunol.13:59–66.
30. Nees, N., J. M. Geoghegan, T. Hyman, S. Frank, L. Miller, and C. D.
Woodworth.2001. Papillomavirus type 16 oncogenes downregulate expres-sion interferon-responsive genes and upregulate proliferation-associated and
NF-〉-responsive genes in cervical keratinocytes. J. Virol.75:4283–4296.
31. Oie, L. K., and D. Pickup.2001. Cowpox and other members of the or-thopoxvirus genus interfere with the regulation of NF-KB activation.
Virol-ogy288:175–187.
32. Quackenbush, J.2002. Microarray data normalization and transformation.
Nat. Genet.32:496–501.
33. Ramirez, J. C., M. M. Gherardi, and M. Esteban.2000. Biology of attenu-ated modified vaccinia virus Ankara recombinant vector in mice: virus fate and activation of B- and T-cell immune responses in comparison with the
Western Reserve strain and advantages as a vaccine. J. Virol.74:923–933.
34. Sancho, M. C., S. Schleich, G. Griffiths, and J. Krijnse-Locker.2002. The block in assembly of modified vaccinia virus Ankara in HeLa cells reveals
new insights into vaccinia virus morphogenesis. J. Virol.76:8318–8334.
35. Schneider, J., S. C. Gilbert, T. J. Blanchard, T. Hanke, K. J. Robson, C. M. Hannan, M. Becker, R. Sinden, G. L. Smith, and A. V. S. Hill.1998.
En-hanced immunogenicity for CD8⫹T cell induction and complete protective
efficacy of malaria DNA vaccination by boosting with modified vaccinia virus
Ankara. Nat. Med.4:397–402.
36. Su¨tter, G., and B. Moss.1992. Nonreplicating vaccinia vector efficiently
expresses recombinant genes. Proc. Natl. Acad. Sci. USA89:10847–10851.
37. Su¨tter, G., L. S. Wyatt, P. L. Foley, J. R. Benninnk, and B. Moss.1994. A recombinant vector derived from the host range-restricted and highly atten-uated MVA strain of vaccinia virus stimulates protective immunity in mice to
influenza virus. Vaccine12:1032–1040.
38. Symons, M., J. M. Derry, B. Karlak, S. Jiang, V. Lemahieu, F. McCormick, U. Francke, and A. Abo.1996. Wiskott-Aldrich syndrome protein, a novel effector for the GTPase Cdc42Hs, is implicated in actin polymerization. Cell
84:723–734.
39. Takenawa, T., and H. Miki.2001. WASP and WAVE family proteins: key molecules for rapid rearrangement of cortical actin filaments and cell
move-ment. J. Cell Sci.114:1801–1809.
40. Tamayo, P., D. Slonim, J. Mesirov, Q. Zhu, E. Dmitrovsky, E. S. Lander, and T. R. Golub.1999. Interpreting patterns of gene expression with self-orga-nizing maps: methods and application to hematopoietic differentiation. Proc.
Natl. Acad. Sci USA96:2907–2912.
41. van ’t Wout, A. B., G. K. Lehrman, S. A. Mikheeva, G. C. O’Keeffe, M. G. Katze, R. E. Bumgarner, G. K. Geiss, and J. I. Mullins.2003. Cellular gene
expression upon human immunodeficiency virus type 1 infection of CD4⫹
-T-cell lines. J. Virol.77:1392–1402.
42. Wyatt, L. S., M. W. Carroll, C.-P. Czerny, M. Merchlinsky, J. R. Sisler, and B. Moss.1998. Marker rescue of the host range restrictions defects of
modified vaccinia virus Ankara. Virology251:334–342.
43. Zhu, H., J. P. Cong, G. Mantora, T. Gineras, and T. Shenk.1998. Cellular gene expression altered by human cytomegalovirus: global monitoring with
oligonucleotide arrays. Proc. Natl. Acad. Sci. USA95:14470–14475.