Article
Experimental Study & Optimization of Machining
Parameters in Turning of AISI 1040 Steel with
Micro-grooved WC Cutting Tools
P. N. L. Pavani
1,*, C. L. V. R. S. V. Prasad
1, and K. Ramji
21 Department of Mechanical Engineering, GMR Institute of Technology, Rajam, Andhra Pradesh, India 2 Department of Mechanical Engineering, Andhra University, Visakhapatnam, Andhra Pradesh, India
*E-mail: [email protected](Corresponding author)
Abstract. In dry turning, control over chip formation and the need for the automated machining lead to an advancement in cutting tools. Such concern towards chip breakability is necessary in reducing tool wear, tool tip temperatures and surface roughness of workpiece material. The present study proposes a new development in the traditionally available cutting tools, which acts like a chip breaker. A series of micro-grooves are machined on the rake face of Tungsten carbide (WC) cutting tools using sinker Electric Discharge Machine (EDM). These micro-grooved tools are used to dissolve long continuous chips and heat from the cutting zone in the dry machining of AISI 1040 steel. The results of micro-grooved cutting tools have shown improvement in reducing the tool tip temperatures and surface roughness compared to the conventional cutting tools. The consolidated chip flow phenomenon of plain WC tools is used to decide the location of micro-grooves on the tool rake face. A Taguchi orthogonal array is used to design an experimental layout with minimum number of repetitions in the experiments. Signal-to-noise ratios and ANOVA is used to understand and identify the significant factors & their level among the input variables on responses.From the results, it is identified that the cutting speed is the most influencing parameter for tool tip temperature at level 1 (i.e.112 m/min) and surface roughness at level 5(i.e.720 m/min).
Keywords: Dry machining, rake face, sinker EDM, micro-grooves, signal-to-noise ratios and ANOVA.
ENGINEERING JOURNAL Volume 21 Issue 4 Received 6 October 2016
Accepted 27 December 2016 Published 31 July 2017
1.
Introduction
Dry, semi dry and MQL (Green Machining) techniques have already proven that they can reduce the lubrication costs approximately by 15%. These techniques can also be used to decrease the environmental pollution compared to the conventional methods. According to Ghosh and Mallik(1985) natural roughness depends on tool geometry, built up edge formation, chips and cutting parameters especially on cutting speed [1]. In turning, chip formation and its analysis is necessary because the formation of continuous or discontinuous chips may lead to high cutting forces, heat generation and poor surface quality. Asthakov et al. (1997) presented a classification of chip structures based on mechanics of its formation. Generally chips are classified into various types based on its post process analysis. Authors have proposed a new technique to classify the chips based on chip structure, chip stress and strains as a result of chip formation dynamics. This technique can be used to predict the chip breakability [2]. Miroslav Neslusan et al. (2011) analyzed the chip formation in machining of annealed and hardened roll bearing steel through acoustic emission technique. As per the results, it has been identified that the segmented chips are formed while turning hardened steel and its frequency was found to be very high [3]. Sutter et al.(1997) designed a new device to study the cutting process and chip formation under high speed machining conditions. The device enables to investigate orthogonal cutting process at various ranges of speeds starting from 1 m/sec to 100 m/sec. During machining it was observed that both continuous and discontinuous chips are formed later they segregated into smooth, wavy and segmented chips [4]. Kundan et al. (2014) have done a literature survey on the effect of rake angles and material properties of chip formation in turning of mild steel with HSS tool bits. It has been found that the cutting force decreases with an increase in the rake angles where as it increases when there is an increase in the cutting speed. Whereas the tool chip friction can be increased with an increase in the negative rake angle and cutting speed [5]. Senthil kumar et al. (2014) analyzed the chip morphology in the machining of super duplex stainless steel under gas cooled environmental condition. During analysis of chips it was found that the sharp edges of chips are produced at the optimized conditions and are reduced compared to dry and wet machining conditions. Under gas cooled conditions, the chips are of discontinuous type and also in white silver color [6]. Jin Xie et al.(2012) studied chip topography in dry turning of titanium alloy with traditional plate, orthogonal micro-grooved and diagonal micro-grooved tools. The analysis of experimental results of these tools has shown that the cutting sparks, tool wear, 3D chip size and chip saw-tooth size were low in case of micro-grooved cutting tools when compared to the traditional plate tool. It is also confirmed that the diagonal micro-grooved tools are suitable and stable in dry cutting of titanium alloys. These tools can decrease shear angle by 24.3% compared to orthogonal micro-grooved cutting tools [7]. Kumaragurubaran et al. analyzed the effect of various turning parameters on its performance in machining of EN-9 steel material. The Taguchi DOE technique was applied with an L9 orthogonal array. The results have shown that the metal removal rate is mostly influenced by feed rate [8]. A brief summary on literature study of various optimization techniques and the effect of process parameters is presented in Table 1.
2.
Micro-grooves Machining on the Rake Face Using Sinker EDM
During turning experiments on AISI 1040 steel using plain tungsten carbide cutting tools, it has been identified that the spread over zone crater wear is about 1100 µm & 700 µm under low and high machining conditions as shown in Table 2 [1]. Whereas the chip travel length is increased by 14.5% under medium machining conditions compared to other machining conditions. Further, it is also observed that the average area of crater wear is of about 2.25mm2. Analysis of rake face of plain tungsten carbide cutting tools
3.
Methodology Used & Experimentation with Micro-grooved Cutting Tools
3.1. Methodology Used
The methodology used in this study is presented in Fig. 2. is used to conduct experiments with micro-grooved cutting tools. 32 experiments with OA32(231) orthogonal array are designed using Taguchi design
methodology. Cutting speed, feed and depth of cut are taken as factors at five different levels to design the experimental layout. Besides these factors, interactions between the factors are also considered. As there is no standard Taguchi orthogonal array is designed that best fits the given number of factors and their levels. So, the required array is designed by taking an existing array and reducing it to the required type of model using multi-level column criterion and dummy level techniques. This approach is used to reduce the number of experiments from 231 to 32. Later these 32 experiments are grouped into three categories viz.,
low, medium and high machining conditions as shown in Table 3.
3.2. Experimentation with Micro-grooved Cutting Tools
Out of these 32 experiments, 28 experiments are conducted on AISI 1040 steel using micro-grooved plain tungsten carbide cutting tools. Dry machining is done under all machining conditions and after each test, tool tip temperatures and surface roughness values are measured using a non-contact type thermometer and surface roughness tester (Mitutoyo SJ-201) as shown in Fig. 3. The non-contact type thermometer is calibrated first using a thermocouple setup and the average error is about 0.2%. The tabulated values are presented in Table 4.
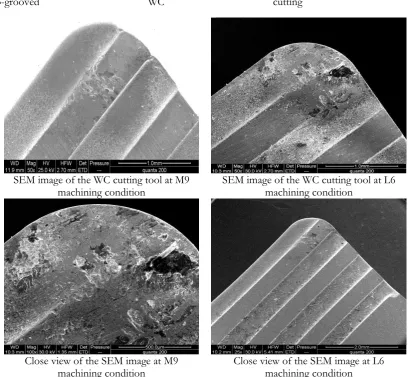
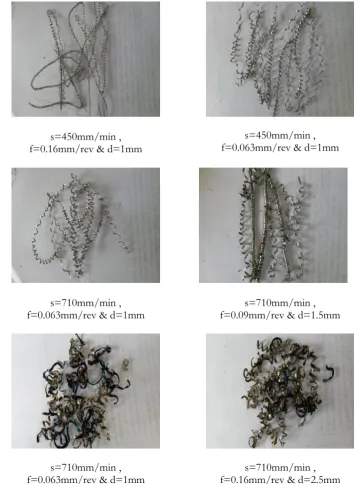
During the experimentation with micro-grooves cutting tools, it is observed that the grooves on the rake face of the tool acts as a chip breaker which also avoids the formation of long chips. In turn, it helps in decreasing the tool wear and an increase in its life. The photographs of the chips formed during the experimentation and SEM images of the WC cutting tool bits are presented in Figs. 4 & 5. The plain micro-grooved Tungsten carbide cutting tools used for conducting the planned 32 experiments are observed under scanning electron microscopy (SEM). The SEM images show that micro-grooves machined on the rake face avoids the formation of excessive tool wear and long continuous chips as the grooves acts as a chip breaker. Few SEM images of L6 and L9 machining conditions are depicted in Figs. 4 & 5, i.e. at cutting speeds 180,280 m/min, feeds 0.045,0.063 mm/rev and depth of cuts 2,0.5 mm, respectively.The chips formed during machining are of continuous type up to some time for some of the machining conditions because of constant stress, strain and temperature gradients. Later these continuous chips are broken into small chips as the micro-grooves on the rake face of the cutting tools acts as chip breakers. However, it is identified that the high speed machining conditions are suitable in terms of getting good surface finish even though the tool wear is comparatively high
.
In general, small, discontinuous chips are formed when machining is done at low cutting speeds. Whenever the speed is increased, there may be a chance of formation of long continuous chips. So, these micro-grooved cutting tools can be preferred in those situations where high speed machining is needed. Figure 5, SEM images show that the micro-grooves machined on the rake face performed two functions; as a chip breaker and the formation of good surface finish even at high cutting speeds.
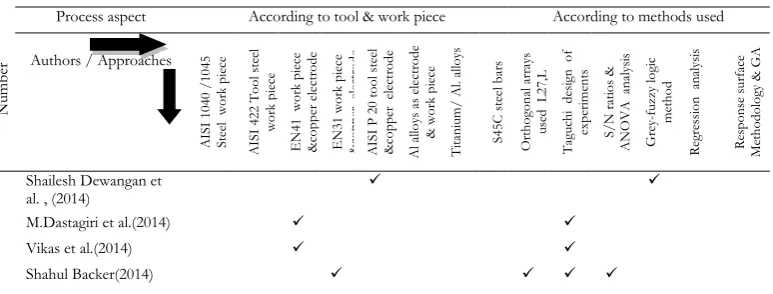
Table 1. Some more literature review.
Ref er enc e Ser ia l N um ber
Process aspect According to tool & work piece According to methods used
Authors / Approaches
A IS I 1040 /1 04 5 Stee l w or k pi ec e A IS I 422 T oo l ste el w or k pi ec e EN 41 w or k pi ec e & co pp er e le ctr ode EN 31 w or k pi ec e & co pp er e le ct ro de A IS I P 20 to ol ste el & co pp er e le ct ro de Al a llo ys as e le ctr ode & w or k pi ec e T ita ni um / Al. a llo ys S4 5C ste el b ar s O rth ogo na l a rr ay s use d L 27 ,L 19 ,L 9, L 18 T agu ch i de si gn of ex pe rim en ts S/N r ati os & A N O V A a na ly si s G re y-fu zz y lo gi c m eth od R egr ess io n an al ysi s R esp on se su rf ac e M eth odo lo gy & GA
[9] Shailesh Dewangan et al. , (2014)
[10] M.Dastagiri et al.(2014)
[11] Vikas et al.(2014)
[image:3.595.114.501.623.770.2][13] SamehS.habib(2009)
[14] C.L.V.R.S.V. Prasad et al.(2010)
[15] P.N.L.Pavani et
al.( 2013 )
[7] Jin Xie et al.(2012)
[16] PNL Pavani et al. ( 2016 )
[17] Grant Mark Robinson et al. ( 2007)
[18] M. Venkata Ramana et
al. (2014)
[19] Elssawi Yahya et al. (2015)
[20] Noordin.M, Venkatesh.
V et al. (2004)
[21] W.H. Yang et al. (1998)
[22] Sahoo, P (2011)
Fig. 1. Experimental setup used for machining of Micro-grooves on the rake face of WC cutting tools.
Table 2. Combination of machining parameters and their levels considered for experimentation.
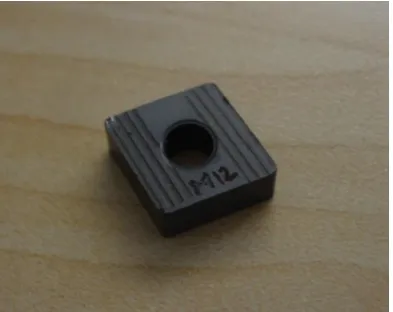
a.Details of the pure copper electrode used for machining Micro-grooves on the rake face of WC
cutting tools
b. Electric discharge machine used for machining of Micro-grooves on the rake face of WC cutting tools
c.Setup of electrode and workpiece used for the
[image:4.595.95.496.74.257.2] [image:4.595.335.532.499.655.2]Levels/
Factors Cutting speed (m/min)
Feed
(mm/rev) Depth of cut (mm) 1 112 0.045 0.5 2 180 0.063 1 3 210 0.09 1.5 4 450 0.125 2 5 710 0.16 2.5
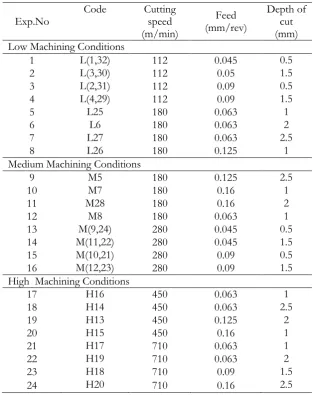
Table 3. Dry machining conditions- low, medium and high used for experimentation.
Exp.No Code Cutting speed (m/min)
Feed (mm/rev)
Depth of cut (mm) Low Machining Conditions
1 L(1,32) 112 0.045 0.5 2 L(3,30) 112 0.05 1.5 3 L(2,31) 112 0.09 0.5 4 L(4,29) 112 0.09 1.5 5 L25 180 0.063 1 6 L6 180 0.063 2 7 L27 180 0.063 2.5 8 L26 180 0.125 1 Medium Machining Conditions
9 M5 180 0.125 2.5 10 M7 180 0.16 1 11 M28 180 0.16 2 12 M8 180 0.063 1 13 M(9,24) 280 0.045 0.5 14 M(11,22) 280 0.045 1.5 15 M(10,21) 280 0.09 0.5 16 M(12,23) 280 0.09 1.5 High Machining Conditions
17 H16 450 0.063 1 18 H14 450 0.063 2.5 19 H13 450 0.125 2 20 H15 450 0.16 1 21 H17 710 0.063 1 22 H19 710 0.063 2 23 H18 710 0.09 1.5 24 H20 710 0.16 2.5
4.
Optimization of Experimental Results Using ANOVA Technique
In this study, Signal to noise ratios are calculated to identify the most influencing parameter among the selected input parameters. Furthermore ANOVA is also carried out for all response variables to know the level of that particular influencing factor (among the input variables cutting speed, feed and depth of cut) which significantly affects the performance characteristics of the micro-grooved cutting tools. For the present analysis, to calculate the S/N ratios for all response variables, a smaller-the-better criterion is used. This characteristic is used because minimum tool tip temperature and surface roughness values are preferable for better performance of the micro-grooved WC cutting tools.
[image:5.595.140.454.227.623.2]Fig. 2. Experimental methodology used for the present study.
n y
N
S 2
log *
10 (1)
[image:6.595.193.419.87.343.2]From the results shown in Table 4, it is identified that the tool tip temperature is mostly influenced by the input variable cutting speed. Furthermore the ANOVA results (Table 5) shows that the cutting speed value at level 1 (i.e. 112 m/min) is a preferable one among all range of values for tool tip temperature. Figure 6 represents the main effect plots for tool tip temperature with respect to the input variables. These plots are helpful to examine differences between level means for one or more factors which may affect the response differently.From the graphs it is identified that minimum tool tip temperature is found at medium cutting speed, low feed and depth of cut conditions.
[image:6.595.315.517.539.689.2]c. Temperature measurement d. Surface roughness tester used
Fig. 3. Experimentation on Lathe machine under low, medium and high machining conditions using micro-grooved WC cutting tools.
Fig. 4. SEM images of the WC cutting tools at various machining conditions. SEM image of the WC cutting tool at M9
machining condition SEM image of the WC cutting tool at L6 machining condition
Close view of the SEM image at M9
[image:7.595.319.518.80.233.2] [image:7.595.92.503.286.663.2]Table 4. Experimental values- tool tip temperatures and surface roughness values for all dry machining conditions.
Exp.
No Cutting speed (m/min)
Feed
(mm/rev) Depth of cut (mm) Tool Tip Temp.
(0C)
Avg. Surface Roughnes
s (µm)
Low Machining Conditions
L(1,32) 112 0.045 0.5 33.5 4.1 L(2,31) 112 0.09 0.5 35.2 4.17 L(3,30) 112 0.05 1.5 33.8 3.35 L(4,29) 112 0.09 1.5 34 3.98 L6 180 0.063 2 35.6 4.33 L25 180 0.063 1 34.6 2.99 L26 180 0.125 1 37.2 4.17 L27 180 0.063 2.5 39 4.48 Medium Machining Conditions
M5 180 0.125 2.5 40.8 9.06 M7 180 0.16 1 35.8 7.52 M8 180 0.063 1 33.2 4 M(9,24) 280 0.045 0.5 32.9 8.23 M(10,21) 280 0.09 0.5 34.4 4.15 M(11,22) 280 0.045 1.5 34.9 3.8 M(12,23) 280 0.09 1.5 34.1 4.52
M28 180 0.16 2 35.8 8.9 High Machining Conditions
H13 450 0.125 2 44.9 7.93 H14 450 0.063 2.5 48.3 5.54 H15 450 0.16 1 40.1 6.84 H16 450 0.063 1 35.6 4.53 H17 710 0.063 1 38 2.08 H18 710 0.09 1.5 38 3.11 H19 710 0.063 2 44.2 1.57 H20 710 0.16 2.5 39.1 1.93
s=112mm/min ,
[image:8.595.104.493.115.683.2]s=112mm/min ,
f=0.05mm/rev & d=1.5mm f=0.09mm/rev & d=1.5mm s=112mm/min ,
s=180mm/min , f=0.063mm/rev & d=2mm
s=180mm/min , f=0.063mm/rev & d=1mm
s=180mm/min , f=0.063mm/rev & d=1mm
s=180mm/min , f=0.063mm/rev & d=2.5mm
s=180mm/min ,
s=180mm/min ,
f=0.063mm/rev & d=1mm f=0.063mm/rev & d=1mm s=180mm/min ,
s=280mm/min ,
f=0.09mm/rev & d=0.5mm f=0.045mm/rev & d=1.5mm s=280mm/min ,
s=280mm/min ,
f=0.09mm/rev & d=1.5mm f=0.16mm/rev & d=2mm s=180mm/min ,
s=450mm/min ,
s=450mm/min , f=0.16mm/rev & d=1mm
s=450mm/min , f=0.063mm/rev & d=1mm
s=710mm/min ,
f=0.063mm/rev & d=1mm f=0.09mm/rev & d=1.5mm s=710mm/min ,
s=710mm/min ,
f=0.063mm/rev & d=1mm f=0.16mm/rev & d=2.5mm s=710mm/min ,
Fig. 5. Photographs of various chips formed at different cutting conditions in the machining of AISI 1040 steel using micro-grooved WC cutting tools.
4.1. S/N Ratios and Analysis of Variance Results for Tool Tip Temperature
Table 5. S/N ratios for tool tip temperatures.
Levels Cutting speed Feed Depth of cut
[image:11.595.125.484.78.563.2] [image:11.595.332.480.79.195.2]Table 6. ANOVA table for tool tip temperatures.
Source DF Adj.SS Adj.MS
F-value value P- % P Rank
Cutting speed 4 214.5 53.615 6.20 0.002 0.395(P) 1 Feed 4 113.9 28.48 2.04 0.129 0.210 3 Depth of cut 4 213.4 53.34 6.12 0.02 0.393 2
Error 0.0002
Total 541.8 1
4.2. S/N Ratios and Analysis of Variance results for Surface Roughness
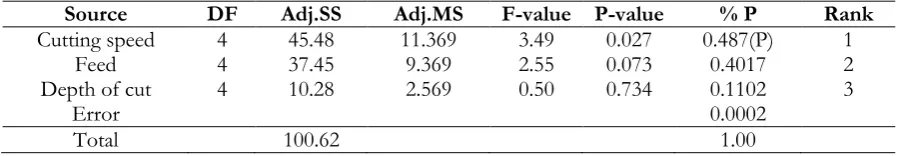
Similarly, signal-to-noise ratio values are calculated for surface roughness and the results are presented in Table 6. It shows that the surface roughness is mostly influenced by the cutting speed and its value is about -6.75916. ANOVA results (Table 7) show that the machining variable cutting speed value at level 5 is a preferable one among all for getting minimum surface roughness in the machining of AISI 1040 steel using micro-grooved cutting tools. Figures 6 & 7 represents the main effect plots for tool tip temperatures & surface roughness with respect to all input parameters. ANOVA is done using Minitab 17 statistical software to observe the significant parameters among all the input variables(Cutting speed, feed and depth of cut) on the output variables(Tool tip temperatures and surface roughness). The ANOVA results shown in Figs. 6-7 shows that the high cutting speed, medium feed and depth of cut conditions are suitable for getting low surface roughness values during machining.
Table 7. S/N ratios for surface roughness.
Levels Cutting speed Feed Depth of cut
1 -11.8213 -13.7506 -14.1087 2 -15.0889 -12.0107 -13.2363 3 -14.2782 -11.3405 -11.4853 4 -15.8618 -16.9679 -15.0908 5 -6.75916 (P) -15.9903 -14.4156 Delta 4.04 5.6274 3.6055
Table 8. ANOVA table for surface roughness.
Source DF Adj.SS Adj.MS F-value P-value % P Rank
Cutting speed 4 45.48 11.369 3.49 0.027 0.487(P) 1 Feed 4 37.45 9.369 2.55 0.073 0.4017 2 Depth of cut 4 10.28 2.569 0.50 0.734 0.1102 3
Error 0.0002
[image:12.595.159.439.404.499.2] [image:12.595.73.525.536.614.2]Fig. 6. Main effect plots for tool tip temperature with respect to all input parameters.
Fig. 7. Main effect plots for surface roughness with respect to all input parameters.
5.
Conclusions
An investigation has been made on the experimental study and optimization of machining parameters in turning of AISI 1040 steel with micro-grooved WC cutting tools. This is done using calculations of signal-to-noise ratios and analysis of variance technique. Some concluding remarks of the present study are given below.
The electric discharge machine can be used as an alternative to micro-grinding process to cut grooves on the rake face of Tungsten carbide cutting tools. A series of micro-grooves along the cutting edge (i.e. 200-500 µm from the side and end cutting edges and 1400 µm from nose) are machined on the tool rake surface.
A Taguchi orthogonal array is used to set the possible combinations of all input parameters. Later these combinations are categorized into three groups (low, medium and high machining conditions).
Taguchi design of experiments has given satisfactory results by reducing the number of experiments with the L32 orthogonal array. It is also helpful in reducing the total number of experiments from 32 to 24.
Dry turning tests of AISI 1040 steel under each group enables to assess the performance of micro-grooved WC cutting tools. The micro-micro-grooved WC tool has strong chip breakable capacity, tool wear, chip size and cutting sparks.
From the one way ANOVA & Signal-to-noise ratio results it has identified that the cutting speed is the most influencing parameter at the following levels.
[image:13.595.69.499.79.247.2] [image:13.595.71.496.281.444.2] Surface roughness at level 5(i.e.720 m/min).
The present work can be extended to characterization of the tool wear (i.e. Crater wear and edge chipping) and the most influencing parameters can also be identified.
Acknowledgement
Authors are thankful to the Department of Science and Technology, Government of India for the financial support that made this research possible. The authors also acknowledge GMR Institute of Technology, Rajam, India for providing technical facilities and assistance.
References
[1] G. Amitabh and M. A. Kumar, Manufacturing Science. New Delhi: East West Press, 1985.
[2] V. P. Astakov, S. V. Shvets, and M. O. M. Osman, “Chip structure classification based on mechanics of its formation,” Journal of Materials Process Technology, vol. 71, pp. 247-257, 1997.
[3] M. Neslušan, M. Šípek, and J. Mrázik, “Analysis of chip formation during hard turning through acoustic emission,” Materials Engineering—Materiálové inžinierstvo, vol. 19, no. 1, pp. 1-11, 2011.
[4] G. Sutter, L. Faure, A. Molinari, A. Delime, and D. Dudzinski, “Experimental analysis of the cutting process and chip formation at high speed machining,” Journal de Physique IV Colloque, vol. 07, no. C3, pp. 33-38, 1997.
[5] K. K. Singh, M. joshi, A. Bahuguna, and R. Pant, “Effect of rake angles and material properties on chip formation: A review,” International Journal of Engineering Science and Innovative Technology (IJESIT), vol. 3, no. 6, pp. 526-530, 2014.
[6] K. S. Kumar and J. S. Senthilkumaar, “Analysis of flank wear and chip morphology when machining super duplex stainless steel in a gas cooled environment,” International Journal of Engineering and Technology (IJET), vol. 5, no. 6, pp. 5045-5056, 2014.
[7] J. Xie, M.-J. Luo, J.-L. He, X.-R. Liu, and T.-W. Tan, “Micro-grinding of micro-groove array on tool rake surface for dry cutting of titanium alloy,” International Journal of Precision Engineering and Manufacturing, vol. 13, no. 10, pp. 1845-1852, 2012.
[8] B Kumaragurubaran, P Gopal, T Senthil Kumar, M Prasanna Mugunthan, and N H Mohamed Ibrahim, “Optimization of turning parameters of EN-9 steel using design of experiments”, International Journal of Mechanical Engineering Research and Robotics, vol. 2, no. 3, pp.182-190, 2013.
[9] S. Dewangan, S. Gangopadhyay, C. K. Biswas, “Multi-response optimization of surface integrity characteristics of EDM process using grey-fuzzy logic-based hybrid approach,” Engineering Science and Technology, An International Journal, vol. 18, no. 3, pp. 361–368, 2015.
[10] M. Dastagiri and A. Hemantha Kumar, “Experimental investigation of EDM parameters on stainless steel & En41b,” Procedia Engineering, vol. 97, pp. 1551-1564, 2014.
[11] Vikasa, Shashikant, A. K. Roy, and K. Kumar “Effect and optimization of machine process parameters on MRR for EN19 & EN41 materials using Taguchi,” Procedia Technology, vol. 14, pp. 204-210, 2014.
[12] S. Backer, C. Mathew, and S. K. George, “Optimization of MRR and TWR on EDM by using Taguchi’s method and ANOVA,” International Journal of Innovative Research in Advanced Engineering (IJIRAE), vol. 1, no. 8, pp. 106-112,
[13] S. S. Habib, “Study of the parameters in electrical discharge machining through response surface methodology approach,” Applied Mathematical Modelling, vol. 33, no. 12, pp. 4397–4407, 2009.
[14] C. L. V. R. S. V. Prasad, S. V. Ramana, S. Srikiran, and K. Ramji, “Experimental investigations for characterization and analysis of rake face of the WC-Co inserts using Taguchi method,” in Proc. ASME 2010 International Mechanical Engineering Congress and Exposition, Vol. 3: Design and Manufacturing, Parts A and B, Vancouver, British Columbia, Canada, November 12–18, 2010, pp. 1055-1063.
[15] P. N. L. Pavani, C. L. V. R. S. V. Prasad, S. V. Ramana, and K. Ramji, “The influence of array of alternative nanocoatings on the characterization of wear zones on the rake face of tungsten carbide cutting tools,” presented at International Conference on PRECISION, MESO, MICRO, AND NANO ENGINEERING (COPEN-8).
Proceedings of the Institution of Mechanical Engineers, Part B: Journal of Engineering Manufacture, January 27, 2016, p.0954405415624632. doi:10.1177/0954405415624632.
[17] G. M. Robinson, M. J. Jackson, and M. D. Whitfield, “A review of machining theory and tool wear with a view to developing micro and nano machining processes,” Journal of Materials Science, vol. 42, no. 6, pp. 2002-2015, 2007.
[18] M. Venkata Ramana, G. Krishna Mohan Rao, and D. Hanumantha Rao, “Optimization and effect of process parameters on tool wear in turning of titanium alloy under different machining conditions,”
International Journal of Materials, Mechanics and Manufacturing, vol. 2, no. 4, pp. 272-277, 2014.
[19] E. Yahya, G. F. Ding, and S. F. Qin, “Optimization of machining parameters based on surface roughness prediction for AA6061 using response surface method,” American Journal of Science and Technology, vol. 2, no. 5, pp. 220-231, 2015.
[20] M. Y. Noordin, V. C. Venkatesh, S. Sharif, S. Elting, and A. Abdullah, “Application of response surface methodology in describing the performance of coated carbide tools when turning AISI 1045 steel,” Journal of Materials Processing Technology, vol. 145, no. 1, pp. 46–58, 2014.
[21] W. H. Yang and Y. S. Tarng, “Design optimization of cutting parameters for turning operations based on the Taguchi method,” Journal of Materials Processing Technology, vol. 84, no. 1–3, pp. 122–129, 1998. [22] P. Sahoo, “Optimization of turning parameters for Surface roughness using RSM and GA,” Advances
in Production Engineering & Management, vol. 6, no. 3, pp. 197-208, 2011.