Article
Parallel-Axis Gear Design Methodology for
Minimization of Power Loss and Its Effect on
Vibration Characteristics
Kullapat Theerarangsarit
aand Chanat Ratanasumawong
b,*Department of Mechanical Engineering, Faculty of Engineering, Chulalongkorn University, Phayathai Road, Patumwan, Bangkok 10330, Thailand
E-mail: a[email protected], b[email protected] (Corresponding author)
Abstract. Gear tooth strength is mainly considered in gear design to ensure the ability to
transmit power. With the design process, various sets of gear parameters are probably selected to meet the tooth strength. However the efficiencies of various designed gears are different. Improper gear parameter selection probably makes the gear power loss increase significantly. In this paper, the design methodology to minimize gear power loss is presented. A spur gear selected from a catalogue is used as the reference gear. Then several gears with various parameters but having the ability to transmit the same load are designed. The power losses of the designed and the reference gears are estimated by the sliding loss model, hence the minimum power loss gear is able to choose from the various designed gear sets. Both analytical and experimental results show that to minimize gear power loss along with keeping loading capacity, pressure angle should be increased and module should be reduced. The effect of this design methodology on vibration characteristics is also investigated by measuring the vibration attributed to the sample gear sets. It is found that the helical gear having large pressure angle, wide face width and having helix angle about 10 to 20 is favorable, since it has more capability to transmit load, lower power loss and also lower vibration than the reference spur gear.
Keywords: Gear design, load capacity, power loss, vibration.
ENGINEERING JOURNAL Volume 21 Issue 7
1.
Introduction
The method to design gear has been well established and widely published in many gear handbooks and machine design handbooks [1-4]. The most popular and widely used gear design method was suggested by American Gear Manufacturer Association (AGMA). In this method gear tooth strength is mainly focused to ensure the ability to transmit power at a specific operating condition and lifetime reliability. With this consideration, various sets of gear parameter are probably selected to meet the tooth strength. However the power losses of these various gear sets are different. Improper gear parameter selection probably makes the power loss of the designed gear increase significantly.
With the important of the energy problem, the high efficiency gear is highly required. There are many researches studied about the gear power loss and the method to increase the efficiency of the gear box [5-14]. The former researches by authors’ group [15-17] show the effect of gear geometrical parameters on the sliding loss of a spur and a helical gear pair. The sliding loss can be reduced by increasing the pressure angle, face width and reducing module.
Michaelis
et al. [18] studied the method to increase the efficiency of a gearbox. He suggested using the helical gear with smaller module, larger pressure angle and wider face width instead of the standard C-type spur gear to reduce the load gear losses. Although his result shows the possibility to increase the efficiency by changing the gear parameters, the method to select gear parameters did not clearly present in this study. Therefore it is still difficult to apply the results to the other cases.From the former studies described above, gear geometrical parameters relate closely with the gear power loss, hence in the gear design process it is possible to choose the proper parameters to obtain the low power loss gear along with keeping its loading capacity. In this study, the design methodology to minimize gear power loss is presented. The several gear sets having nearly the same load capacities are designed based on the AGMA suggestion. The power loss of the designed gear pairs are estimated with the gear sliding loss model proposed in the ref. [17], hence the minimum power loss gear is able to choose among the various designed gear sets. Because gear vibration is also probably affected with this design methodology, the study of the vibration characteristics of the gear pairs is also done in this study.
2.
Gear Strength Calculation
In this study the gear design method suggested by AGMA is selected to use. Two stress equations that must be considered in this method are bending stress equation and contact stress equation. These AGMA equations can be written in the form of allowable bending load ( ) and allowable contact load ( ) as shown by equations
(1)
and
. (2)
In these equations, and are allowable bending stress and allowable contact stress. is face width. is module. For a helical gear design, transverse module will be used instead of module . , , , and are overload factor, dynamic factor, size factor, load-distribution factor, rim-thickness factor, respectively. is geometry factor for bending strength. , and are temperature factor, reliability factor and stress cycle factor for bending stress. is elastic coefficient. is pitch diameter of the pinion.
and are geometry factor for pitting resistance and surface condition factor, respectively.
Parameters in the Eqs.(1) and (2) can be categorized into the gear tooth geometrical dependent parameters and gear tooth geometrical independent parameters as shown in Table 1. Since the objective of this study is to design the low power loss gear to replace the reference spur gear, operating conditions, gear configuration, gear material and surface condition of the low power loss gear and the reference gear are
t
W
W
t,cZ N B H J s v O t
Y
Y
Y
K
K
Y
K
K
K
bm
W
R I s v O l Z N E c c t Z Z K K K bd Y Y Y Z
W
2 ,
cb
mt
m
mK
OK
vK
sH
K KB
J
Y
Y
θ YZY
NE
Z
d
lI
considered to be the same. With this reason only the gear tooth geometrical dependent parameters are considered in the design process. For the rim-thickness factor , although it is also geometrical dependent, it depends on the size of rim thickness. Designers can design gears to have enough rim-thickness so that the shape of gear teeth do not affect to this factor, hence it can be categorized into the gear tooth geometrical independent parameter. The effects of face width module or transverse module on the load capacity are directly known from Eqs.(1) and (2), whereas the effect of pressure angle and helix angle are known from parameters and . The value of depends on the size of module. In the case of small gear teeth that module is less than 5 mm the value of is equal to 1. The effects of increasing gear geometrical parameters on the load capacity are summarized as shown in Table 2. This information is used for parameter selection in the design process described further.
Table 1. Gear tooth geometrical dependent parameters and independent parameters.
Parameters Bending stress equation Contact stress equation
Geometrical dependent
Geometrical independent
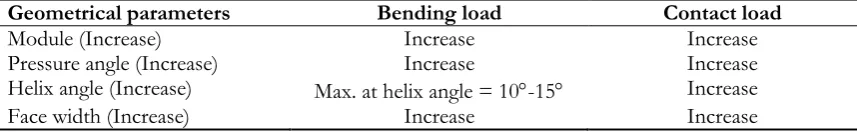
Table 2. The effects of gear geometrical parameters on the load capacity.
Geometrical parameters Bending load Contact load
Module (Increase) Increase Increase Pressure angle (Increase) Increase Increase Helix angle (Increase) Max. at helix angle = 10-15 Increase Face width (Increase) Increase Increase
3.
Power Loss in Gear Transmission
Power loss in gear transmission can be categorized into sliding loss, rolling loss, churning loss and windage loss. From many former studies it has known that the rolling loss is much less than the sliding loss [8], and the windage loss is very low in the case of small gear operated at low or moderate speed [1] such as the gears used in automobiles, agricultural machines or many industrial machines. Moreover the churning loss depends not only on the gear geometrical parameters and operating conditions, but also the configuration of the gear box and lubricating method [19] that are out of scope of this study. Therefore only the sliding loss that is the dominant loss in the gear transmission is considered here.
The method to estimate the sliding loss used here is the same as the method presented in the ref. [17]. From the former researches [15-17], the effects of increasing gear geometrical parameters on the sliding loss are known and can be summarized in Table 3. The sliding loss is increased when the module is increased. On the other hand, increasing gear pressure angle and face width will reduce the sliding loss. Increasing the helix angle is possible both to increasing or reducing the sliding loss depending on the value of the helix angle and also other parameters. Hence the effect of helix angle is written as “indefinite” in Table 3.
Table 3. The effects of gear geometrical parameters on the gear sliding loss.
Geometrical parameters Sliding loss
Module (Increase) Increase Pressure angle (Increase) Decrease Helix angle (Increase) Indefinite Face width (Increase) Decrease
B K
b
mm
tJ
Y
ZIK
ss
K
s J
t
Y
K
m
m
b
,
,
,
,
b
,
d
ωl,
Z
I,
K
sN Z θ
B H v O
Y
Y
Y
K
K
K
K
,
,
,
,
,
,
R E
N Z θ v O
Z
Z
Y
Y
Y
K
K
,
[image:3.595.81.519.262.336.2] [image:3.595.84.513.375.441.2] [image:3.595.158.433.677.741.2]4.
Gear Design Methodology
From the effects of geometrical parameters on the load capacity and the gear sliding loss in Tables 2 and 3, increasing pressure angle and face width bring the positive results both in view of gear strength and gear power loss. Hence these parameters should be set to be as large as possible. For the module, since the reduction of this parameter decreases sliding loss significantly, the module should also be selected to be as small as possible. The amount of load capacity that will be reduced when the module is reduced can be compensated by increasing pressure angle, face width and also helix angle.
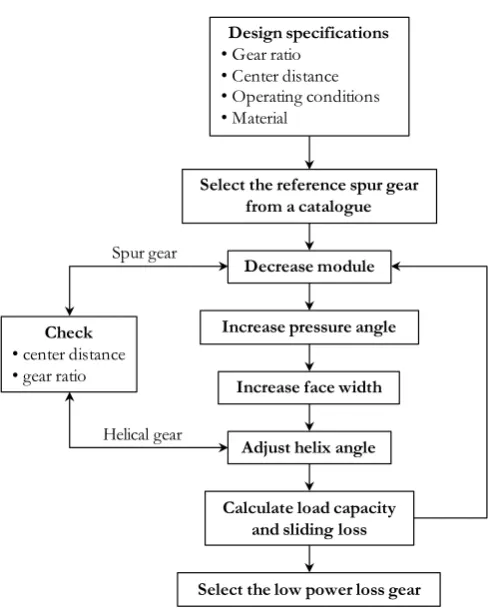
The procedure of gear design in this study is shown in Fig. 1. First gear specifications that are load, operating speed, center distance, gear ratio and gear material are defined. With these specifications the reference spur gear can be selected from a gear catalogue. To design the low power loss gear to replace the reference gear, the center distance and the gear ratio of the designed gear are fixed to be the same as those of the reference gear, but the other gear parameters are changed as described in the following steps.
1. Decrease module: Since the number of teeth is increased when the module is decreased, and due to the restriction of the value of standard module and the number of gear teeth that must be integer, the desired center distance and the gear ratio possibly cannot achieve together. With this reason, the center distance of the gear pair must be carefully checked to ensure that the designed gear is probable to replace the reference gear, and the gear ratio is also in the acceptable range. For the helical gear, if the transverse module system is used the center distance can be checked in this step, but if the normal module system is used, the value of helix angle must be considered in the calculation of the center distance.
2. Increase pressure angle: The standard gear pressure angles are 14.5, 20 and 25. Here the pressure angle is set to be 20 or 25 to obtain high load capacity along with low power loss.
3. Increase face width: Although increasing the face width gives positive results both in view of gear strength and gear power loss, increasing of the face width still has the upper limit. Many design textbooks suggest that the face width should be around 8 to 16 times of the module [2]. The excessive face width probably leads to the force distribution and tooth bending problem. In this study the face widths are set at 12-15 times of the module depended on the value of module. These face widths are equal or wider than the face width of the reference gear.
4. Adjust helix angle: Since the proper amount of helix angle cannot be known directly, the calculation here is done by varying the amount of helix angle from 0 to 30. The optimum helix angle can be chosen further by considering the load capacity along with the estimated sliding loss.
After adjusting the geometrical parameters, gear tooth strength is calculated by the AGMA method. This result is compared to the load capacity of the reference gear. If the tooth strength of the designed gear is lower than that of the reference gear, the parameters will be changed to obtain higher load capacity. On the other hand if the load capacity of the designed gear is much more than that of the reference gear, it is possible to reduce gear module to decrease the sliding loss. The amount of the sliding loss of the designed gear is estimated by the gear sliding loss model [17]. With this procedure, the minimum power loss gear can be chosen from the various designed gear sets.
5.
Example of Gear Design
5.1. The Reference Gear and the Designed Gears
Fig. 1. Procedure of gear design for minimization of power loss.
Table 4. Specifications of the designed gear.
Specifications Values
Center distance 90 mm
Gear ratio 5:7
Speed 2500 rpm
Transmitted torque (at pinion) 90-100 Nm Working temperature 70C Life-cycles 2106 cycles
Material S45C
Table 5. Parameters of the reference gear pair.
Parameters Pinion
SSG3-25J30 SSG3-35J30 Gear
Gear ratio 5:7
Number of teeth 25 35
Module [mm] 3 3
Pressure angle [Deg.] 20 20
Helix angle [Deg.] 0 0
Face width [mm] 30 30
Center distance [mm] 90
Load capacity for bending strength (catalogue) [Nm] 178 258 Load capacity for bending strength (calculation) [Nm] 229.96 339.83 Load capacity for surface durability (catalogue) [Nm] 94.5 177 Load capacity for surface durability (calculation) [Nm] 107.22 201.15
Design specifications
•Gear ratio
•Center distance
•Operating conditions
•Material
Select the reference spur gear from a catalogue
Decrease module
Increase pressure angle
Increase face width
Adjust helix angle
Calculate load capacity and sliding loss
Select the low power loss gear Check
•center distance
•gear ratio
Spur gear
[image:5.595.176.422.84.392.2] [image:5.595.165.436.457.562.2] [image:5.595.76.521.597.762.2]Table 6. Factors used in load capacity calculations.
Parameters Values Parameters Values
Allowable bending stress [MPa] 248.2 Temperature factor 1.00 Allowable contact stress [Mpa] 866 Reliability factor 1.00
Overload factor 1.00 Stress cycle factor for bending 1.08 Dynamic factor 1.21 Elastic coefficient [ ] 191 106
Load-distribution factor 1.17 Surface condition factor 1.00 Rim-thickness factor 1.00
To design the low power loss gear, the module is tried reducing from 3 mm to 2.5 and 2 mm. However for this example, using module less than 2.5 mm causes the gear ratio and the center distance become too much deviate from the design specification. With this reason, only the module 2.5 mm is used in this example. The pressure angle in this design is set to be 20 and also increased to be 25. Face width is set at 30 and 35 mm that equals to 12 times and 14 times of the module. The values of helix angle are varied from 0 (spur gear) to 30.
5.2. Load Capacity and Power Loss Estimation
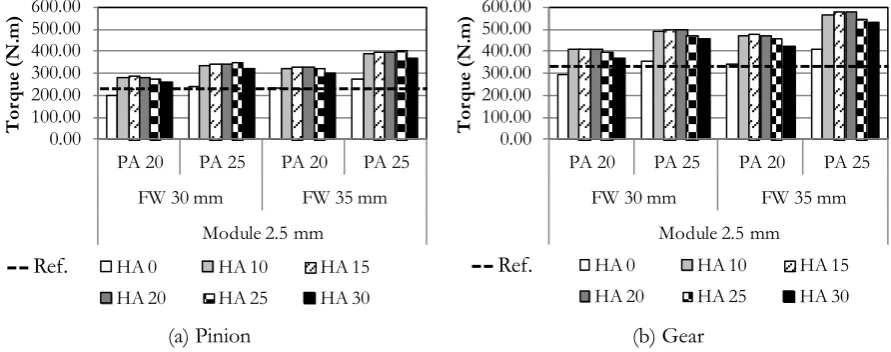
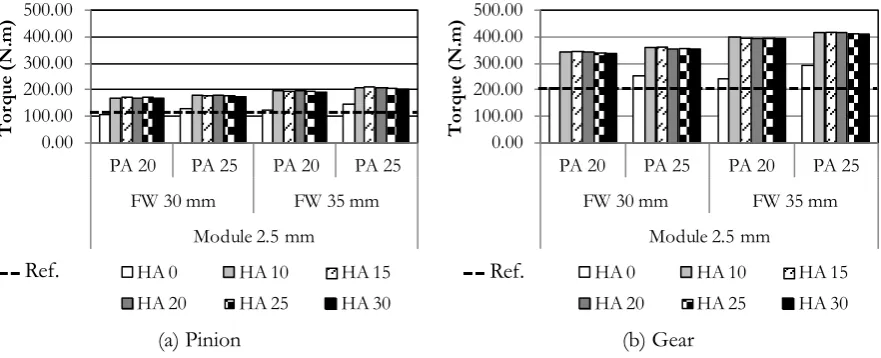
The capacities of gears designed by this method are calculated and shown in Fig. 2 for the bending stresses and in Fig. 3 for the contact stresses. Figures 2(a) and 3(a) show the results in the case of the pinions, on the other hand Figs. 3(b) and 4(b) show the load capacity of the gears. In these figures the allowable torques of the reference gear calculated by the same method are shown by the thick dash lines. Most of the designed gears have higher load capacities than the reference gear except the spur gear having module 2.5 mm pressure angle 20, and face width 30 mm that its module is less than the reference gear but the other parameters are the same as the reference. It is obvious that the load capacities of the helical gears are much more than the spur gear. The gears having helix angle about 10-20 have the highest load capacities in most cases. The load capacities are reduces when the helix angle is larger than 20 or 25. By comparing the load capacity of the reference gear and that of the spur gear having the same parameters except the module that is reduced to 2.5 mm, it is found that reduction of the module affects significantly to the allowable torque calculated from bending stress equation, but affects only a little to the allowable torque calculated from the contact stress equation. Increasing of pressure angle and face width increase allowable torques for both bending stresses and contact stresses evidently.
(a) Pinion (b) Gear
Fig. 2. Allowable torques for bending stresses.
Y
θc
YZO
K
Y
Nv
K
MPa
ZEH
K ZR
B K
0.00 100.00 200.00 300.00 400.00 500.00 600.00
PA 20 PA 25 PA 20 PA 25
FW 30 mm FW 35 mm
Module 2.5 mm
T
or
qu
e
(N.
m)
HA 0 HA 10 HA 15
HA 20 HA 25 HA 30
Ref.
0.00 100.00 200.00 300.00 400.00 500.00 600.00
PA 20 PA 25 PA 20 PA 25
FW 30 mm FW 35 mm
Module 2.5 mm
T
or
qu
e
(N.
m)
HA 0 HA 10 HA 15
HA 20 HA 25 HA 30
[image:6.595.78.524.566.742.2](a) Pinion (b) Gear
Fig. 3. Allowable torques for contact stresses.
The estimated sliding losses of the designed gears are shown in Fig. 4. The operating conditions used in the calculations are applied torque 100 Nm and rotational speed 2500 rpm. Both values are considered at the pinion side. From the results, all designed gears have sliding loss lower than the reference gear. Reduction of the module and increasing the pressure angle reduce the power loss considerably, whereas widening the face width does not much affect to the power loss.
The helical gears having module 2.5 mm, pressure angle 25, helix angle 15 and face width 30 mm is the lowest power loss gear among all gears having larger load capacity than the reference gear. This gear has the power loss less than the reference gear approximately 33%. The runner-up in terms of power loss is the spur gear having module 2.5 mm, pressure angle 25 and face width 30 mm that has the power loss less than the reference approximately 27%. The helical gears having the pressure angle 25 and the face width 35 mm are also recommended to use since their high load capacities and low power losses. It can be concluded from these results that the proper gear parameter selection in the design state will give the high load capacity gear and can reduce the sliding loss more than 25%.
Fig. 4. Sliding losses of the designed gears.
0.00 100.00 200.00 300.00 400.00 500.00
PA 20 PA 25 PA 20 PA 25
FW 30 mm FW 35 mm
Module 2.5 mm
T
or
qu
e
(N.
m)
HA 0 HA 10 HA 15
HA 20 HA 25 HA 30
Ref.
0.00 100.00 200.00 300.00 400.00 500.00
PA 20 PA 25 PA 20 PA 25
FW 30 mm FW 35 mm
Module 2.5 mm
T
or
qu
e
(N.
m)
HA 0 HA 10 HA 15
HA 20 HA 25 HA 30
Ref.
0.00 50.00 100.00 150.00 200.00 250.00
PA 20 PA 25 PA 20 PA 25
FW 30 mm FW 35 mm
Module 2.5 mm
Sl
id
in
g
lo
ss
(
W
)
HA 0 HA 10 HA 15
HA 20 HA 25 HA 30
[image:7.595.83.524.96.275.2] [image:7.595.190.412.494.664.2]6.
Experimental Verification
6.1. Apparatus and Tested Gears
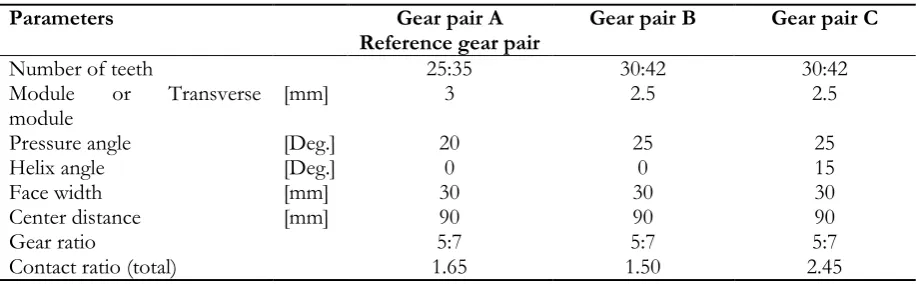
To verify this design methodology, the reference gear pair and two gear pairs designed in the last session were chosen to test. The parameters of the tested gear pairs are shown in Table 7. The gear pair A is the reference gear pair. The gear pair C and B are the gear pairs that have the lowest sliding loss and the runner-up in the estimated results in Fig. 4 respectively. The accuracy of the tested gears is JIS B 1702 Grade 4. These gears have the surface hardness after heat treatment more than 58 HRC.
The experiments were done by the back-to-back gear test rig as shown in Fig. 5 as same as the experiments done in the ref. [16]. This apparatus has two identical gear boxes with the identical gear pair inside. These gear pairs are driven by a motor via a belt. Since this type of the test rig does not have the output power, the power is input to compensate various kinds of power loss in the system. Hence the power loss can be measured indirectly by measuring the power input. In this apparatus the power input can be calculated from torque measured by a torque transducer and rotational speed of the shaft measured by a tachometer. Load can be applied to the gear teeth by twisting the shaft at the loading coupling. This applied load can be measured by 4 strain gauges attached at the shaft surface. The details of the apparatus and the experimental method to obtain gear sliding loss from the measured power loss are written in the ref. [16]. For the experimental conditions, the measurements were done at applied torque at the pinion shaft 0-90 Nm and the rotational speed of pinion shaft 500-2500 rpm.
6.2. Experimental Results
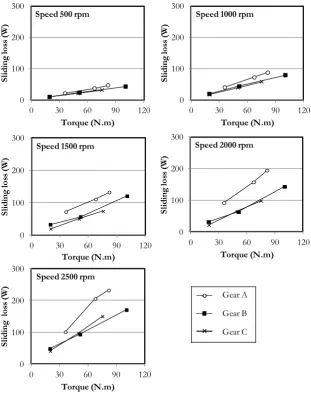
The sliding losses of the tested gear pairs are shown in Fig. 6. The sliding losses in this figure are sliding losses of one gear pair calculated from the total power losses. The horizontal axes are torques measured at the pinion shaft. It should be noted that applied torques in the different cases are different due to the variation in gear backlashes, the restriction in gear assembly and also the capability of loading coupling that cannot precisely adjust to apply exactly the same torque as the required value.
From the results, it is obvious that the sliding losses of both designed gear pairs are significantly lower than the reference gear pair A as expected. The spur gear pair B and the helical gear pair C have almost the same level of sliding losses. The helical gear pair C has slightly lower sliding loss than the spur gear pair B in most cases, but has slightly higher sliding loss at the speed 2500 rpm. At the applied torque approximately 75-82 Nm and pinion shaft speed 2500 rpm that is the condition close to the design condition, the sliding loss of the gear pair C is less than the reference gear pair A about 32% that is agree well with the estimated result.
Table 7. Parameters of tested gears.
Parameters Gear pair A
Reference gear pair Gear pair B Gear pair C
Number of teeth 25:35 30:42 30:42 Module or Transverse
module [mm] 3 2.5 2.5
Pressure angle [Deg.] 20 25 25
Helix angle [Deg.] 0 0 15
Face width [mm] 30 30 30
Center distance [mm] 90 90 90
Gear ratio 5:7 5:7 5:7
[image:8.595.69.529.549.691.2](a)
(b) (c)
Fig. 5. Back-to-back gear test rig [16] and the positions of vibration measurement on the gearbox surface.
7.
Vibration Investigation
Since the design methodology presented here is focused on the load capacities and power losses of gears, it is also important to investigate the effect of this design methodology on the other aspects. In this study the vibration characteristics of the designed gear are selected to investigate.
7.1. Investigation Method
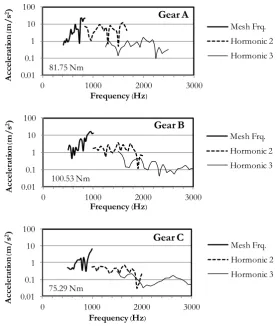
The sources of gear vibration can be categorized roughly into 3 sources [21], and the vibration attributed from the different sources occurs at different frequencies. The first source of gear vibration comes from the variation of meshing stiffness and common tooth surface form. The vibration attributed to this source is found at the meshing frequency and its harmonics. The second source is the fluctuating deviation from common errors such as pitch error or misalignment of gear body on the shaft. This source brings about the vibration at low orders of shaft rotations and also the sidebands surrounding the meshing frequency and harmonics. The last source of gear vibration is the tooth surface undulation. The vibration from this source occurs at various harmonics of shaft frequency. Since the investigation here is scoped only the effect of design parameters that are common on all gear teeth, the source of vibration excitation comes from the first source, hence only meshing frequency and its harmonics are extracted and considered here.
[image:9.595.73.517.76.479.2]Fig. 5(a) at the position 1, 2 and 3 as shown in Fig. 5(c) for measuring the vertical, transverse and axial vibration, respectively. The acceleration signal was measured at one direction first, when the measurement was finished then the further directions were measured. The measurements were done at applied torque at the pinion side about 75 - 100 Nm and the pinion shaft rotational speed 800-2000 rpm.
Fig. 6. Sliding losses of the tested gear pairs.
7.2. Vibration Measuring Results
Figure 8 shows the accelerations of meshing frequency components of the tested gear in vertical direction. The amplitudes of vibration of the reference gear pair A are higher than the gear pair B and C respectively. The same trend is also found in the results in horizontal and axial direction. For the helical gear, since the contact ratio and the average tooth meshing stiffness are much larger than the spur gear, the variation of meshing stiffness is much smaller, and hence the vibration level of the helical gear pair C is much less than the spur gear pairs A and B. Comparing the spur gear pair A and B, since the gear pair B has smaller module than the reference gear pair A, the variation in meshing stiffness is also smaller than that of the gear pair A. With this reason the vibration level of the gear pair B is lower than the gear pair A.
Considering the frequency of vibration components, because the gear pair B and C have number of teeth more than the reference gear pair A, the meshing frequency components occur at higher frequencies than the meshing components from the reference gear A. At the same amplitude of vibration, generally the gear vibration occurring at higher frequency will lead to more serious problem than the vibration occurring at the
0 100 200 300
0 30 60 90 120
Sl id in g lo ss (W ) Torque (N.m) Speed 500 rpm
0 100 200 300
0 30 60 90 120
Sl id in g lo ss (W ) Torque (N.m) Speed 1000 rpm
0 100 200 300
0 30 60 90 120
Sl id in g lo ss (W ) Torque (N.m) Speed 1500 rpm
0 100 200 300
0 30 60 90 120
Sl id in g lo ss (W ) Torque (N.m) Speed 2000 rpm
0 100 200 300
0 30 60 90 120
Sl id in g lo ss (W ) Torque (N.m) Speed 2500 rpm
[image:10.595.143.455.147.545.2]lower frequency, therefore to decrease the gear power loss by reducing module or increasing the number of teeth, the effect of frequency of vibration should be considered together. However for this design example, the module is not reduced so much, hence the frequencies of mesh components of the gear pair B and C are slightly higher than the reference gear pair A. This can be considered not to affect vibration much.
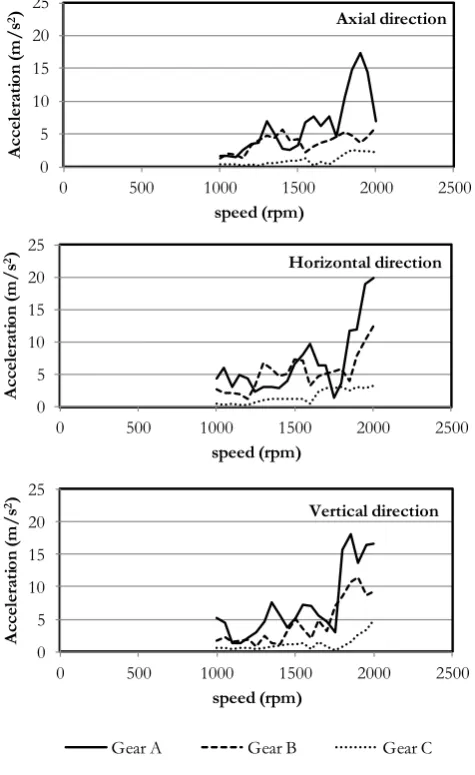
[image:11.595.161.439.205.532.2]The overall vibration can also be represented by the RMS values of meshing components as shown in Fig. 9. It is obvious from these results that the RMS vibrations in all directions of the helical gear pair C is lower than the vibrations of the gear pair B and the reference gear pair A respectively. These results clearly verify the merits of the proper gear parameter selection. Not only the higher load capacity and lower power loss are probably acquired but lower vibration amplitude is also achieved from this design methodology.
Fig. 8. Meshing frequency components of the tested gear pairs (vertical direction).
0.01 0.1 1 10 100
0 1000 2000 3000
A
cc
el
er
at
io
n
m
/s
2)
Frequency Hz
Gear A
Mesh Frq. Hormonic 2 Hormonic 3 81.75 Nm
0.01 0.1 1 10 100
0 1000 2000 3000
A
cce
ler
at
io
n
m
/s
2)
Frequency Hz
Gear B
Mesh Frq. Hormonic 2 Hormonic 3 100.53 Nm
0.01 0.1 1 10 100
0 1000 2000 3000
A
cce
ler
at
io
n
m
/s
2)
Frequency Hz
Gear C
Fig. 9. Vibrations (RMS) of the tested gear pairs.
8.
Conclusions
The design methodology for minimization of power loss along with keeping the load capacity of gears is presented in this study. The results reveal that it is possible to achieve the high load capacity, low power loss and also low vibration gear by proper gear parameter selection in the design stage. In this design methodology, the small module, large pressure angle, and wide face width are suggested. The helical gear is also desired due to its high load capacity, low sliding loss and low vibration.
Acknowledgements
This work is supported by the department of mechanical engineering, Chulalongkorn University. Authors would like to thanks Univance corporation for supporting the tested gears.
0 5 10 15 20 25
0 500 1000 1500 2000 2500
A
cce
ler
at
io
n
(m
/s
2)
speed (rpm)
Axial direction
0 5 10 15 20 25
0 500 1000 1500 2000 2500
A
cc
el
er
at
io
n
(m
/s
2)
speed (rpm)
Horizontal direction
0 5 10 15 20 25
0 500 1000 1500 2000 2500
A
cc
el
er
at
io
n
(m
/s
2)
speed (rpm)
Vertical direction
[image:12.595.183.421.90.478.2]References
[1] D. P. Townsend, “Gear tooth calculations and loaded gears in action,” in Dudley’s gear handbook, 2nd ed. USA: McGraw-Hill, 1992, ch. 6, 12, pp. 6.15-6.22, 12.24-12.28.
[2] R. L. Mott, “Design of a mechanical drive,” in Machine Elements in Mechanical Design, 3rd ed. New Jersey: Prentice-Hall, 2001, ch. 8-10, pp. 256-405.
[3] R. G. Budynas and J. K. Nisbett, “Design of mechanical elements,” in Shigley’s Mechanical Engineering
Design, 9th ed. New York: McGraw-Hill, 2011, ch. 13-14, pp. 673-784.
[4] R. C. Juvinall and K. M. Marshek, “Applications,” in Machine Component Design, 5th ed. Singapore: John Wiley & Sons, 2012, ch. 15-16, pp. 620-684.
[5] N. E. Anderson and S. H. Lowenthal, “Effect of geometry and operating conditions on spur gear system power loss,” J. Mech. Des. – T ASME, vol. 103, pp. 151-159, Jan. 1981.
[6] Y. Terauchi, K. Nagamura, and K. Ikejo, “Study on friction loss of internal gear drives (influence of pinion surface finishing, gear speed and torque),” JSME Int. J. III, vol. 34, no. 1, pp. 106-113, 1991. [7] S. Haizuka, T. Kikusaki, and C. Naruse, “Studies on friction loss of spur gears (effect of viscosity of
lubricating oils and tooth forms),” JSME Int. J. C, vol. 42, no. 4, pp. 1041-1049, 1999.
[8] Y. Michlin and V. Myunster, “Determination of power loss in gear transmission with rolling and sliding friction incoporated,” Mech. Mach. Theory, vol. 37, no. 2, pp. 167-174, 2002.
[9] P. Heingartner and D. Mba, “Determining power losses in the helical gear mesh,” Gear Technology, pp. 32-37, Sep.-Oct. 2005.
[10] Y. Diab, F. Ville, and P. Velex, “Prediction of power losses due to tooth friction in gears,” Tribol. Trans., vol. 49, no. 2, pp. 260–270, Jul. 2006.
[11] H. Xu, A. Kahraman, N. E. Anderson, and D. G. Maddock, “Prediction of mechanical efficiency of parallel axis gear pairs,” J. Mech. Des. – T ASME, vol. 129, pp. 58-68, Jan. 2007.
[12] T. T. Petry-Johnson, A. Kahraman, N. E. Anderson, and D. R. Chase, “An experimental investigation of spur gears efficiency,” J. Mech. Des.–T ASME, vol. 130, pp. 062601, Jun. 2008.
[13] J. Kuria and J. Kihiu, “Prediction of overall efficiency in multistage gear trains,” Int. J. Aerosp. Mech. Eng., vol. 5, no. 3, pp. 171-177, 2011.
[14] L. Chang, Y. R. Jeng, and P. Y. Huang, “Modeling and analysis of meshing losses of involute spur gears in high-speed and high load conditions,” J. Tribol – T ASME, vol. 135, p. 011504, Jan. 2013.
[15] C. Ratanasumawong, P. Asawapichayachot, S. Phongsupasamit, H. Houjoh, and S. Matsumura, “Estimation of sliding loss in a parallel-axis gear pair,” J. Adv. Mech. Des. Syst., vol. 6, no. 1, pp. 88-103, 2012.
[16] C. Yenti, S. Phongsupasamit, and C. Ratanasumawong, “Analytical and experimental investigation of parameters affecting sliding loss in a spur gear pair,” Engineering Journal, vol. 17, no. 1, pp. 79-93, 2013. [17] N. Ponchai, “Sliding loss model in spur and helical gear with load distribution pattern on gear tooth
surface,” (in Thai) M.S. thesis, Department of Mechanical Engineering, Faculty of Engineering, Chulalongkorn University, Bangkok, 2014.
[18] K. Michaelis, B. R. Hӧhn, and M. Hinterstoißer, “Influence factors on gearbox power loss,” Ind. Lubr.
Tribol., vol. 63, no. 1, pp. 46-55, 2011.
[19] S. Seetharaman, A. Kahraman, M. D. Moorhead, and T. T. Petry-Johnson, “Oil churning power losses of a gear pair: experiments and model validation,” J. Tribol. – T ASME, vol. 131, p. 022202, 2009. [20] KHK Stock Gear 3013, 2016.
![Fig. 5. Back-to-back gear test rig [16] and the positions of vibration measurement on the gearbox surface](https://thumb-us.123doks.com/thumbv2/123dok_us/8107597.235511/9.595.73.517.76.479/fig-gear-test-positions-vibration-measurement-gearbox-surface.webp)