structure: Insights from the semantic fluency task. White Rose Research Online URL for this paper: http://eprints.whiterose.ac.uk/107035/
Version: Accepted Version
Article:
Crowe, S.J. and Prescott, T.J. (2003) Continuity and change in the development of category structure: Insights from the semantic fluency task. International Journal of Behavioral Development, 27 (5). pp. 467-479. ISSN 0165-0254
https://doi.org/10.1080/01650250344000091
[email protected] https://eprints.whiterose.ac.uk/
Reuse
Unless indicated otherwise, fulltext items are protected by copyright with all rights reserved. The copyright exception in section 29 of the Copyright, Designs and Patents Act 1988 allows the making of a single copy solely for the purpose of non-commercial research or private study within the limits of fair dealing. The publisher or other rights-holder may allow further reproduction and re-use of this version - refer to the White Rose Research Online record for this item. Where records identify the publisher as the copyright holder, users can verify any specific terms of use on the publisher’s website.
Takedown
If you consider content in White Rose Research Online to be in breach of UK law, please notify us by
Structure: Insights from the Semantic Fluency Task
Running title: Category structure in semantic fluency
Samantha J. Crowe, Department of Psychology, University of Liverpool, UK. Tony J. Prescott, Department of Psychology, University of Sheffield, UK.
Address for correspondence: Dr Tony J. Prescott,
Department of Psychology, University of Sheffield, Western Bank, Sheffield, S10 2TP, UK.
Email: [email protected] Telephone: +44 114 2226547 Fax: +44 114 2766515
Continuity and Change in the Development of Category
Structure: Insights from the Semantic Fluency Task
Samantha J. Crowe and Tony J. Prescott
Abstract
Children aged between 5 and 10 years old were tested on a semantic fluency
(freelisting) task for two categories: animals and body parts. Additive tree analysis
(Sattath & Tversky, 1977) was used to clusters items based upon both their proximity
in the generated lists and their frequency of co-occurrence; the resulting trees together
with production frequency data were compared across three age groups. For the
animals category, this analysis revealed that although older children named
proportionally more non-mammals, at all ages children tend to cluster animals
according to their environmental context. For body parts, the analysis showed more
parts, particularly internal organs, named with age and a cluster of face parts generated
by all age groups. A novel feature of the current research was the use of statistical
measures of additive tree similarity. The results are discussed with respect to theories
of developmental change in the organization of conceptual memory, and are viewed as
supporting an assumption of continuity with age in the use of schematic relations in
category structure. Insights are drawn from connectionist modeling to help explain the
Introduction
How does the structure of conceptual memory change during the early school
years? Between the ages of five and ten children show a massive increase in
knowledgeÑthey know more concepts (Clark, 1995), they know much more about
the relationships between concepts (Kail, 1990), they make more inferences on the
basis of their conceptual knowledge (Paris, Lindauer & Cox, 1977), and they make
more sophisticated ontological distinctions (Keil, 1983). The nature of children's
conceptual knowledge also appears to change. For instance, younger children show a
bias towards organizing concepts schematically (or thematically), that is, in relation to
event or scenes (Nelson & Gruendel, 1981; Mandler, 1983; Nelson, 1983), whilst
older children and adults seem to think of concepts primarily in terms of their
similarity (functional or perceptual) to each other, that is, in terms of their taxonomic
relations (Bjorklund, 1985; Lucariello, Kyratzis & Nelson, 1992). As they grow older
children also make different inferences on the basis of their knowledge or ÔtheoriesÕ
about the world (Carey, 1985), and appear to have more and better strategies for
storing and retrieving conceptual information (Kail, 1990).
An important and enduring question with regard to many of these changes is whether
they involve a radical reorganization of conceptual memory, or whether they arise
from more continuous and incremental forms of change in which new information is
assimilated to earlier memory structures that retain key aspects of their original form
(Mandler, 1983; Eimas, 1994). In this article we use children's production of animal
and body-part terms in the semantic fluency task to investigate these questions and
report findings that support a view of continuity of memory organization over the
The semantic fluency procedure, also termed conceptual fluency, freelisting, or
category production, requires participants to generate as many exemplars of a category
as possible in a given length of time. When a word or concept is activated in memory
(and then spoken) we assume that it will in turn activate other words or concepts
which are semantically similar or associatively related to it. This assumption, which is
well supported by evidence from numerous semantic priming studies (see Neely,
1991), implies that the order in which words are produced in the fluency task will
provide an indirect measure of the psychological proximity of the items generated.
Henley (1969) and Storm (1980) provide additional evidence for this assumption by
demonstrating that animals of close psychological proximity (as indicated by other
semantic memory tasks such as pair rating, sorting, and verbal association) are named
in close proximity in lists. Performance in the semantic fluency task also shows a
number of consistent characteristics in both children and adults. First, the rate of
production of new items over the duration of the task slows with time following a
hyperbolic decline (Gruenewald & Lockhead, 1980; Kail & Nippold, 1984; Grube &
Hasselhorn, 1996). Second, items that are more typical of a category tend to be
produced with higher relative frequency (i.e. by more subjects) than poorer category
exemplars (Henley, 1969; Uyeda & Mandler, 1980; Kail & Nippold, 1984; Grube &
Hasselhorn, 1996). Third, the most prototypical category members tend to be produced
first, followed by familiar (but not prototypical) items, followed by atypical or unusual
items (Kail & Nippold, 1984). Finally, items are generally produced in short bursts of
conceptually-related words (Bousfield & Sedgewick, 1944; Gruenewald & Lockhead,
1980). Many of these findings support the view that the arrangement of items in the
Several studies have employed the semantic fluency task with the aim of
understanding changes in memory organization during childhood (Nelson, 1974;
Storm, 1980; Lucariello et al., 1992; Grube & Hasselhorn, 1996), the category of
animals being most widely studied.
In the earliest study of this kind, Nelson (1974) found that 5-year olds produced, on
average, half as many items as 8-year olds when freelisting nine natural language
categories. For the animal category she found that children predominantly respond by
naming mammals, with older children naming relatively more non-mammals (species
of birds, reptiles, etc.) and members of mammalian sub-classes (e.g. breeds of dogs)
than younger children. This finding was interpreted as showing an expansion of the
hierarchical organization of the animal category with age. The two groups studied also
differed in their most frequent responses with the 8-year olds naming domestic
animals (dog, cat, and horse) most often, and the 5-year olds naming wild animals
(giraffe, lion, elephant, tiger) with greater frequency.
Whereas Nelson looked at conceptual fluency just in children, Storm (1980) studied
the freelisting of the animal category across a much broader ranger or subject
groupsÑ children (6- and 9-year olds), teenagers, college students, and zoology PhD
candidates. Her results confirmed Nelson's finding of increased productivity with age
and educational experience. For each experimental group, and for 25 selected animal
terms, Storm also computed a mean inter-item similarity score for all pairs of concept
words based on their proximity in the generated lists. This measure was used as input
to a hierarchical clustering algorithm that formed tree structures in which the most
proximal items named by each group were clustered together. Surprisingly, Storm
groups studied. At all ages, subjects clustered animals predominantly according to
their habitat/environmental context. Specifically, farm animals (pig, cow, horse),
domestic animals (cat, dog, mouse), and wild/zoo animals (lion, leopard, elephant,
giraffe), tended to be grouped together. In this respect even the trees generated for PhD
zoology candidates, for whom biological criteria for categorization can be presumed to
be highly salient, were not dissimilar from those produced by 6-year old kindergarten
childrenÑin all subjects the primary mode of mode of organization in freelisting
appears to have been a schematic one.
In a further study comparing young children with adults, Lucariello, Kyratzis, and
Nelson (1992) tested 4- and 7- year old children and college students on a semantic
fluency task for five categories: clothes, animals, food, furniture, and tools. A
hierarchical clustering methodology was again used to elucidate the conceptual
structures underlying the lists produced by different age groups, this time analyzing,
for each age group, all items produced by at least three subjects in that group. For the
4-year-olds this analysis showed a main cluster of zoo animals, and for the
7-year-olds, clusters composed of domestic animals, zoo animals, forest animals, and aquatic
animals. For the adults, the analysis revealed a substantial number of clusters that
could again be classified in terms of habitat/environmental context, with a cluster of
ÔprimatesÕ (not present in the childrenÕs productions) that included humans. Whilst the
use of environmental context in many of these clusterings was again interpreted as
showing conceptual organization by schematic (i.e. event-based) relations, Lucariello
et al. also interpreted their results (together with those for categories) as supporting an
Finally, Grube and Hasselhorn (1996), looked at the performance of 8-year olds,
compared with older children, on the semantic fluency task for the animal category.
They found that both age groups clustered items in terms of environmental context
(confirming earlier findings), and produced similar typicality structures; that is, the
same animals were named at high frequency at both ages. Interestingly, the degree of
environmental clustering in the lists of these children was related to productivity (the
total number of items generated) only for the older group. This finding was interpreted
as showing that some 10-year olds use strategies that exploit the organization of their
conceptual memory structures to allow more effective memory retrieval. These
researchers also found an increase in the use of strong inter-item associations (e.g.
dogÑcat, lionÑtiger) in older children, a factor which was again linked with greater
productivity and strategy use.
In summary, much of the previous work on developmental change in the semantic
fluency task has emphasized quantitative rather than qualitative change in the category
lists generated by childrenÑolder children generate more items (possibly making
more use of strategic retrieval processes) but appear to cluster semantic knowledge in
similar ways to their younger counterparts. However, data on the youngest children
(4-6 year olds) is limited with only three studies performed to date that have generated
somewhat inconsistent results. Nelson (1974) found changes in typicality ratings
(production frequencies) between 5- and 8-year olds, and has argued for an increase in
the hierarchical organization of conceptual knowledge of this time period, Storm's
results indicated no clear differences in memory organization between 6-year-olds and
older children, while Lucariello et al. (1992) found evidence to support both continuity
in the use of schematic (spatiotemporal) relations with age, and some evidence of
semantic memory research, these studies also stand in interesting contrast to research
that suggests significant changes in the organization of conceptual knowledge over the
same time period (see Bjorklund, 1985; Carey, 1985 for review).
One possible limitation of the research described above is that the pattern of results
obtained with the frequently studied category of animals may not provide a
representative picture of general conceptual change in semantic memory. Although,
Lucareillo et al. (1992) found similar results across three categories (food, animals,
and clothes), they also found ambiguous and somewhat inconclusive results for two
other categories (furniture and tools) that are poorly developed in young children. The
current study therefore investigated a further category of conceptual knowledge that is
well represented in young childrenÕs vocabulary and may undergo significant
development between the ages of 5 and 10. Specifically, we examined semantic
fluency for the category of human body parts. Substantial changes in children's
knowledge of body parts (particularly internal ones) are known to be occur within this
age range (Gellert, 1962), and it has been suggested (Carey, 1985) that a major shift in
the understanding of the body occurs between the ages of eight and ten as children
develop intuitive ÔbiologicalÕ theories of how the body works. Since the body parts
category has received little attention in studies of childrenÕs semantic fluency, yet
remains a subject of considerable theoretical interest (see, e.g. Jaakkola & Slaughter,
2002), an investigation into its conceptual structure as revealed by the freelisting task
seems timely.
The current study was designed to look for specific evidence of continuity or change,
between the ages of 5 and 10, in the conceptual memory structures underlying
semantic fluency for the animals and body parts categories. Our basic methodology is
similar to Storm (1980) and Lucariello et al. (1992) in that we employ cluster analysis
techniques; however, relative to these other studies we have made a number of
innovations.
First, Storm (1980) analyzed the same 25 animal concepts in all groups. These were
animals that a majority of the youngest children were able to name in a separate
picture naming task rather than those which occurred with high frequency during the
fluency task. This restriction clearly excludes from the analysis any differences
between age groups arising from changes in production frequencies and therefore may
obscure significant developmental change. In contrast, Lucariello et al. (1992)
analyzed different sets of items at each age group, with the selection of items based on
their production frequencies. Relative to StormÕs procedure this methodology is likely
to highlight differences and mask continuity between age groups. The present study
focuses, therefore, on the most frequent responses made during the category fluency
task both within and across age groups, so that the data can be appropriately analyzed
for both similarities and differences between groups.
Second, most previous studies have used the distance between items within lists as
their measure of inter-item similarity for input to a hierarchical clustering algorithm.
However, a second factor of potential significance for estimating similarity, which is
largely over-looked in fluency studies, is the number of times, over a group of
subjects, that two items are mentioned together. In particular, when each subject
a high psychological proximity will be more likely to co-occur in lists than items with
low proximity. We have therefore developed a measure of inter-item similarity based
on both within-list proximity, and across-list item co-occurrence. We propose that this
combined measure, which is derived analytically using expected probability
distributions, provides a robust estimate of inter-item similarity that is particularly
appropriate for analyzing fluency data from children of 6 years of age or less whose
category listings often contain fewer than ten items.
Third, to perform the hierarchical cluster analyses we have used the additive tree
(addtree) algorithm developed by Sattath & Tversky (1977). In comparison to some
other hierarchical clustering techniques, the addtree technique places fewer a priori
constraints on the relationships between items and can therefore provide a more
faithful representation of the data. A further limitation of studies using hierarchical
clustering is that comparisons between trees are generally made on a qualitative basis.
A unique feature of the current study is that we have used the Bk measure devised by
Fowlkes and Mallows (1983) to provide appropriate statistical measures of the
similarities between two hierarchical clusterings.
Methods
Participants
The subjects for this study were 155 children from two schools, both in Sheffield, UK.
These children are predominantly from white, urban families of social class II and III.
The children were divided into three groups on the basis of age/school year group: 50
children in year 1, mean age 5:9 years, range 5:1 to 6:4; 55 in year 3, mean age 7:7,
spoke English as their first language. All subjects completed the semantic fluency task
for both the animals and body parts categories, the additional categories of food items,
clothes, vehicles, and plants were also tested, and summary statistics for these other
categories are reported below. The order in which categories were listed was
randomized across subjects.
Administration of Semantic Fluency Tasks
The children were tested individually at school, in a quiet area. For each category,
each child was asked to ÒTell me all the _______s you can think ofÓ. A one minute
interval was allowed for each category. Although some previous studies have allowed
a longer time period, the one minute interval was selected here on the basis that
subjects generate items at a much quicker rate early on in the fluency task, and also
tend to generate more typical items toward the start of the task. Pilot studies also
indicated that some of the youngest children found it difficult to focus on the task for
more extended periods. Identical instructions were used with all the children, however,
the younger children sometimes required encouragement. Where encouragement was
given, care was taken not to influence the childÕs responses. An example would be
ÒCan you think of any (more) _______s?Ó or ÒWhich other ________s do you know?Ó
Finally, children were asked to shut their eyes throughout the body parts task so that
they would be unable use their own body, or that of the experimenter, as a visual cue.
Obtaining Similarity Scores
The fluency tasks provided separate lists of category items for each child, in
similarities were derived using a metric we have developed to control for differences
in production frequency between items and age groups. This metric has two
component measures, termed c and dw below, one based on within-list item proximity
(c) the other on across-list item co-occurrence (dw). In the following we describe how
each measure is calculated and then combined to form the overall inter-item similarity
metric"cdw. Note that for all of the measures defined here, increasing value indicates
decreasing similarity (or increasing dissimilarity).
The measure, c, of within-list item proximity is defined first. Let a and b be two
non-identical category items that occur at the index positions ial and ibl in the category list
l, containing nl total items, generated by a given participant. Assume, initially, that a
and b each occur only once in list l; in this case we define the normalized inter-item
distance between a and b as the absolute value of the distance between the two items
in the list divided by the total length of the list, i.e.
ial /ibl
nl .
Using nl as a normalization term is appropriate here since the expected probability
distribution for values of ial /ijl has a standard deviation that increases in an
approximately linear manner with list lengthi.
Participants sometimes repeat one or more items when generating a category listing. If
either of the items a or b is repeated in list l we choose our measure of inter-item
distance dabl to be the smallest of all such distances
dabl ?min$a,bŒl ial/ibl
nl
Ã" Å" Ä" Ä"
However, the expected probability distribution will also be significantly narrower for
repeated items, so it is appropriate in this situation to include an additional scaling
term. Let nal and nbl be the number of occurrences of a and b respectively in list l.
Based on an analysis of the relevant expected probability distributions, we have found
that a suitable scaling termii is given byn(nalnbl) where n(1)?1.0, n(2)?0.67, n(3)?0.5, n(4)?0.41, n(6)?0.28. These values cover all the occasions of repeated
items in our data-set.
Let Fab be the total number of subjects in a given group whose responses contained the
pair a and b. We can now define c such that
c(a,a)?0, c(a,b)? 1
Fab l(aŒ
Â
l®bdŒlabl) n(nalnbl)Ã" Å" Ä" Ä"
Ô" Ö" Õ" Õ".**
In other words, c provides a measure of inter-item similarity that is zero (maximally
similar) between an item and itself, greater than zero for all non-identical items a and
b, and increases with the normalized inter-item distance between a and b averaged
over all participants who named both items at least once in their category list.
Next we define the second measure of inter-item similarity, dw. based on across-list
item co-occurrence, which can be combined multiplicatively with c to form the
overall inter-item similarity metric cdw.
Let faand fb be the number of participants in the group naming items a and b
respectively, and let N be the total size of the group. The expected number of
co-occurrences of items a an b is then given byiii
**
E(Fab)? fafb
N .
We now calculate the normalized number of co-occurrences as the difference between
this expected value and the observed valueFab,
Cab ?E(Fab)/Fab.
Let the maximum and minimum obtained values of Cab for a given group of
participants be C- and C/ respectively, and let S?1-max
*
C-, C/+
. d is now definedas
dw(a,a)?0, dw(a,b)?1-wCab
S .
Here S provides a scaling factoriv such that /1>Cab/S> -1 for all a and b, and w
(0 w 1) is a weight used to determine the relative contribution of dw"to the
combined measure of item similarity cdw0 Note that dw will be equal to 1 if the
observed number of co-occurrences matches the expected frequency, thus making no
net contribution to cdw. If the number of co-occurrences is greater than expected, dw
will be less than 1 reducing the overall metric proportionately. Finally, if the number
of co-occurrences is less than expected, dw will be greater than 1 thereby increasing
the size of cdw. As the number of participants naming either item a or b approaches
N (the size of the group), Cab becomes a less useful indicator of psychological
proximity (to see this, observe that at fa ? N the variance in Cab will be zero, every
occurrence of item b will necessarily be a co-occurrence with item a!). However, in
such situations dw will take a value close to 1, giving a combined similarity metric
therefore appropriate to use dw as part of a combined measure regardless of the
expected frequency of individual category items.
In the addtree analyses reported below all matrices of similarity data were generated
using the metric cd0.5"as the value w= 0.5 was found to generate a suitable balance
Results
Age related trends in productivity and production frequencies (typicality) are
described first, followed by the addtree analyses of category structure. Except where
stated all results are significant at p<0.01.
Productivity
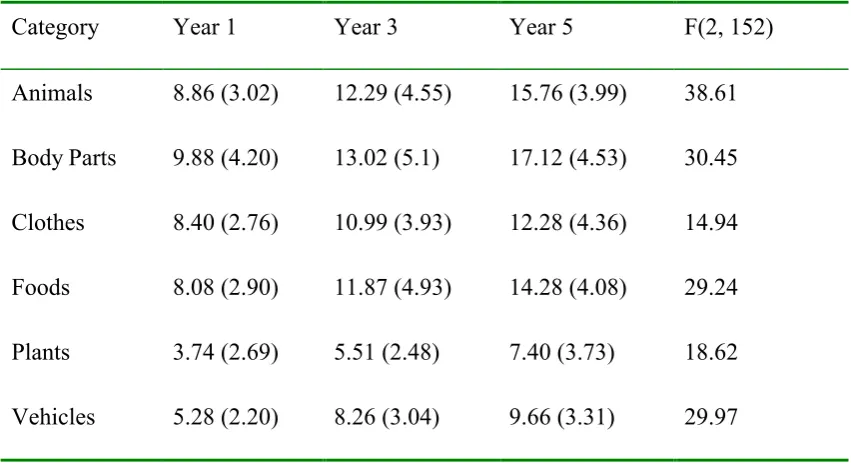
One-way ANOVA revealed substantial overall increases with age in the mean number
of responses generated for all categories. The means, standard deviations and F-values
are shown in table 1. Post hoc tests (FisherÕs PLSD) showed significant increases in
the mean number of items produced with increasing age in all categories, except
between year 3 and year 5 groups for the clothes category (for the vehicles category
the difference between year 3 and year 5 was significant at p<0.05). There were also
significant differences between the number of items listed in the different categories
for all three year groups (repeated measures ANOVA: Year 1, F(5)= 39.82; Year 3
F(5)= 51.86; Year 5, F(5)= 68.95). In all years, the body parts category generated the
most responses followed by the animals category, clothes and foods generated an
intermediate numbers of responses, and vehicles and plants the fewest. In view of the
higher productivity for animals and body parts, and the theoretical importance of
these two categories as outlined in the introduction, the remaining analyses focus on
these two categories exclusively.
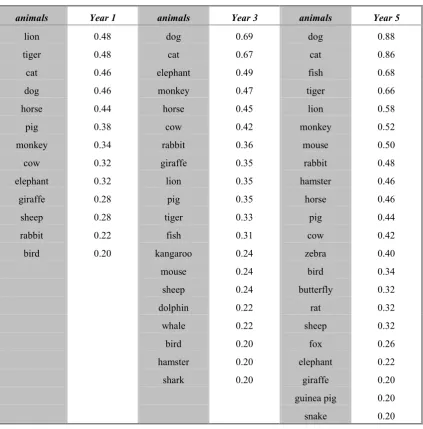
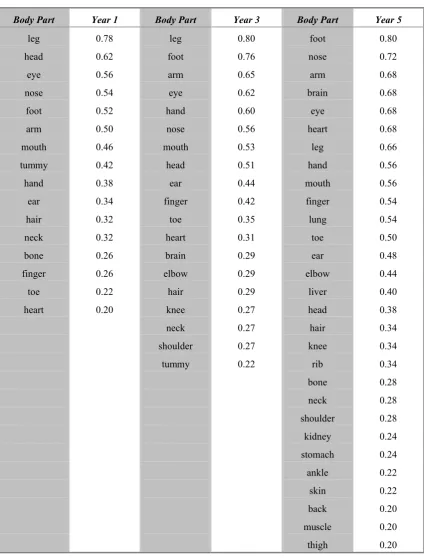
Production frequencies
The production frequency for any given category item is calculated as the proportion
of children in a selected group who named that item at least once. Tables 2 and 3
show, for each of the three year groups, the production frequencies of items in the
animals and body parts categories generated by at least 20% of the children in that
group.
For each category, product-moment correlations were calculated for the production
frequencies of the items named by a least 5% of participants in all age-groups (there
were 34 such items in the animals category, 28 in the body parts category). For the
animals tasks this gave the correlations: Year 1 and Year 3 r(32) = 0.84, Year 1 and
Year 5 r(32) = 0.77, Year 3 and Year 5 r(32) = 0.78. For the body parts task Year 1
and Year 3 r(26) = 0.89, Year 1 and Year 5 r(26) = 0.63, Year 3 and Year 5= 0.83.
The strength of these correlations indicates considerable similarity between the typical
responses generated by the different year groups.
Significant correlations were also found with the results of previous semantic fluency
studies (Posnansky, 1978; Grube & Hasselhorn, 1996). For instance, Posnansky
(1978) calculated production frequencies for 25 different categories including animals
and body parts for children in grades 2, 3, 4, and 6, for a 1-minute, written, freelisting
task. Comparing the year 3 and year 5 groups in the current study with the nearest
equivalent groups in Posnansky's study (Grades 2 and 4 respectively), gave
correlations for the animals task of r(17) = 0.80 (year 3 and grade 2) and r(20) = 0.74
(year 5 and grade 4), and for the body parts task of r(19) = 0.79 (year 3 and grade 2)
Morrison, Chappell, and Ellis (1997) have provided estimates of the age of acquisition
of many of the animal terms investigated here. Production frequencies of animals
terms from the current study showed a significant negative correlation with their
'objective age of acquisition (75%)' measure for all three age groupsÑyear 1 r(22) =
-.48 (p<0.05), year 3 r(22) = -0.57, and year 5 r(22) = -.57. This result indicates that
some of the most frequently produced responses for the animal category are also those
that are acquired first.
Finally, comparisons were made with adult typicality ratingsvi, collected by Uyeda and Mandler (1980), for items in the categories Ôfour-footed animalsÕ and Ôparts of the
human bodyÕ. This gave the correlations: for the animals category, year 1 r(16)= -0.68,
year 3 r(16)= -0.57 (p<0.05), and year 5 r(16)= -0.59; and for the body parts category,
year 1 r(18)= -0.73, year 3 r(18)= -0.82 (p<0.05), and year 5 r(18)= -0.67. Thus,
production frequencies, at all ages, appear to provide a good indication of item
typicality at least with respect to adult norms.
**** TABLE 2 ABOUT HERE ****
**** TABLE 3 ABOUT HERE ****
Composition of category data
Following Nelson's (1974) finding that 8-year-olds name more non-mammals than
5-year-olds, the ratio of non-mammals to total animals was compared across age groups.
This measure, with group medians (ranges) of 0.20 (0Ð0.67) for year 1, 0.22 (0Ð0.83)
predominantly, and that older children named significantly more non-mammals
(Kruskal-Wallisvii H(2)=6.17."p<0.05, sum of ranks= 3362.0, 4254.0, and 4474.0 for years, 1, 3, and 5 respectively).
Nelson also noted a predominance of ÔwildÕ animals in the top five responses of 5 year
olds (giraffe, lion, elephant, tiger, horse). In the current study the top five of the year 1
group (mean age 5.9) includes two wild animals (lion, tiger, cat, dog, horse).
However, from table 2 it is clear that the older children also name some ÔwildÕ animals
with high frequency. An interesting trend in the current data-set is the apparent
increase in typicality with age for two domestic animals, cat and dog, relative to other
animal terms. Specifically, in the year 1 group, the average production frequency for
these animals (0.46) is only slightly greater (0.06) than the average production
frequency for the overall top ten items (0.40). In years 3 and 5, however, the same
comparison shows a difference of 0.22 (0.68 - 0.46), and 0.26 (0.87 - 0.61)
respectively. This difference suggests that between the ages of 6 and 8 there may be a
substantial increase in the status of cat and dog as prototypical animals.
Carey (1985), following Gellert (1962) and others, has argued for a significant change
in childrenÕs conceptual understanding of internal body parts between the ages of 8
and 10. Data from the current study was therefore analyzed to determine the ratio of
internal organsviii (i.e. heart, brain, lung, etc.) to total body parts named by each age group. This measure, with group medians (ranges) of 0.0 (0Ð0.5) for year 1, 0.07 (0Ð
0.75) for year 3, and 0.21 (0Ð0.64) for year 5, indicated a significant increase with age,
with year 5 children in particular, naming many more internal organs than the
youngest group (Kruskal-Wallis: H(2)=38.78, p<0.01, sum of ranks= 2749.0, 3963.5,
Representing category structure
Several addtree analyses were carried out for each of the category/group cdw
similarity matrices using the ADDTREE/P program written by Corter (1982). First, we
were interested in analyses that revealed the conceptual structure of childrenÕs
knowledge, taking into account increasing productivity and changes in production
frequency with age. Target concepts for these within-group analyses were chosen on
the basis that they had been produced by at least 20% of the children in the particular
age group being considered. In order to perform these analyses items were excluded if
they failed to co-occur at least once with each of the other items in the set, since, under
these circumstances, a full matrix of inter-item distances cannot be computed. For this
reason a small number of the items that appear in Tables 1 and 2 are excluded from
the corresponding addtree analyses. Second, we wanted to allow direct comparison of
related conceptual structures across age groups. Target concepts for these analyses
were chosen on the basis that they had been produced by at least 20% of participants
in the youngest age group (year 1), and co-occurred at least once in all three groups.
Interpreting Addtrees
Several factors are of note when interpreting addtrees.
First, a treeÕs Ôgoodness of fitÕ to the data is expressed as a stress value (the measure
reported is KruskalÕs stress measure) ranging from 0 (best possible fit) to 1 (worst
possible fit). High stress values may indicate that a tree is not an adequate
representation of the similarity structure of the data. The statistic r2 is also reported, which provides a measure of the proportion of the variance of raw distances (i.e. the
matrix of similarities used as input to the analysis) that is accounted for by the distances
shown in the tree, thus tree representations which most accurately fit the data will have
A second factor for consideration is the division of concepts into clusters. Each addtree
is composed of nodes (horizontal lines in the figures displayed below) and arcs (vertical
lines). Concepts are represented by external nodes and are formed into clusters by
internal nodes; all nodes are joined by arcs. The distinctiveness of a cluster and the
degree of similarity within a cluster are both indicated by the length of nodes, with the
shortest lengths indicating the greatest similarity. For any two items in the tree, their
inter-item similarity is indicated by the sum of the lengths of the nodes in the path
between the two items (again shorter= more similar). Note that the length of arcs has no
significance.
Finally, in comparing across age groups, some measure is needed of the similarity of
two trees with identical sets of external nodes but different internal structure (note, no
statistical measures exist for comparison of trees with different sets of external nodes).
Two trees may be similar at one level of clustering but dissimilar at another, for this
reason we have used the statistic Bk developed by Fowlkes and Mallows (1983), which
provides multiple measures of similarity at different levels of clustering. Further
explanation of the calculation and interpretation of the Bk statistic is given below.
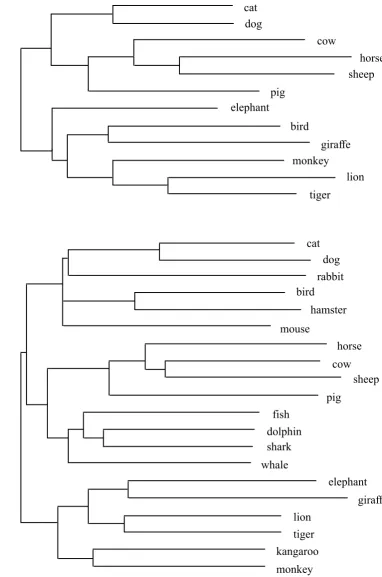
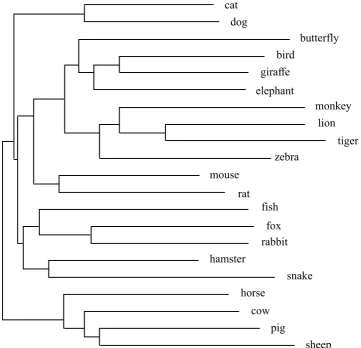
Analysis of Conceptual Structure for the Animals Task
Figure 1 shows addtree analyses of animal names for all three year groups, where items
were selected, for each year group, on the basis that they were listed by at least 20% of
the children in that group (year 1 stress = 0.094, r2 = 0.712; year 3 stress = 0.072, r2 = 0.702; year 5 stress = 0.079, r2 = 0.660).
In accordance with previous findings (Storm, 1980; Lucariello et al., 1992; Grube &
Hasselhorn, 1996) these analyses show that typical environmental context is a key
organizing factor in children's freelisting of the animal category. In year 1, two major
clusters are evident containing domestic/farm animals (cat, dog, cow, horse, sheep, pig)
and wild/zoo animals (elephant, giraffe, monkey, lion, tiger). Farm animals form their
own distinct sub-cluster within the larger domestic/farm animal group. Year 3 shows a
cluster containing domestic pets (cat, dog, rabbit, hamster, mouse), and, within the
second branch of the main tree, sub-clusters of wild/zoo animals (elephant, giraffe,
lion, tiger, kangaroo, monkey), farm animals (horse, cow, sheep, pig), and aquatic
animals (fish, dolphin, shark, whale). Finally, the year 5 tree again has a large cluster of
predominantly wild/zoo animals (giraffe, elephant, monkey, lion, tiger), a cluster of
farm animals (horse, cow, pig, sheep), and several smaller clusters including the pairs
(cat, dog), (mouse, rat), (hamster, snake), and the triplet (fish, fox, rabbit). Whilst the
interpretation of some of these smaller clusters is less obvious (fish, fox, rabbit, for
instance could be a collection of British wild animals), the general trend toward
clustering by environmental context seems clear. The term bird appears in all three
trees but is not consistently clustered with a specific group, perhaps because of its status
as a super-ordinate class that includes animals falling into many different schematic
categories.
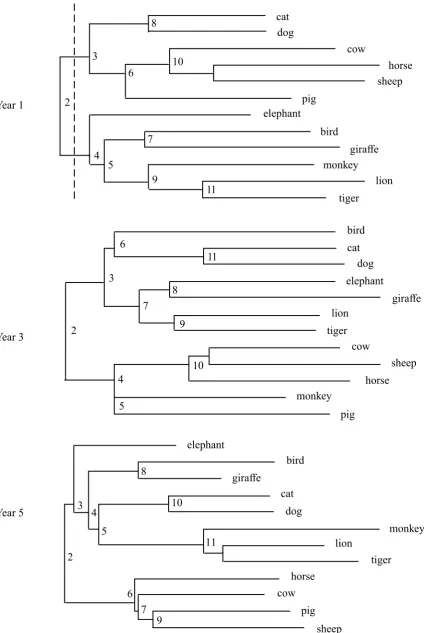
Figure 2 shows addtree analyses of animal names for all three year groups, where items
were selected, for all year groups, on the basis that they were listed by at least 20% of
the children in the year 1 group and co-occurred at least once in all three year groups
0.079, r2 = 0.862). Note that, for the year 1 group, the trees generated for this analysis and the previous one in Figure 1 are identical.
**** FIGURE 2 ABOUT HERE ****
In each tree in Figure 2 the internal nodes are numbered according to the number of
clusters (k) formed if the tree is split below that point. For example, for the Year 1 tree,
the dotted line in Figure 2 shows the decomposition of the tree into k= 2 clusters. The
comparison statistic Bk, devised by Fowlkes and Mallows (1983), provides a measure of
the similarity of two trees at each level of clusteringix for k= 2, É, n-1, where n is the number of objects in the tree. Bk varies between 0, maximum dissimilarity, and 1,
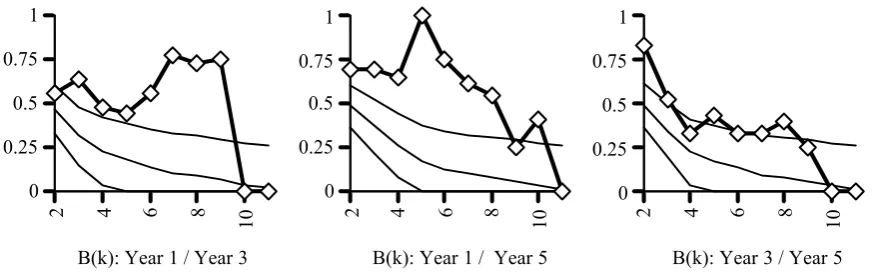
maximum similarity. The graphs at the base of Figure 2 show plots of Bk for the
comparisons, from left to right, Year 1 with Year 3, Year 1 with Year 5, and Year 3
with Year 5. Values of Bk are shown by the diamond-shaped point plots for k= 2, É,11.
The solid line and the two dotted lines on each graph show, respectively, the expected
value of Bk and its upper and lower limits. Values of Bk outside the range indicated by
these limits can be considered significantx. On average, two-thirds of the Bk scores (7/10, 8/10, and 5/10 in the three comparisons) lie above the upper limit of their
expected values, indicating that the trees generated for all three groups in this task are
similar at many levels of clustering.
Analysis of Conceptual Structure for the Body Parts Task
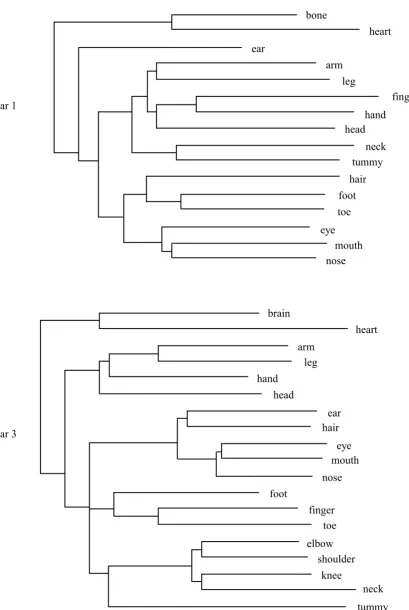
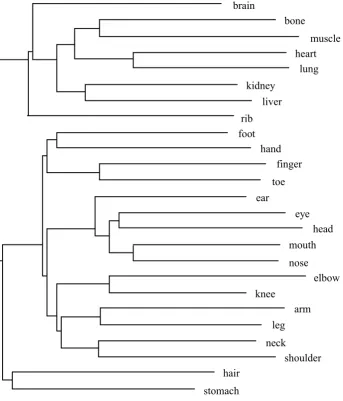
Figure 3 shows addtree analyses of body parts for all three year groups, where items
the children in that group ( Year 1 stress = 0.080, r2 = 0.740; Year 3 stress = 0.085, r2 = 0.800; Year 5 stress = 0.072, r2 = 0.708).
**** FIGURE 3 ABOUT HERE ****
The children in all years distinguished a cluster of internal parts (e.g bone, heart) and a
cluster of face parts (e.g. eye, nose, mouth), The addtree analysis clearly illustrates
childrenÕs increasing knowledge with age of internal parts of the body. Year 5 children
named many more internal body parts than the younger age groups; furthermore, the
addtree analysis for this group shows some internal organization within the cluster of
internal parts, specifically, associated pairs of internal organs (heartÑlung and liverÑ
kidney), and muscular-skeletal parts (boneÑmuscle). The associative pair (armÑleg)
appears consistently in all year groups, digits (finger, toe) either cluster with each other
or within the appendages to which they attach (hand, foot). A group of body parts than
can be thought of as joints or connectors form a distinct cluster in the year 3 group
(elbow, shoulder, knee, and neck), but appear as two separate pairs at year 5 (elbow,
knee) and (shoulder, neck). In the year 1 group neck is clustered with ÔtummyÕ (the most
popular term amongst younger children for the abdomen) perhaps on a similar basis that
they are both ÔconnectingÕ parts.
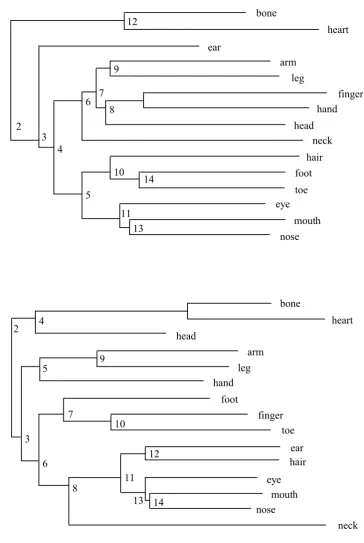
Figure 4 shows addtree analyses of body parts for all three year groups, where items
were selected, for all year groups, on the basis that they were listed by at least 20% of
the children in the year 1 group and co-occurred at least once in all three year groups
left to right, year 1 with year 3, year 1 with year 5, and year 3 with year 5. As with the
animals category, a two-thirds majority of Bkscores lie above the upper limit of their
expected values (8/13, 7/13, and 11/13 in the three comparisons) indicating similarities
at many levels of clustering between all three year groups.
**** FIGURE 4 ABOUT HERE ****
Discussion
The semantic fluency task cannot provide exhaustive access to a childrenÕs category
knowledge, and, in the somewhat abbreviated form used here, is unlikely to provide
access to even a majority of the concepts a child knows for any given category. What it
can reveal, however, is what items of a category spring most easily to mind, and thus, in
some sense are most typical of that category, and what items within a category are most
strongly linked and are therefore likely to be recalled together. In this discussion we
first summarize the findings for the two different categories studied (animals and body
parts), and then consider the validity and generality of the results as reflections of the
organization of conceptual structure in memory. We then consider the implications of
these findings for a number of influential theories of conceptual memory development.
Finally, we suggest a possible explanation for the pattern of results shown based on
insights from connectionist modeling of memory acquisition.
Development of semantic fluency for the animals category
The degree of similarity across age groups both in terms of production frequencies (as a
measure of typicality) and clustering (as shown by the addtree analysis) suggests an
also confirms the finding that children from an early age tend to cluster animals
primarily in terms of their typical environmental context (i.e. where animals are
experienced or might be expected to be experienced). Although older children know
and list significantly more animals, this primary mode of clustering is maintained. Thus,
8- and 10-year-olds named more non-mammals, but these were clustered together with
mammals found in similar contexts, for instance, kangaroo was found clustered with
monkey (both wild/zoo animals), while fish and shark shared an aquatic cluster with
dolphin and whale. There was little support for NelsonÕs (1974) suggestion of general
change, between 5 and 8 years, in the most frequently produced items from wild
animals to domestic animals. The current data suggest instead, a more focused increase
with age in the relative frequency of two specific domestic animalsÑcat and dogÑ
implying that these animals are increasingly considered to be prototypical. Since
NelsonÕs subjects were slightly younger than those investigated here (mean age 5.1
years compared to 5.9 years for the current year 1 group), the prototypicality of
domestic animals for young children may warrant some further investigation.
Development of semantic fluency for the body parts category
Production frequency data for the body parts task also showed substantial similarities
across age groups. Children at all ages generated a cluster of internal body parts, and a
cluster of face parts separate from clusters of other body parts. In addition to the
expected increase in the number of body parts named with age, the oldest children also
generated a much large cluster of internal body parts and organs than the younger
children. The basis of clustering for body parts suggest two underlying dimensions of
close together), based around a principle distinction between the head and the trunk.
The second is organization according to function, this is evident in the clustering of
limbs (armÑleg) and in older children of ÔjointsÕ (elbow, knee, shoulder), digits
(fingerÑtoe), and related internal parts (heartÑlung, kidneyÑliver, and boneÑmuscle).
The presence of an increasing number of such functional associations in the older
children suggests that this dimension of organization may become of greater importance
with age, although further research is needed to establish whether there is a reliable,
age-related trend.
Validation of results
One of the most effective techniques for validating cluster analyses is replication
(Aldenderfer & Blashfield, 1984). Similar results for the animal category found in other
studies (Storm 1980; Lucariello et al, 1992; Grube & Hasselhorn, 1996) demonstrate
that the finding of clustering by environmental context in the animals task is a robust
and repeatable one. A second group of children tested by the authors on both the
animals and body parts tasks also showed similar results to those reported here (Hartley,
1999).
A second means of validation is by comparison with other methods of analysis. Several
studies have looked at semantic fluency data for the animals category using
multidimensional scaling (MDS) techniques (Henley, 1969; Chan et al., 1993). MDS
attempts to find a small number of principle dimensions that are able to provide a good
fit to a matrix of inter-item distances. Results from studies that have been successful in
using MDS with adult animal fluency data generally complement the findings of
dimension corresponding to a wild/domestic distinction in semantic fluency data
(1993), and a second dimension corresponding to size, while Henley (1969) found
principle dimensions of ÔferocityÕ and ÔsizeÕ, but also noted clusters of wild and
domestic animals in animal semantic space.
Generality of results
An important question is whether the results of these semantic fluency studies reflect
generic properties of the structural organization of conceptual memory or merely
indicate characteristics of memorial processes that are specific to freelisting tasks.
Support for a generic, rather than task-specific, view comes from the studies of Henley
(1969) and Storm (1980) who have shown that semantic memory tasks such as pair
rating, sorting, and verbal association produce similar results to the semantic fluency
task for the animals category. To further investigate the generality of the current study,
Roberts and Hartley (described in Hartley, 1999) asked children to provide similarity
ratings for the twelve animals with highest production frequency in the semantic
fluency task. Three groups of children were tested, taken from years 1, 3, and 5 of a UK
primary school (i.e. the same age groups as in the fluency study). Addtree analyses of
the resulting similarity matrices showed that the principle basis for clustering in each
age group was environmental context, showing good agreement with the results of the
freelisting task. A tendency to sub-cluster items by size, as described by Chan et
al.(1993), was also evident, particularly for the oldest group (e.g. elephantÑgiraffe,
horseÑcow). Full details of this study are given in Hartley (1999).
Production frequencies in the current study were consistent with those of other fluency
studies and, more interestingly, showed good correlations with norms for Ôage of
assumption that production frequencies in the semantic fluency task reflect the
typicality of category members, and are not simply an artifact of the freelisting
paradigm. Bjorklund and co-workers (Bjorklund, Thompson & Ornstein, 1983;
Bjorklund, 1985) found that childrenÕs judgments of typicality become more similar to
those of adults with age. Such a trend is not evident here in the comparison of
production frequency data to adult typicality ratings. Bjorklund et al.Õs findings have,
however, been called into question by more recent evidence showing that young
children often misunderstand the task of providing typicality judgments (Maridaki
Kassotaki, 1997).
A possible source of task-specific effects in the semantic fluency task is the use of
meta-memorial strategies. For instance, Grube and Hasselhorn (1996) have suggested
that increased productivity in word generation behavior could reflect the use, in older
children, of specific strategies that would make their recall more efficient. Thus, for
instance, children may purposefully decide to produce as many farm animals as they
can, or name parts of the face as they can think of, etc. Although there is good evidence
that older children are more able to use strategies to aid their recall, Bjorklund (1985)
has pointed out the use of such strategies depends upon, and is supported by, conceptual
knowledge. Thus evidence of strategy use is not incompatible with the assumption that
freelisting behavior reflects category structure.
Implications for theories of conceptual memory development
Mandler (1983) has reviewed evidence suggesting that the conceptual knowledge of
young children is organized schematically, that is, in terms of the sort of relationships
scenes. Nelson and her co-workers (Nelson & Gruendel, 1981; Nelson, 1983; Nelson,
Fivush, Hudson & Lucariello, 1983; Lucariello et al., 1992) have made a similar
proposal, suggesting that young childrenÕs conceptual memory is organized around
representations of events, or life experiences, termed scripts. A substantial body of
research (see Mandler, 1983; Bjorklund, 1985 for review) suggests, however, a shift in
knowledge organization with age away from the use of schematic relations and towards
taxonomic ones, that is relations based on the similarity of perceptual and functional
attributes (though see Lin and Murphy (2001) for evidence of the use of schematic
relations in adults).
A further proposal for significant change in conceptual organization between ages 5 and
10 has been made by Carey (1985). Carey argues that children below the age of 8 lack a
biological framework with which to structure their understanding of either the body,
and the operation of its parts, or the animal kingdom, and the relations between its
members. Instead, young children rely on ÔpsychologicalÕ theories of the body, in
which bodily processes are accounted for in terms of what a person Ôwants or thinksÕ,
and make inferences about animals on the basis of their perceived similarity to people
rather than any understanding of the biological relatedness of different animal kinds.
By age 10, Carey suggests that children have come to regard themselves as biological
organisms and have attained a new functional understanding of internal bodily
processes. The development of this Ôintuitive biologyÕ also results in an understanding
of the animal kingdom based on biological inter-relatedness rather than similarity to
humans.
The issue with respect to the current study is not whether there is an increased use of
understanding of biological categories. There is, indeed, persuasive evidence in favor of
both of these proposals. Instead we are concerned here with what these changes might
imply for the organization of conceptual knowledge structures.
With regard to the category of animals, the finding of clustering by environmental
context is consistent with a primary basis for category organization based on schematic
relations. Thus, animals appeared to be encoded in terms of the places in which they are
experienced (i.e. in the home, on a farm, in a zoo, etc.), and are most closely related to
other animals experienced in similar locations. Significantly, this same basic structure
seems to underlie the animal knowledge of all age groups. Therefore, although older
children may have more sophisticated knowledge of animals, that may include
increased understanding of taxonomic relations, there is little to suggest a radical
upheaval with age in the way that this category knowledge is organized. The findings of
increased proportions of non-mammals and invertebrates in the animal freelistings of
older children are consistent with suggestions of the expansion (Nelson, 1974; Anglin,
1977) or redrawing (Carey, 1985) of the boundaries of this category with age. Changes
in category boundaries might themselves be expected to bring about re-organization of
internal category structures. The current study suggests, however, that redrawing the
boundaries of the animal category has a more or less incremental effect on its internal
organization; that is, such changes are accommodated through the addition of new
environmental contexts, or the inclusion of new category members in existing context
groupings.
For the body parts category, the current study suggests a primary organization of
external parts based on the differentiation of face/head parts from trunk/limb parts.
this finding is also consistent with the proposal that schematic relations form the main
substrate of conceptual representations of young children. There was also some
evidence that taxonomic (functional) relations may play a role in the sub-cluster
organization of external body parts especially in the older age group.
Younger children in our study generated only a small number of internal body parts,
and there was insufficient information in the fluency data to determine whether these
are organized in any structured way. In contrast the oldest children in our sample (9 and
10 year olds) generated a substantial cluster of internal body showing some evidence of
internal structure according to function. This data would appear to consistent with
CareyÕs assertion that between the ages of eight and ten children development new
representations of the insides of the human body based on a functional understanding of
bodily processes.
Continuity and Change in Category Structure
How can we make sense of the apparent persistence of early forms of memory
organization in the face of significant theory change and increased familiarity and use
of taxonomic relations with age? Research on connectionist models of human memory
(Rumelhart & Todd, 1992; Elman, 1993; McClelland, 1994; Hartley, Prescott &
Nicolson, 1998), since it allows the investigation of learning trajectories, suggests one
possibility. The landscape of possible network configurations for a neural network
usually contains many local optimaÑconfigurations that are better than other nearby
solutions but do not provide a global optimum (the solution that provides the best
possible overall ÔfitÕ to the training data). For this reason the early training phase for a
learning (Elman, 1993). Further training, that involves additional or more complex
training patterns, will generally promote convergence to a nearby, locally optimal
configuration (relative to the previously established pattern of organization), that will
accommodate both the old and new data. However, this configuration will generally be
quite different from that of a network trained from scratch with the full and final
training set. In other words, an early phase of training on a sub-set of data, that
emphasizes some properties and not others, is likely to bias the eventual outcome of the
learning process.
Viewing the development of conceptual memory from this perspective would suggest a
parallel between the early phase of network learning and the establishment of memory
structures based on schematic relations. Later learning about taxonomic/functional
relations, or changes in the theoretical understanding of concepts, could add
considerable refinement and complexity to the pattern of organization without
necessarily effecting a major upheaval to its basic structure. A further implication is
that if, as Mandler (1983) has suggested, schematic relations "remain the predominant
form of organization throughout life" (p. 473), then adult conceptual memory may not
be optimally organized with respect to the representation of taxonomic relations. That
is, the super-imposition of taxonomic data on a substrate defined by schematic
relationships could lead to a degree of compromise in how effectively the taxonomic
relations are encoded.
Conclusion
In this article we have examined the development of semantic fluency between the ages
unexplored category of human body parts. The use of a hierarchical clustering
technique (additive tree analysis) revealed interesting patterns of both continuity and
change in childrenÕs conceptual structures. For the animals category we have
confirmed a tendency to cluster items by environmental context at all ages (resolving
some uncertainty particularly with regard to the behavior of the youngest age group
investigated). Thus, although there is a substantial increase in childrenÕs knowledge
over this age range, accompanied by a deepening understanding of biological kinds, this
pattern of memory acquisition could be described, following Eimas (1994, p. 85), as Òa
quantitative enrichment, and not a qualitative transformation of {...} early category
representation.Ó For the body parts category the analysis provided here suggests a
mixture of continuity and change that we have provisionally interpreted as showing a
primarily schematic organization modified by a growing functional understanding of
the body (and, in particular, its internal parts). Uniquely, for a study of hierarchical
clustering in the development of semantic fluency, these comparisons have been made
both within and across age groups and have used quantitative measures of addtree
similarity. Finally, we have suggested that the tendency of connectionist models to
retain their early organizational structure whilst adapting to represent more complex or
detailed information, could provide plausible models for understanding continuity and
Acknowledgements
The authors are grateful to the teachers and children of the Sacred Heart and
Hillsborough primary schools in Sheffield, UK, for their assistance in this study, and to
Rod Nicolson of the University of Sheffield, for his advice and guidance.
i
The probability distribution for ial /ijl is a discrete triangular distribution with
mean 0 and range /(nl /1) to -(nl/1). This distribution can be approximate by the
equivalent continuous triangular distribution (range Ðn to +n) which has a standard
deviation of 6n, and therefore increases linearly with n.
ii
Values of n(nalnbl) were calculated by (i) generating the relevant probability
distributions for different values of nal, and nbl, (ii) calculating the standard deviations
over a broad range of values for nl, and (iii) using linear regression to find a suitable
coefficient to estimate the standard deviation as a linear function of nl. Note, that a
linear approximation was found to produce a good fit to this data for nalnbl 6 .
iii
The set of possible values for Fab forms a standard hypergeometric distribution, for
which the expected value is given by the equation shown.
iv
In theory the standard deviation of the hypergeometric distribution could be used to
scale values of Cab, however, this has two drawbacks. First, we would still need to
ensure that the values of the scaled Cab fell within a bounded range. Second, as the
number of participants naming either item a or b approaches N (the size of the group),
the standard deviation of the distribution approaches 0, making it an unsuitable
scaling factor for items with very high production frequencies.
v
Additional analyses were also performed using c and d1 as separate metrics, the
results of these analyses were broadly consistent with the trends described here for the
vi
Uyeda and Mandler (1980) used a rating scale of 1 (high typicality) to 7 (low
typicality), hence the correlations with the production frequencies in the current study
are all negative.
vii
Note, the non-parametric Kruskal-Wallis test is used since many children in all age
groups named no non-mammals and consequently the distribution of ratios is highly
skewed. Values for H are after correction for ties.
viii
Internal organs were selected for this analysis because of the difficulty of defining
internal body parts. For instance, it is not clear whether parts of the mouth (teeth,
tongue, etc.) should count as internal or external. Gellert (1962) noted a similar
problem in her analysis of childrenÕs freelisting of things ÔinsideÕ the body.
ix
The division of a tree into k clusters is dependent on the choice of the root node of
the tree. The root node is usually selected to produce a balanced tree, and, in the case
of all the trees used in the current Bk analyses, one which minimizes the variance of
the distances from the root to the external nodes of the tree. However, other choices
for the root node are possible. Clearly, the choice of root node can effect the
computation of statistic the Bk statistic. However, experiments with alternative
choices of root node (that also produced reasonably balanced trees) showed only a
small effect on Bk for the comparisons reported here.
x
Fowlkes and Mallows (1983) state that these limits provide only an approximate
indication of the significance of Bk (i.e. it is not possible to specify a p value) since
the distribution of the measure is not normal and successive values are generally
Figure Legends
Figure 1. Addtree analyses of inter-item similarity data for animal terms using items,
for each year group, that were listed by at least 20% of the children in that group.
Figure 2. Top: Addtree analyses of inter-item similarity data for animal terms using
items, for all year groups, that were listed by at least 20% of the children in the year 1
group and co-occurred in all three year groups. Internal nodes are labeled according to
the number of clusters (k) formed when the tree is split below that node. Bottom:
Graphs of Bk (x-axis) vs. k (y-axis) for the comparisons, from left to right, year 1 with
year 3, year 1 with year 5, and year 3 with year 5. Values of Bk are indicated by diamond
symbols, while the plain solid line and the two dotted lines show the expected value
and its upper and lower limits for each value of Bk. Values of Bk that exceed the upper
limit can be considered significant.
Figure 3. Addtree analyses of inter-item similarity data for body parts using items, for
each year group, that were listed by at least 20% of the children in that group.
Figure 4. Top: Addtree analyses of inter-item similarity data for body parts using
items, for all year groups, that were listed by at least 20% of the children in the year 1
group and co-occurred in all three year groups. Bottom: Graphs of Bk for the
comparisons, from left to right, year 1 with year 3, year 1 with year 5, and year 3 with