This is a repository copy of Are You Used To It Yet? Braking Performance and Adaptation
in a Fixed-base Driving Simulator..
White Rose Research Online URL for this paper:
http://eprints.whiterose.ac.uk/3409/
Conference or Workshop Item:
Jamson, A.H. and Smith, P. (2003) Are You Used To It Yet? Braking Performance and
Adaptation in a Fixed-base Driving Simulator. In: Driving Simulation Conference North,
America (DSC-NA 2003)., 8th-10th October 2003, Dearborn, Detroit, Michigan.
[email protected] https://eprints.whiterose.ac.uk/
Reuse See Attached
Takedown
If you consider content in White Rose Research Online to be in breach of UK law, please notify us by
Universities of Leeds, Sheffield and York
http://eprints.whiterose.ac.uk/
Institute of Transport Studies
University of Leeds
This is an author produced version of a paper given at the Driving Simulation
Conference, North America. Please visit their website for more information:
http://www.nads-sc.uiowa.edu/dscna07/dscna_cd2003/
White Rose Repository URL for this paper:
http://eprints.whiterose.ac.uk/3409
Published paper
Jamson, A.H. and Smith P. (2003) Are You Used To It Yet? Braking Performance
and Adaptation in a Fixed-base Driving Simulator. Proceedings of the Driving
Simulation Conference North, America (DSC-NA 2003). Dearborn, Detroit,
Michigan. 8th-10th October 2003
ARE YOU USED TO IT YET? BRAKING PERFORMANCE AND ADAPTATION IN A FIXED BASE DRIVING SIMULATOR
HAMISH JAMSON
Institute for Transport Studies, University of Leeds,
Leeds, LS2 9JT. U.K.
T: +44 113 343 5730 F: +44 113 343 5334 E: [email protected]
PAUL SMITH, School of Psychology, University of Leeds, Leeds,
LS2 9JT. U.K.
T: +44 113 343 5756 F: +44 113 343 5749
ABSTRACT
During braking-to-stop manoeuvres in a fixed-base driving simulator, the paucity of visual and vestibular cues can lead to driver misperception and produce different patterns of braking response between real and simulated driving. For these reasons, drivers must adapt their behaviour in a simulator to affect a comfortable and efficient braking manoeuvre. Such behavioural adaptation is likely to have negative consequences by increasing a driver’s attentional demand. In this study, 48 participants underwent a series of braking-to-stop manoeuvres in an instrumented vehicle on a test-track. Each participant was instructed to drive at 40mph. A set of traffic lights, on occasions, changed to red as the vehicle was 58m from the lights. Deceleration profiles provided the baseline data. The same scenario was modelled in a fixed-base driving simulator. Two groups, each of 24 participants, one familiar with the simulator from previous investigations and one with no prior simulator experience, underwent the simulated traffic light scenario ten times. This paper suggests a method of objectively assessing driver braking performance between the real and simulated environments. Results appear to suggest that in as little as five or six practice stops drivers can adapt their simulator driving style to closely match that observed in a real vehicle on a test track. However, any process of adaptation from prior exposure to the simulator is short-lived.
INTRODUCTION
A fixed-based driving simulator cannot reproduce any of the inertial or vestibular cues that a driver intuitively expects. Consequently, when a driver applies the brakes of the simulated vehicle, a lack or misperception of deceleration cues can produce different patterns of braking response between real and simulated driving. Indeed, Boer et al. (2001) observed that during braking-to-stop manoeuvres on a test-track in a real vehicle, drivers adopted “nearly constant deceleration rates when intending to stop at a distant target”. However, in the same situation in a moving base driving simulator, deceleration profiles differed from the test-track, ranging “from saw-tooth to multi-modal profiles”.
In addition to the complete lack of acceleration perception, in a fixed-base simulator, Boer et al. (1) suggest that the mismatch in speed perception (2) and time to collision perception (3) explain the major differences in driving experience between simulation and reality. For these reasons, drivers must adapt their behaviour in the simulator to affect a comfortable and efficient braking manoeuvre. Such behavioural adaptation is likely to have negative consequences by increasing a driver’s attentional demand and hence workload.
Clearly, such findings have important implications for the efficacy of a driving simulator in the investigation of stopping behaviour. To attempt to overcome such observed differences between real and virtual driving, most simulator studies include a practice or training period, prior to experimentation, in order to allow a participant to become familiar with the simulator. Whether or not a participant has truly adapted their driving style to
compensate for the shortfalls in the simulation, or “learned” to drive the simulator, tends to be a subjective judgment. As McGehee et. al (4) point out, “objective measurements of adaptation and training to pre-determined criteria seem to lacking”.
Therefore, the main objective of the study was to develop an objective measure of assessing driver adaptation during braking in a fixed-base simulator. In addition, the study investigated whether drivers were able to adapt their braking strategy as they gain experience with a fixed-base simulator, whether prior simulator experience had any influence on the adaptation process and whether prior adaptation is short-lived.
METHOD
There were two main between-subject experimental factors under investigation, environment and simulator experience. Environment had two levels: participants drove either a
• Simulator: the Leeds Driving Simulator (fixed-base), or
• Test vehicle: an instrumented Ford Mondeo on the MIRA Ltd.’s Proving Ground. MIRA is the former Motor Industry Research Association, based near Birmingham in the U.K.
Simulator experience also had two levels: participants were either:
• Experienced with the prior simulator from previous investigations, or
Test Vehicle and Test Track
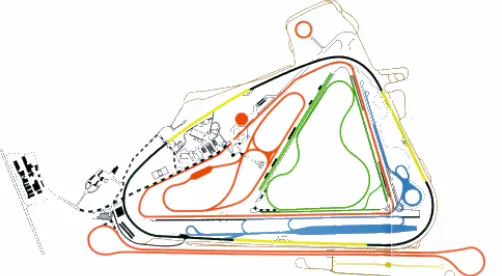
The test vehicle was a 1999 Ford Mondeo, driven on the MIRA Handling and Stability Proving Ground (Figure 1). The test track was an omni-directional, extended figure of eight track often used for vehicle testing and had constant radii bends ranging from 55m to 1000m. Each lap of the circuit was around 3km in length and took around two minutes to negotiate.
FIGURE1 The MIRA Dunlop Handling and Stability Proving Ground (red circuit)
On the test track, 48 participants, balanced for age (half under 35, half over 35) and gender underwent a series of braking-to-stop manoeuvres in the test vehicle. Each participant was instructed to drive at 40mph in the vicinity of a set of traffic lights that were located at a fixed position on the track. On two of nine laps, the lights changed to red as the centre of gravity of the vehicle was 58m from stop line of the lights and participants were required to stop at a yellow stop line, adjacent to the traffic lights. Deceleration profiles for the second of the two stops provided the test track baseline braking performance. Only one driving speed was used as time on the Proving Ground was limited and hence constrained the design of the study.
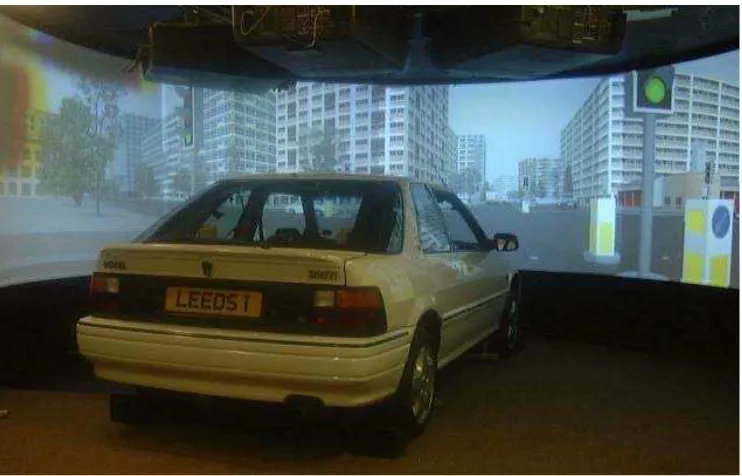
Driving Simulator and Braking Scenarios
The same scenario was modelled in the driving simulator (Figure 2). The two groups of simulator experience, each of 24 participants, underwent the simulated traffic light scenario on ten separate exposures. The simulated traffic lights would only changed to red on 50% of occasions and if the simulator driver was within ±3mph of the required 40mph driving speed. Drivers were instructed as follows:
[image:5.595.172.423.158.296.2]“The second practice session will involve driving in a rural environment with no other traffic. You will notice speed limit signs by the side of the road. These denote the speed that we would like you to drive at. Every now and then you will notice a set of traffic lights. As you approach them, some may change from green straight to red. If this does happen, please brake and stop the simulator at the yellow stop line on the road. Please stop at the line as you would at a normal traffic light.”
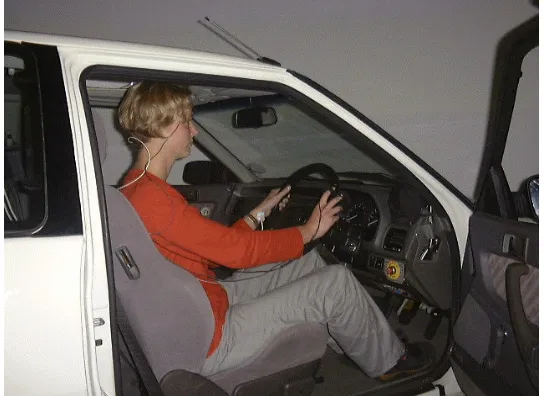
The Leeds Driving Simulator (Figure 3) is currently based on a complete Rover 216GTi with all of its basic controls and dashboard instrumentation still fully operational. On a 2.5m radius, cylindrical screen in front of the driver is projected a real-time, fully textured and anti-aliased, 3-D graphical scene of the virtual world. This
scene is generated by a SGI Onyx2 Infinite Reality2graphical workstation. The frame rate is a fixed to a constant
60Hz. A Roland digital sound sampler creates realistic sounds of engine and other noises via two speakers mounted close to each forward road wheel. Although the simulator is fixed-base, feedback is given by steering torques and speeds at the steering wheel. Data are collected at 60Hz and includes information of the behaviour of the driver (i.e. driver controls), that of the car (position, speed, accelerations etc.) and other autonomous
[image:6.595.113.484.184.422.2]vehicles in the scene (e.g. identity, position, speed).
FIGURE 3 The Leeds Driving Simulator
Prior to the study, the physical validity of the Driving Simulator’s vehicle dynamics model had to be assessed. Most automobiles are controlled by the forces developed in just four, small, hand-sized patches, where each tyre contacts the road surface. The dynamics model of the Driving Simulator had to reflect this.
Initially, a non-real time version of the vehicle model was modelled using The University of Michigan
Transportation Research Institute’s CarSim software (http://www.carsim.com). CarSim is itself completely
validated against the industry standard ADAMS software package (Automatic Dynamic Analysis of Multibody Systems, 5). Once the non-real time model accurately replicated the longitudinal performance of the Mondeo instrumented vehicle, a real time equivalent was written for the Driving Simulator.
The real-time dynamics model was based on Newtonian mechanics and represented mathematically by 36 ordinary differential equations of motion, built up from first principles. The model was parameterised, in order to describe the braking and handling behaviour of a generic, four wheeled motor vehicle with independent suspension (6). An empirical tyre model was used (7) and tyre longitudinal and lateral slip angles were calculated at low speeds using Bernard and Clover’s (8) state variable method.
0 0.2 0.4 0.6 0.8 1 1.2
0 100 200 300 400 500 600 700 800 900 1000
Brake Pedal Effort (N)
D
ecelerat
io
n
(
g
)
[image:7.595.134.466.75.256.2]Mondeo (full brakes) Simulation (full brakes)
FIGURE 4 Vehicle dynamic performance in braking
Data Collection
In the Simulator (60Hz) and the test vehicle on the Proving Ground (200Hz), the following measures were recorded:
• Brake line pressure (bar)
• Brake pedal effort (N)
• Brake pedal travel (mm)
• Longitudinal speed (m/s)
The following psychophysiological measures were recorded:
• Heart rate (ECG or HR) was measured from Ag/AgCl electrodes (Grass®) attached to the inside wrists
of both hands and the ankle of the right leg and amplified by a BioPac® ECG106C amplifier using a
gain of 500 and a 0.5Hz high pass filter.
• Skin conductance (EDA) was recorded using electrodes attached to the palmar surface of the middle
phlanges of the second and third fingers of the right hand.
As both the Biopac and data logger had independent measures of real time, it was necessary to provide some input at the same instance to both recorders to enable a concurrent time line. On the Proving Ground, this was provided by a radio signal as the vehicle passed a particular point. In the simulator, a signal was passed to the BioPac on the first frame of the simulation. Figure 5 shows a driver in the Driving Simulator with the psychophysiological measuring equipment attached.
[image:7.595.162.434.537.735.2]RESULTS
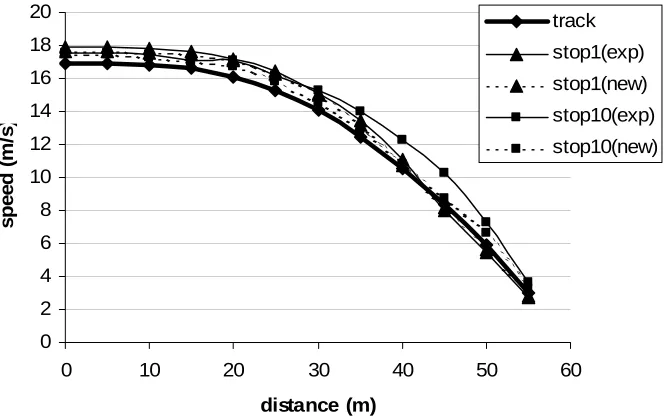
[image:8.595.130.462.205.414.2]Speed v Distance
Figure 6 shows the speed v distance plots for test vehicle drivers and both naive and experienced simulator drivers during their first and last of the ten braking manoeuvres. A between-subjects ANOVA was performed with driving speed as the dependent variable speed at 5m intervals throughout the 58m of the stop. Driving environment, simulator exposure and experience made up 21 levels of a single experimental factor. Neither effects of simulator exposure nor simulator experience were discovered. Only the first and tenth stop are shown for clarity. 0 2 4 6 8 10 12 14 16 18 20
0 10 20 30 40 50 60
distance (m) sp e ed ( m /s ) track stop1(exp) stop1(new) stop10(exp) stop10(new)
FIGURE 6 speed / distance plot for real and simulated braking events
Area under speed / distance plot
[image:8.595.131.473.530.725.2]The area under the speed distance plot was also measured and used as a dependent variable describing braking performance for the test vehicle and each of the ten simulated stops. Figure 7 shows a selection of these data, which, similar to the speed distance profiles, failed to be sensitive to simulator exposure or experience.
FIGURE 7 area under speed/distance plot for real and simulated braking (with standard error bars) 0 100 200 300 400 500 600 700 800 900 1000
exp new exp new exp new exp new
track 1st 2nd 9th 10th
area under speed/distance plo
Multiple Regression
Boer et al. (1), refer to naïve simulator drivers’ braking as often “multi-modal”, in that brakes are applied, then released, then applied again during a simulated stop. As neither speed/distance plots, not area under the curve proved to be sensitive measurements, in order to objectively assess the similarity of drivers simulated and real braking profiles, a polynomial model was applied to each drivers stopping profile using multiple regression
techniques. Using the value of R2 as the dependent variable in a one-way ANOVA, the similarity of the braking
profiles could be assessed. In essence, the modality of the braking profiles could be measured in an objective manner.
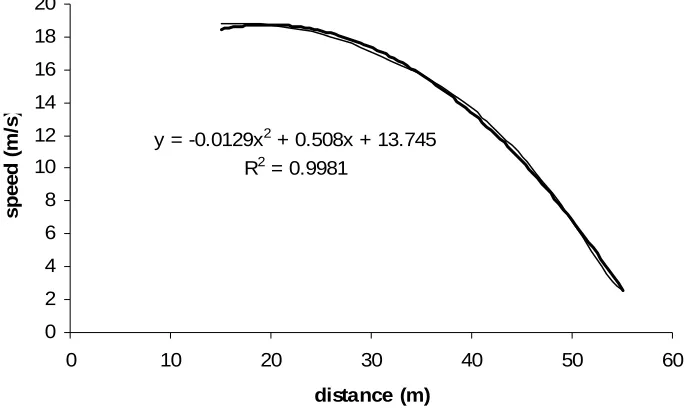
As an example, the dashed line of figure 8 shows the first simulated stop of one of the expert drivers from the initiation of braking until a point 3m prior to the stop line of the traffic light. The solid line shows a quadratic
curve fit of a polynomial model applied to the stopping profile. The parameters of the model and the value of R2
of the non-linear trendline are also shown. The same technique of curve estimation from initial braking was
performed for all drivers in all real and simulated stopping manoeuvres. Values of R2, 0 (the y-axis intercept,
13.745 as shown in figure 8), 1 (the linear term, 0.508 as shown in figure 8) and 2 (the quadratic term, -0.0129
as shown in figure 8) were recorded.
y = -0.0129x2 + 0.508x + 13.745 R2 = 0.9981
0 2 4 6 8 10 12 14 16 18 20
0 10 20 30 40 50 6
distance (m) s p eed ( m /s 0 )
[image:9.595.128.471.289.495.2]FIGURE 8 polynomial model of speed / distance
Figure 9 shows the value of R2 for each braking manoeuvre for each driver compared to the track performance.
Post-hoc tests (Tukey HSD) showed that for the experienced simulator drivers, R2 was significantly higher on
test track than during each of their first four simulated stops (stop1, p<0.001; stop2, p<0.001; track-stop3, p<0.05; track-stop4, p<0.05). From their fifth stop onwards, the experienced drivers’ stopping profiles were not significantly different from the track performance (track-stop5, p=0.92; track-stop6, p=1.0, track-stop7, p=0.85, track-stop8, p=1.0, track-stop9, p=0.98, track-stop10, p=1.0).
Similar post-hoc tests showed similar results for the naive simulator drivers. For the first three stops, R2 was
0.94 0.95 0.96 0.97 0.98 0.99 1
exp new exp new exp new exp new exp new exp new exp new exp new exp new exp new
[image:10.595.136.463.81.279.2]track 1st 2nd 3rd 4th 5th 6th 7th 8th 9th 10th
FIGURE 9 values of R2 for polynomial fit of real and simulated braking (with standard error bars)
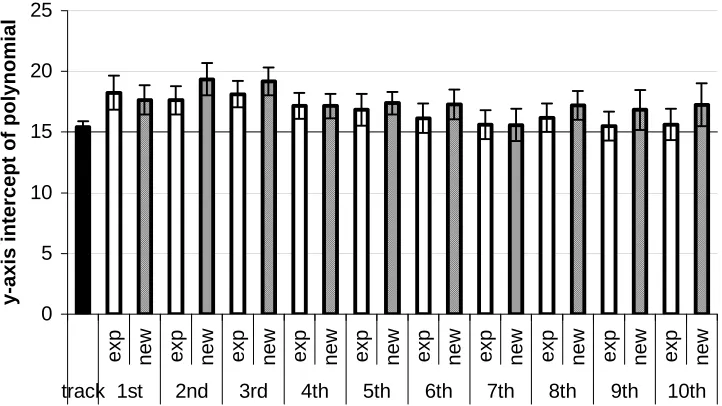
A similar analysis was performed using the value of the intercept of the polynomial braking model. This showed
less sensitivity than the R2 value as no significant differences were shown. However, the same trend existed
suggesting around five or six stops were required before this value approached that as observed on the test track.
Similar results were also apparent for 1 (the linear) and 2 (the quadratic) terms of the speed / distance
polynomial model. However for these terms, experienced simulator drivers were generally more consistent in
the braking performance and showed less variability in their value of 1 and 2.
0 5 10 15 20 25
exp new exp new exp new exp new exp new exp new exp new exp new exp new exp new
track 1st 2nd 3rd 4th 5th 6th 7th 8th 9th 10th
y-axis intercept of polynomial
[image:10.595.121.482.427.630.2]CONCLUSIONS
Affording realistic stopping behaviour in a fixed-base driving simulator is notoriously difficult. Speed and distance cues can be misperceived, vestibular cues are non-existent and the overall experience for a driver in the simulator can be very different than that which they are used to from real-world experiences. Boer et al. (1) propose a proportional controller as a model for explaining the different deceleration profiles exhibited by drivers in a real and virtual driving environment. The model suggests that drivers will only be able to adapt to braking in a simulator if there is a relationship between their misperceptions of distance, speed and acceleration. Boer et al. (1) go on to suggest that “it appears to be a waste of resources to develop a high-end motion base without the corresponding visual and auditory cues to support it perceptually and vice versa.” The Leeds Driving Simulator is a fixed-base simulator that falls into this category: visual and audio cues are good quality, however vestibular cues are lacking.
This paper presents an objective method of assessing driver braking performance in a fixed base simulator for large numbers of participants. The method can be used during simulator training and participant familiarisation to assess the degree to which a driver has adapted their driving style to overcome a simulator’s paucity of visual, auditory and vestibular cues. In other words, to objectively assess whether a driver are truly become “used” to the simulator.
The study appears to show that during repeated simulated braking scenarios in a fixed-base simulator, in as little as five or six practice stops drivers can adapt their simulator driving style to closely match that observed in a real vehicle on a test track. However, it also appears that any process of adaptation from prior exposure to the simulator is short-lived, since the group of experienced simulator drivers did not perform significantly better than the group of naive drivers.
Whilst these results are promising in terms of the ability of even a fixed-base simulator to extract realistic driver performance, it raises many questions. Globally, many driving simulators are used, traditionally in the areas of driver behavioural research and driver training. Whilst the number of facilities continues to grow, as yet no standardised technique exists to assess driving simulator validity. The Joint Aviation Authority and Federal Aviation Authority, with degrees of regulation, tightly control the flight simulation market, but the same is not true in the driving domain. As the quantity of and potential for driving simulators expands, the need for a standardised approach to their validation becomes ever more important. Research programmes are required to better understand how mis-percpetion of distance, speed and acceleration cues affect simulator driver
performance and how manipulation of these cues can best afford realistic driver behaviour. In the longer term, standard driving simulator benchmark validation tests are required, taken for granted in the domain of flight simulation.
REFERENCES
Boer, E.R., Girshik, A.R, Yamamura, T. Affording Realistic Stopping Behaviour: a Cardinal Challenge for Driving Simulation. Proceeding of the First Human Centred Transportation Simulation Conference, 4th-7th November 2001, Iowa City, Iowa.
Sidaway, B., Fairweather H., Sekiya, H. and McNitt-Gray, J. “Time-to-Collision” Estimation in a Simulated
Driving Task. Human Factors Vol. 38, No.1, pp101-113, 1996.
Cavallo, V., Mestre D. and Berthelon, C. Time-to-Collision Judgements: Visual and Spatio-Temporal Factors, in Rothengatter, J.A., Carbonell Vaya, E,, (Eds.), Traffic and Transport Psychology: Theory and Application, Pergamon Press, 1997
McGehee, D.V., Lee, J.D., Rizzo, M. and Bateman, K. Examination of Older Driver Steering Adaptation on a High Performance Driving Simulator. Proceedings of the First International Driving Symposium on Human Factors in Driver Assessment, Training and Vehicle Design. Aspen, CO. pp 197-201.
Sayers, M.W. and Han, D.S. A Generic Multibody Vehicle Model for Simulating Handling and Braking. Vehicle System Dynamics, Vol. 25, 1996.
Pacjeka, H.A and Sharp, R.S. Shear Force Development by Pneumatic Tyres in Steady State Conditions: A Review of Modelling Aspects. Vehicle System Dynamics, Vol.20, pp121-176, 1991