Article
Input/Output Linearization for a Real-Time pH
Control: Application on Basic Wastewater
Neutralization by Carbon Dioxide in a Fed-Batch
Bubble Column Reactor
Chanin Panjapornpon
1,2,*, Pawat Saksomboon
1,2, Kittayot Juyteiy
1,2,
and Jedsada Chinprasit
1,21 Department of Chemical Engineering, Center of Excellence on Petrochemicals and Materials Technology,
Faculty of Engineering, Kasetsart University, Bangkok 10900, Thailand
2 The Center for Advanced Studies in Industrial Technology, Kasetsart University, Thailand
*E-mail: [email protected](Corresponding author)
Abstract. A model-based application for pH regulation in a pilot unit of wastewater
treatment by carbon dioxide gas is presented. A reactor pH is an important factor to enhance the gas absorption of carbon dioxide bubbles in an alkaline wastewater, and it needs to operate within a tight pH range. Under a fed-batch operation mode, the reactor behavior has unstable dynamics resulting in a difficulty to achieve the pH target by manipulating the basic influent feed rate. To solve the problem, an input/output (I/O) linearization is applied because it provides excellent the setpoint trackability with a few numbers of tuning parameters required. The first principles approach is employed for reactor modeling. The model is then used in the I/O feedback formulation. Control performance is evaluated through a real-time implementation to track the desired pH target in comparison with a two-degree-of-freedom control scheme used as a compared case. The developed control system proficiently forces the output to the pH target and also improves the control performances.
Keywords: Carbon dioxide utilization, I/O feedback, eco pH regulation, physical model,
CO2 for pH treatment, fed-batch operation.
ENGINEERING JOURNAL Volume 23 Issue 5
1.
Introduction
The rapid growth of process industries in past decades significantly induces plenty of carbon dioxide released into the air. Utilization of carbon dioxide is an interesting technology for the industry to obtain the benefit from such waste, and it effectively reduces the carbon dioxide emission as well. A wastewater neutralization by a waste carbon dioxide is one of the attractive carbon dioxide utilization technologies that receive much attention due to much safer, effective waste management and environment friendly in comparison with the sulfuric acid [1, 2]. Wastewater from industries is usually contaminated by base substances; for example, wastewaters from paper mill, cement and beverage industries. Their wastewater is reported to have pH in a range from 7.5 to 12. The wastes require to be neutralized before releasing to an environment [3].
A base wastewater treatment by carbon dioxide is in a gas-liquid reaction. A bubble column is a good candidate of a reactor for taking the place of the gas-liquid reaction due to the ability of solid management from upstream, high mass transfer coefficient and low operating cost[4]. The bubble column reactor could run in both fed-batch [5] and continuous modes [6]. The reactor dynamics of a studied carbon dioxide-hydroxide system are inherently nonlinear due to complexities in the reactions and kinetics. The carbon dioxide absorption rate into the liquid is affected by the operating pH. When the pH is too low, the kinetic rate between carbon dioxide and hydroxide ion is slowed. A lower operating pH could lead to a less carbon dioxide conversion while a higher operating pH could violate the maximum pH allowance of the effluent wastewater. There are many control techniques reported for controlling a pH process. For instance, advanced control techniques are a PID controller integrated with a sliding mode concept [7], a gain scheduling/autotuning gain-scheduling PID controller [8-11] or a modified PI controller with multi-model switching of strong acid equivalent [12], an input/output feedback with an iterative parametric estimator [13], a global linearizing controllers with the state-space model and ion neuralization balance [14, 15], and a Weiner-based predictive control that the predicted trajectory is recursively linearized to guarantee the solution [16, 17]. The studies mentioned above are the liquid pH control, but a study of pH adjustment in a fed-batch, gas-liquid system is not found.
Therefore, the model-based design of pH control for a CO2 based wastewater neutralization in the
bubble column is presented. The objective is to regulate the pH setpoint in between pH 7 to pH 9 by adjusting an influent feed rate under a fed-batch mode. The fed-batch operation provides a high conversion per unit volume, efficiency in product quality control, and low costs in both construction and operation. A first principle, lumped model and a two-film theory are used for explaining dissolution of CO2 gas into the
liquid and predicting reactor dynamics. In the proposed control structure, a pH feedback controller is formulated by a concept of input/output linearization. The I/O linearization provides an excellent control performance to handle system nonlinearity with few tuning parameters required. To reject the output offset by the process-model mismatch, A setpoint compensating integrator is added into the designed control structure. A two degree of freedom (2DOF) input/output feedback is used for comparing the performances during the start-up and under setpoint tracking test.
2.
Modeling of
Carbon Dioxide-Based pH Treatment System
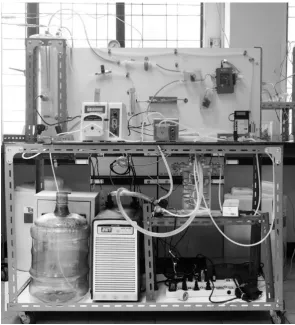
Experiments of the carbon dioxide-based pH treatment were studied in a bench-scale, fed-batch bubble column reactor in the Model-based Control Laboratory at Kasetsart University. The equipment setup and its schematic diagram are shown in Fig. 1 and Fig. 2. The bubble column dimensions have an 8-cm diameter with 50-cm height, and the operating column volume is 2.5 L. The mixed gas feeds into the gas line with 11 cm above the bottom column reactor. The carbon dioxide sensor is installed at the gas outlet line of the top column. At the top column, a solution of 0.2 M sodium hydroxide ( ) assumed to be the influent water is added. The reactor is initially filled up with 1.5 L of the influent feed. A 20 % CO2 mixed
gas is continuously fed through the submerged gas diffuser in the bubble reactor. At the bottom of the reactor, the liquid from the reactor is circulated through a heat exchanger to maintain the temperature at 25–27 C. The pressure sensor, pH probe, ultrasonic sensor for level measurement and are installed at 5 cm, 20 cm and 20 cm above the column bottom, respectively. The reactor pH is controlled by adjusting the influent feed rate.
To simplify and model the bench-scale pH reactor, these given assumptions are applied: - The resistance to gas-phase mass transfer is neglected because of the gas bubble bound.
- The concentration of the vapor phase is assumed to follow the ideal gas law. - A film model is used for estimating the liquid-phase CO2 mass transfer.
- The well-mixed bulk liquid is assumed. Therefore, the state variables are considered to change by time only.
- The reactor has a small operating volume with the short vertical liquid distance. Thus, the gas bubble diameter is assumed to be constant.
- Mass transfer of the carbon dioxide into the liquid bulk is driven by the differences in the gas partial pressure and the interface concentration.
- The interface concentration of carbon dioxide in both phases is in equilibrium and estimated by Henry’s law.
2.1. Overall Mass Balance of Liquid in the Reactor
(1)
where is the mass of the reactor liquid; is the volume of the liquid; is the influent density assumed to be equal to the reactor liquid; is the influent volumetric rate; is the carbon dioxide molecular weight equal to 44.01 g/mole. is the CO2 molar mass transfer rate that is defined by Eq. (2)
that is formulated by a flux balance through the gas/liquid interfacial film at steady-state condition.
(2)
where is the CO2 partial pressure in equilibrium with its bulk liquid concentration; is the
volumetric mass transfer coefficient of carbon dioxide absorption into the liquid bulk; is an enhancement factor; and are Henry’s law constant and CO2 concentration, respectively. The
liquid density can express as a function of the high liquid ( ) and the hydrostatic pressure of the liquid in the column ( ) as follows:
(3)
The enhancement factor in this work is set to one because the operating pH is moderately high. The enhancement of the film reaction is not dominant, and it can be neglected [7]. An empirical relation equation of the volumetric mass transfer coefficient based on [18] fitting with our experiment is applied; which the relation is presented as follows:
(4)
where is the gas velocity and is the surface tension.
2
2
,
,
L
i a w CO
L
i a w CO dm
F N M dt
d V
F N M dt
L
m
V
L i
F Mw CO, 2
a
N
2
2 2
C
a l
CO O
L CO
p k a C N
H V
2
CO
p k al
E
2
CO
H CCO2
h
P
P gh
2300
ln(k al ) 11.43 0.796ln( ) 0.634 ln( )ug T
g
Fig. 1. An experimental unit of a basic wastewater neuralization by carbon dioxide.
[image:4.595.176.472.77.403.2] [image:4.595.166.433.460.710.2]2.2. Component Balances in the Liquid Bulk
The absorption of carbon dioxide-sodium hydroxide aqueous occurs with the following reactions [6, 18-22]:
(5) (6) (7)
(8)
The reaction rate of Eq. (5) and the rate constant (L/mol⋅s) as a function of the ionic strength ( ) are described by Eqs. (9a)-(9d):
(9a) (9b)
(9c)
(9d)
where is the ionic charge number. The behavior of the reaction in Eq. (6)is first order with the rate of reaction as shown in Eq. (10)
(10a)
(10b)
An equilibrium reaction in Eq. (7) has a rate constant referred to [17], which the relation is shown in Eqs. (11a) and (11b)
(11a)
(11b)
The kinetic rates in Eqs. (12) and (13) are given for the reactions in Eqs. (7) and (8), respectively.
(12) (13)
Thus, the component balances of each species in the liquid can be described as follows
The carbon dioxide in the liquid:
(14)
1
2 3
k
CO OH HCO
2
2 2 3
k
CO H O HCO H
3 32
32
/ 2
3 3 2
K k k
HCO OH CO H O
1 1 2 w w w k K k
H OH H O
1
k
I
21 1 OH CO
r k C C
2
1 1
logk logk 0.20I 0.0182I
1
2985
logk 13.635
T
21 1 2 n i i i
I C Z
Z
2
2 2 CO
r
k C
2 2 4
2
1.7265 10 logk 3.298 10 1.1054 10 log( )T
T 3 3 1.01
log log 0.125 1 1.27
Na
Na Na
C
K K C
C
1 3
3
1568.94
logK 4.134 10 6.737 10 T
T
- 2
3 3
3 32( 3 OH HCO CO )
r k K C C C
3
4 w1( OH HCO w)
r k C C K
The bicarbonate ion in the liquid:
(15)
The hydroxideion in the liquid :
(16)
The proton ion in the liquid :
(17)
The carbonate ion in the liquid:
(18)
The Sodium ion in the liquid:
(19)
The kinetic correlations for the studied reactions in Eqs. (7) and (8) are given in Table 1.
Table 1. Correlated kinetic parameters of the reactions in Eqs. (7) and (8)
Symbol Quantity Value
Rate constant [23] Rate constant [24]
Equilibrium constant of water
2.3. The Energy Conservation Equation in the Bench-Scale Reactor
The energy conservation equation in the reactor can be derived as follows:
(20)
where Ti, Tg , T, and Tc are the temperature of the influent feed, influent gas, the reactor liquid, and the
water coolant, respectively; and are the heat of the reaction and the rate of ithreaction; and is
the coolant flow rate. The liquid heat capacity ( ) is assumed equal to the heat capacity of water. The overall energy balance of the water coolant is as follows:
(21)
where is the overall heat-transfer coefficient; is the cooling tube length; is the outside tube radius of the cooling system; and is the cooling bath temperature.
3.
Model-Based Control Strategy
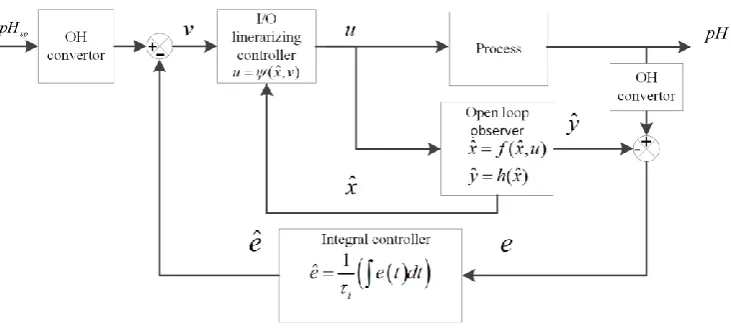
A developed control diagram is illustrated by Fig. 3. It consists of an input/output feedback controller combined with the model-error integrator to handle the process/model mismatch. More explanations of the control system are provided in the following subsections.
3
1 2 3
HCO dC
r r r dt
1 3 4
OH i i
L dC F C
r r r dt V
2 4
H dC r r dt 2 3 3 CO dC r dt Na i i
L dC F C dt V
32
k 1.22 10 6s1
1
w
k 1.40 10 11 m mol3 1
w
K 1 10 14 mol m2 6
2 4 , 11 ( )
i
i p i c L p C r i L a w CO p g i
p
dT F c T T F c T T H r V N M c T T dt mc
i r
H ri Fc
p c
1 2 2
C
C L p C C o C HX
C p o
dT
F c T T UL r T T
dt L c r
U LC ro
HX
[image:6.595.144.451.369.433.2]Fig. 3. A diagram of the developed control structure.
3.1. I/O Linearizing Feedback
In this section, the concept of input/output linearization is concisely described. Consider a process that its dynamics are in a form:
(22)
where , , and are the input vector, the state vector, and the output vector respectively, and f, h are the smooth functions. The relative orders of the controlled outputs,
with respect to the inputs, are denoted by where ri is the smallest integer that the
function depends on the inputs. The following representation is applied:
(23)
Let prescribe the output responses of the system in Eq. (22) under closed-loop control in following trajectories (24) ( ( ), ( )) ( ( )) dx
f x t u t dt
y h x t
m
u R x R n y R m
1,..., m,
y y
1,..., ,m
u u r1,..., ,rm
/
i i
r r
i d y dt
1 1 2 1 1 1 ( ) ( , ) ( ) ( , ) ( ) ( , ) ( , ) r r r r r r r r
y h x dy h
f x u h x dt x
d y h f x u h x dt x
d y h f x u h x u dt x
11 1 ,1
, 1 1 m r sp r
m m sp m
y v
[image:7.595.124.490.89.254.2]where , , are the differential operator, the output setpoint and the response tuning
parameter for the output speed, respectively. With the definition in Eq. (23), the prescribed responses can be presented as follows:
(25)
The input/output linearizing feedback is achieved by solving Eq. (25) for the manipulated input (u), and its compact form can be represented as follows:
(26)
3.2. Control System
The I/O feedback needs the state information to calculate the control action. The open-loop state observer presented in Eq.(27) is used for estimating state values
(27)
Theintegratorin Eq. (28) is included in the control system to reject the output offset from the model discrepancy.
(28)
By combining Eqs. (26)–(28), the developed control system can be summarized by the following equation set
(29)
3.3. Controller System: Application to the Bench-Scale pH Treatment Unit
In the setup of the bench-scale unit, the pH of the reactor liquid (output mapping to hydroxide ion, ) is controlled by varying the influent feed ( ). The process output has a relative degree one. Therefore, the controller system in Eq. (28) for the fed-batch pH treatment process is described as follows:
d dt vsp
1 1
1 1 1
1 1 1 1 1 ,1
1
1
,
( ) ( ) ( , )
1
( ) ( ) ( , )
1
m m
r r
sp
m m r r
m m m m m sp m
m
r r
h x h x h x u v r
r r
h x h x h x u v r
( , )ˆ
u x v
ˆ ( , )ˆ
ˆ ( )ˆ
x f x u y h x
ˆ 1 ˆ
i e y y
e e t dt
ˆ ( , )ˆ
ˆ ( )ˆ ˆ ˆ ( , )
sp x f x u
y h x v y e u x v
(30)
4.
Results and Discussion
4.1.
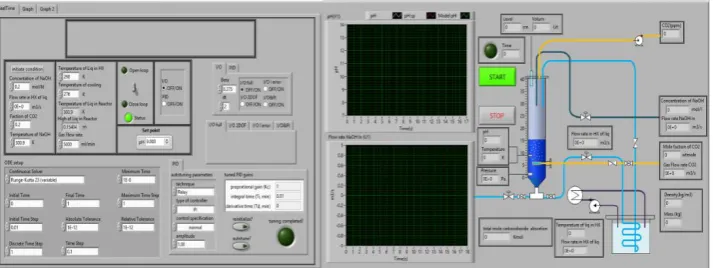
Setup of the Bench-Scale pH Treatment UnitTo implement the real-time control with the bench-scale reactor, the controller in Eq. (30) is coded by LabVIEW software and then implemented into a controller device (NI myRIO-1900, National Instruments). The NI myRIO contains the field programmable gate array (FPGA) that improves a data acquisition speed. This embedded controller supports for accessing and operating from the internet. Monitoring control response and adjusting tuning parameters can perform on the windows interface, shown in Fig. 4.
For the sensor instruments and hardware, an ultrasonic sensor (a 0–10V analog signal representing a level of span 0.2–0.8 m) is used to detect the solution level in the column while the pressure sensor (a 0–10 V representing 0–0.3 bar pressure signal) is detected a hydrostatic pressure of the solution. The liquid pH is controlled by varying the influent feed (a pump range of 1–600 RPM corresponding to the feed flow rate 0–2.4 mL/sec).
Fig. 4. Window interface displaying information of the bubble column reactor for a wastewater neutralization by carbon dioxide; (a) a control interface and (b) monitoring interface.
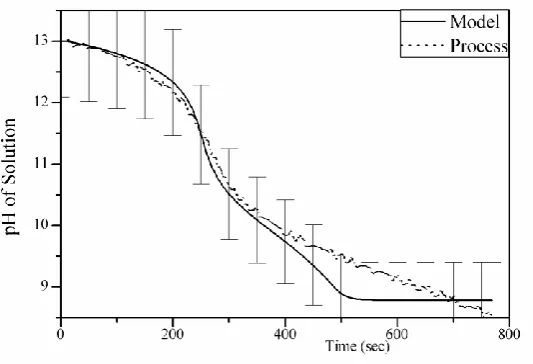
[image:9.595.129.523.76.263.2]4.2. Model Validation
Figure 5 illustrates a test of the model prediction quality where data from a real-time open loop experiment are in comparison with the simulation data from the developed mathematical model. The developed model shows good agreement to track the experimental results in real-time within the maximum error of 5 %.
14
14 ,
,
1 3 4
10
10 ˆ
1 ˆ
ˆ ˆ
sp
pH OH
pH OH sp
OH OH
i
sp OH
OH
L
i
C
C
e C C
e e t dt
v C e
v C
r r r V u
C
[image:9.595.120.477.460.594.2]Fig. 5. Comparison of the model prediction and measured pH solution with 5% error bar from the measurement.
4.3. Performance Test
To evaluate the effectiveness of the developed control strategy, two test cases which are the closed-loop control during start-up and the setpoint tracking test are studied with the 2DOF I/O linearizing controller in [25] as a compare method. In both tests, the process begins at the conditions: h(0) = 17 cm, pH(0)=13; Temperature of the reactor liquid and the water coolant are 27.9 °C and 3 °C, respectively. The flow rate of
the mixed carbon dioxide gas stream is 1 L/min with 20%v/v carbon dioxide concentration. The I/O feedback tuning parameter ( ) is set to 15 s; which is an open-loop time constant of the process.
4.3.1. Closed-loop performance
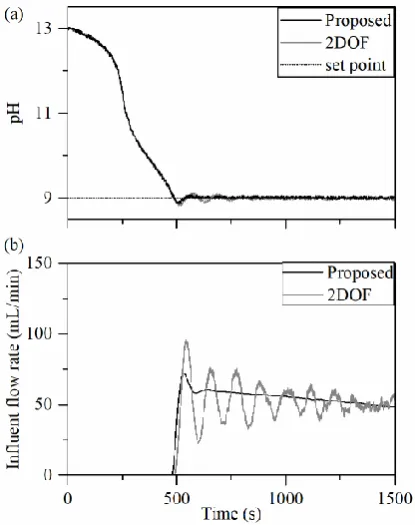
The proposed controller has a real time testing with the pH treatment unit during the start-up period. The bench-scale unit operates in the fed-batch mode. Figure 6 shows the results of the process responses under the proposed and 2DOF methods. From the figure, the proposed method effectively carries out the reactor pH to the desired setpoint (pH = 9) as well as the 2DOF controller. The proposed and the 2DOF controllers are the observer-based controllers which their responses will not directly affect by the presence of noise in the measured output signal. However, the pH output and the manipulated input under the proposed controller has less oscillation than the 2DOF controller.
4.3.2. Performance of the set point tracking test
Figure 7 shows the process responses for the setpoint tracking under both controllers. The set point is stepped from pH 9 to 9.1 at 1000 seconds. The pH responses under the proposed method effectively track both desired pH set points with fewer oscillations in the output and control action compared with the 2DOF controller. Table 2 shows the performance indexes of the proposed and the 2DOF methods. The integral squared error (ISE) index is 2.51 for the 2DOF method and 0.45 for the proposed one. The percent overshoot of the 2DOF and proposed are 1.66 and 0.79 % respectively. The proposed method provides better performances compared with the 2DOF controllers in overall.
5.
Conclusion
The control methods with the integrator controller were proposed to handle the pH neutralization in the fed-batch bubble column reactor by adjusting the influent flow rate. The input/output linearization is used in a formulation of the proposed control method. The proposed method was developed based on the lumped parameter reactor model and the two-film theory. The input/output feedback to track the setpoint target, the open observer to provide state information, and the error integrator to eliminate the output
[image:10.595.173.440.84.266.2]offset are integrated into the developed control structure. The developed method was tested and investigated through real-time implementation by comparing with the two-degree-of-freedom, I/O linearizing controller. In real-time tests, it enforces the output to the target pH effectively. The experimental results supported that the input/output feedback with the integrator can reduce accumulation of error and it delivers better control efficiencies over the two-degree-of-freedom I/O linearizing controller as illustrated in Table 2.
[image:11.595.204.412.167.430.2]Table 2. Closed-loop performance under setpoint tracking test.
Controller Percent overshoot [%] Performance index ISE
2DOF 1.65 2.51
Proposed 0.79 0.45
Acknowledgments
The authors would like to acknowledge the financial research support from the Faculty of Engineering, Kasetsart University (Grant No. 61/09/CHEM-M-ENG); the Institutional Research Fund Grant (Thailand Research Fund) (IRG5980004); and the Center of Excellence on Petrochemical and Materials Technology.
Reference
[1] C. Song, “Global challenges and strategies for control, conversion and utilization of CO2 for
sustainable development involving energy, catalysis, adsorption and chemical processing,” Catalysis
Today, vol. 115, no .1, pp. 2-32, Jun. 2006.
[2] R. S. Norhasyima and T. M. I. Mahlia, “Advances in CO₂ utilization technology: A patent landscape review,” Journal of CO2 Utilization, vol. 26, pp. 323-335, Jul. 2018.
[3] N. M. Kulshreshtha, A. Kumar, P. Dhall, S. Gupta, G. Bisht, S. Pasha, V. P. Singh, and R. Kumar, “Neutralization of alkaline industrial wastewaters using Exiguobacterium sp.,” International
Biodeterioration & Biodegradation, vol. 64, no. 3, pp. 191-196, Jun. 2010.
[4] N. Kantarci, F. Borak, and K. O. Ulgen, “Bubble column reactors,” Process Biochemistry, vol. 40, no. 7, pp. 2263-2283, Jun. 2005.
[5] Z. K. Nagy and P. Ş. Agachi, “Model based control of chemical processes: Case studies,” Presa Universitară Clujeană, 2004.
[6] J. K. Stolaroff, D. W. Keith, and G. V. Lowry, “Carbon dioxide capture from atmospheric air using sodium hydroxide spray,” Environmental Science & Technology, vol. 42, no. 8, pp. 2728-2735, Feb. 2008. [7] M. Li. , F. Wang, and F. Gao, “PID-based sliding mode controller for nonlinear processes,” Industrial
& Engineering Chemistry Research, vol. 40, no. 12, pp. 2660-2667, Jun. 2001.
[8] S. E. Hurowitz, A. Bobkov, and J. B. Riggs, “pH control using advanced proportional−integral controls with the dual-injection in-line process,” Industrial & Engineering Chemistry Research, vol. 39, no. 7, pp. 2418-2426, Jul. 2000.
[9] J.-Y. Lin and C.-C. Yu, “Automatic tuning and gain scheduling for pH control,” Chemical Engineering
Science, vol. 48, no. 18, pp. 3159-3171, Nov. 1993.
[10] H.-C. Chan and C.-C. Yu, “Autotuning of gain-scheduled pH control: An experimental study,”
Industrial & Engineering Chemistry Research, vol. 34, no. 5, pp. 1718-1729, May 1995.
[11] J. Zhang, “A nonlinear gain scheduling control strategy based on neuro-fuzzy networks,” Industrial &
Engineering Chemistry Research, vol. 40, no. 14, pp. 3164-3170, Jul. 2001.
[12] M. R. Pishvaie and M. Shahrokhi, “pH control using the nonlinear multiple models, switching, and tuning approach,” Industrial & Engineering Chemistry Research, vol. 39, no. 5, pp. 1311-1319, May 2000. [13] M. A. Henson and D. E. Seborg, “Adaptive nonlinear control of a pH neutralization process,” IEEE
Transactions on Control Systems Technology, vol. 2, no. 3, pp. 169-182, 1994.
[14] A. Nejati, M. Shahrokhi, and A. Mehrabani, “Adaptive input-output linearization control of pH processes,” Iranian Journal of Chemistry and Chemical Engineering (IJCCE), vol. 27, no. 3, pp. 25-35, Jan. 2008.
[15] A. Nejati, M. Shahrokhi, and A. Mehrabani, “Comparison between backstepping and input–output linearization techniques for pH process control,” Journal of Process Control, vol. 22, no. 1, pp. 263-271, Jan. 2012.
[16] M. Ławryńczuk, Computationally Efficient Model Predictive Control Algorithms: A Neural Network Approach. Berlin: Springer, 2014.
[image:12.595.172.421.116.170.2][18] W.-R. Zhao, H.-X. Shi, and D.-H. Wang, “Modeling of mass transfer characteristics of bubble column reactor with surfactant present,” Journal of Zhejiang University-SCIENCE A, vol. 5, no. 6, pp. 714-720, Jun. 2004.
[19] L. Kucka, J. Richter, E. Y. Kenig, and A. Górak, “Determination of gas–liquid reaction kinetics with a stirred cell reactor,” Separation and Purification Technology, vol. 31, no. 2, pp. 163-175, May 2003.
[20] A. L. Kohl and R. Nielsen, Gas Purification. Gulf Professional Publishing, 1997.
[21] A. H. G. Cents, D. W. F. Brilman, and G. F. Versteeg, “CO2 absorption in carbonate/bicarbonate
solutions: The Danckwerts-criterion revisited,” Chemical Engineering Science, vol. 60, no. 21, pp. 5830-5835, Nov. 2005.
[22] P. Iancu, S. Velea, V. Pleşu, C. Muscalu, and R. David, “Modelling and simulation of CO2 absorption
in alkaline buffer solutions in gPROMS,” Chemical Engineering Transactions, vol. 21, pp. 679-684, 2010.
[23] D. Darmana, R. L. B. Henket, N. G. Deen, and J. A.M. Kuipers, “Detailed modelling of hydrodynamics, mass transfer and chemical reactions in a bubble column using a discrete bubble model: Chemisorption of into NaOH solution, numerical and experimental study,” Chemical Engineering
Science, vol. 62, no. 9, pp. 2556-2575, Feb. 2007.
[24] I. Tinoco, K. Sauer, J. C. Wang, and J. D. Puglisi, Physical Chemistry: Principles and Applications in Biological
Sciences. New Jersey, Pearson Higher Education, 2003.