She Figures 2012
Statistics and Indicators
and Innovation
Gender in Research
A-25-617-EN-C
Women employed as researchers still remain a minority, but are they catching up? Is their distribution throughout diff erent fi elds of science changing over time? Are women eff ectively progressing in their careers to achieve top level positions? Are more women sitting on executive or advisory boards of research organisations?
Since 2003, the Directorate General for Research and Innovation of the European Commission publishes statistics and indicators on women in science and research to provide answers to the above questions, and more. The She Figures 2012 contains the most recent available data on the involvement of women covering the period from tertiary education to employment and their work-life outlook, in the 27 EU Member States and in the Associated Countries.
This compendium is produced in cooperation with Member States, Associated Countries, and Eurostat.
Studies and reports
Figur
es
2012
G
en
der
in
Res
ea
rc
h
an
d
inn
ova
tio
Directorate-General for Research and Innovation Directorate B — European Research Area
She Figures 2012
Statistics and Indicators
to your questions about the European Union
Freephone number (*):
00 800 6 7 8 9 10 11
(*) Certain mobile telephone operators do not allow access to 00 800 numbers or these calls may be billed
LEGAL NOTICE
Neither the European Commission nor any person acting on behalf of the Commission is
responsible for the use which might be made of the following information.
The views expressed in this publication are the sole responsibility of the author and do not
necessarily reflect the views of the European Commission.
More information on the European Union is available on the Internet (http://europa.eu).
Cataloguing data can be found at the end of this publication.
Luxembourg: Publications Office of the European Union, 2013
ISBN 978-92-79-27642-2
doi 10.2777/38520
© European Union, 2013
This is the fourth issue of She Figures since the Commission first published it in 2003, and I must say that the analyses presented show that we are far from achieving gender equality in research. This is regretful for women researchers and bad for Europe.
I note that women are still under-represented in both the public and private research sectors, where only one third of European researchers are women, and this proportion falls to less than one fifth in the business sector. In the higher education sector, where initially women
graduates outnumber their male colleagues, women represent only ten per cent of the rectors of universities. Furthermore, we still have an unbalanced representation of women and men in decision making bodies with on average only one woman for every two men on scientific and management boards across the EU.
This is not just a ‘numbers game’ in terms of unused potential. The under-representation of women deprives them of the opportunity to contribute towards research and innovation on an equal footing; and, given the different perspectives that women bring, the quality of research and innovation suffers as well.
The figures do show us that some gaps have been reducing slowly over recent years, but gender imbalance in research is not a self-correcting phenomenon and so we must redouble our efforts. This is why I have pushed hard to ensure that the promotion of gender equality is an integral part of the EU’s strategy to establish the European Research Area. In this context, I am delighted that European stakeholder networks representing universities, research organisations and funding agencies have recently signed Memoranda of Understanding affirming their commitment to promote gender equality.
We need She Figures to inform us what the current situation is and to remind us of our obligations. I am convinced, however, that together — citizens, policy makers, stakeholders, researchers and their employers — we can make a difference and turn our ambition into reality!
Acknowledgements
She Figures 2012 is the outcome of a coordinated effort by many people whose assistance is gratefully acknowledged. I would particularly like to thank the following for their important contributions to this publication:
• The Helsinki Group on Women and Science for providing scientific advice;
• The Statistical Correspondents of the Helsinki Group on Women and Science for providing data
and technical advice ;
• Síle O’Dorchai and Danièle Meulders at the Department of Applied Economics of Université Libre de Bruxelles (DULBEA, ULB) for drafting the text and analysing the data for the She
Figures 2012 leaflet and booklet;
• Doina Parvan, Jelle Bosch and Frédéric Stibling at Sogeti Luxembourg S.A. for the data collection,
layout and production of the She Figures 2012 leaflet and booklet;
• Veijo Ritola, Silvia Crintea-Rotaru and Bernard Felix at Eurostat for support with data quality
and methodological issues;
• Michèle Magermans and Peter Whitten from the Directorate-General for Research and
Innovation for scientific and practical support;
• Roberta Pattono, Viviane Willis-Mazzichi, Vera Fehnle, Gergana Guncheva and Carmen Ianosi from the Gender sector of the Directorate-General for Research and Innovation for the impetus
and overall co-ordination of this project.
GILLES LAROCHE Head of Unit Ethics and Gender,
Executive summary
She Figures 2012 is the fourth publication of a key set of indicators that are essential to understand the situation of women in science and research. The She Figures data collection is undertaken every
three years since 2003 by the Directorate-General for Research and Innovation of the European
Commission, in cooperation with the Helsinki Group and its sub-group of Statistical Correspondents. Over time, the list of indicators has evolved into rich and multi-faceted approach that describes the participation of women at all levels and in all scientific disciplines.
The major findings and trends of the She Figures 2012 can be summarised as follows: In terms of scientific employment, as further explained in Chapter 1:
• In 2010, the share of women in total employment reached 45 %, but women made up 53 % of
tertiary educated people who were employed as professionals or technicians. However, that
same year in the EU-27, only 32 % of scientists and engineers were women.
• In 2010, in the EU-27, the share of women in knowledge-intensive activities stood at 44 % and thus largely exceeded that of men at 28 %. However, restricting the scope to Business Industries puts forth a different picture: 13 % of women and 14 % of men.
• In 2009, in the EU-27, women in research remained a minority, accounting for only 33 % of
researchers.
• In the EU-27, the proportion of female researchers has been growing faster than that of men (5.1 % annually over 2002–2009 compared with 3.3 % for men); the same holds true for the proportion of women among scientists and engineers (up 5.4 % annually between 2002 and 2010, compared with 3.1 % for men).
• On average in the EU-27, women represented 40 % of all researchers in the Higher Education Sector, 40 % in the Government Sector and 19 % in the Business Enterprise Sector, but in all
three sectors the number of female researchers has been witnessing higher growth rates
than the number of male researchers. Between 2002 and 2009, some countries have been
characterised by a negative growth in the number of researchers working in the Government and the Business Enterprise sectors.
• A ‘generation effect’ is at work as the gender imbalance in the research population increases
with age.
• Female researchers may be more likely to work part-time which may explain the gender
differences in scientific employment.
In terms of scientific fields, as further outlined in Chapter 2:
• In 2010, in the EU-27, 46 % of all PhD graduates were women. Over the period 2002–2010, the average number of female PhD graduates increased at a rate of 3.7 % per year, compared to 1.6 % for male PhD graduates.
• In 2010, female PhD graduates equalled or outnumbered men in all broad fields of study, except for science, mathematics and computing (40 %), as well as engineering, manufacturing and construction (26 %), the two fields with the highest overall number of PhD graduates.
• Over the period 2002–2009, female researchers were generally gaining ground in all fields
In terms of career development, as further described in Chapter 3:
• In 2010 the levels of occupational segregation were only slightly lower in Higher Education than in the Government Sector, as shown by the Dissimilarity Index.
• Women’s academic career remains markedly characterised by strong vertical segregation. In 2010, the proportion of female students (55 %) and graduates (59 %) exceeded that of male students, but men outnumbered women among PhD students and graduates (the proportion of female students stood at 49 % and that of PhD graduates at 46 %). Furthermore, women represented only 44 % of grade C academic staff, 37 % of grade B academic staff and 20 % of
grade A academic staff.
• The under-representation of women is even more striking in the field of science and engineering. The proportion of women increased from just 31 % of the student population at the first level to 38 % of PhD students and 35 % of PhD graduates, but stood at 32 % of academic grade C personnel, 23 % of grade B and just 11 % of grade A.
• The proportion of women among full professors was highest in the humanities and the social sciences, respectively 28.4 % and 19.4 %, and lowest in engineering and technology, at 7.9 %. • The glass ceiling index stood at 1.8 in the EU-27 in 2010, pointing towards slow progress since
2004 when the index stood at 1.9 (the higher the score, the thicker the ceiling).
• In 2010, researchers were more likely to have children than the working population, and this
holds true for both men and women.
• In all three sectors (Higher Education Sector, Government Sector and Business Enterprise Sector) and in nearly all EU countries studied, the proportion of male researchers exceeds that
of female researchers.
• The proportion of women among technicians varies between the three sectors. It was
systematically higher than that of men in Higher Education, except in four countries. In the Government Sector, there were exceptions to this overall pattern; and in the Business Enterprise Sector, the countries are divided in two groups of roughly equal size, one where there were more female than male technicians, and one where the opposite is observed.
In terms of decision making, as further outlined in Chapter 4:
• In 2010, on average throughout the EU-27, 15.5 % of institutions in the Higher Education Sector were headed by women, and just 10 % of universities had a female rector.
• On average in the EU-27, 36 % of board members were women in 2010, whereas in 2007 they represented only 22 %, an increase which is influenced to a certain extent by changes in the
computing methods for the EU average.
• Out of the 22 countries for which 2010 data are available, 17 countries reported higher success
rates for men in obtaining research funding, whereas five countries (three EU members, Iceland
and Norway) reported higher success rates for women. Between 2002 and 2010, on average
in the EU-27, a closing of the gender gap in success rates seems to have taken place, many individual countries deviated from this overall pattern and gaps became greater in 11 countries.
• There is no clear relationship between gender segregation across fields of science and gender
differences with respect to success rates towards obtaining research funding.
• The proportion of female researchers was negatively correlated with the level of R&D
expenditure. Whereas women are least present in Business Sector research, it is this sector that on average spends the largest budget on research.
The policy implications of the results analysed in She Figures 2012 are numerous.
The work-life issue remain a key element in achieving gender equality and current indicators only take part of this into account. The fact that researchers are more likely to have children than the working population in general underscores the centrality of work-life balance issues for women and men scientists. There is not just a ‘glass ceiling’ but also a ‘maternal wall’ hindering the career of female researchers. Although work-life and work-family balance, in principle, concern both female and male scientists and researchers, women are usually more affected given that they still carry the main burden of care and domestic work. Besides general policies affecting women’s entry into the labour market and their employment conditions, policies specifically targeted at research organisations are needed to support women in their career advancement.
A gender-mixed composition of nominating commissions, an increase in the objectivity of the applied selection criteria, tutoring of women, or even the fixing of quotas, are all policies that are generally evoked, and in some countries already implemented, to balance out the unequal situation that continues to prevail in the academic sector and works against the discriminatory snowball effect.
Chapter or Annex
Page Figure
or Table
A Academic career 3 p.88-89 Fig.3.1-3.2
Academic career, science and engineering 3 p.89 Fig.3.2 Academic staff, by grade 3, A3 p.90, 107-109 T.3.1, A.3.1-3.3 Academic staff, by grade countries’ specificities A5 p.139
Age groups 1, 3, A3 p.41-42, 97-98, 109 Fig.1.14-1.15, T.3.3,
Fig.3.7, A.3.3
B Boards 4 p.117 Fig.4.2
Boards, by Country A5 p.148
Business Enterprise Sector (BES) 1, A1, 2,
A2, 3, A3
p.33, 39, 48, 73-75, 83, 105, 112
Fig.1.9, Fig 1.13, A.1.4, Fig.2.6, T.2.8-2.9, A.2.6, Fig.3.12, A.3.6
C Classifications A5 p.132
Cut-off date A5 p.136
D Data sources A5 p.135
Dissimilarity index 2 p.77 T.2.10
Distribution of researchers 1, 2 p.36, 41-42, 62, 69 Fig.1.10, Fig.1.14-1.15,
Fig.2.4, Fig.2.5
E Engineers & Scientists 1, 3 p.19, 21, 89 Fig.1.1, Fig.1.3, Fig.3.2
F Fields of science 2, A2, 3,
A3, 4, A4
p.62, 64, 66, 69-71, 81-82, 93-94, 108,
121, 127
Fig.2.4, T.2.4, T.2.5, Fig. 2.5, T.2.6-2.7, A.2.4-2.5, T.3.2, Fig.A.2.4-2.5, A.3.2, T.4.2, A.4.3
Fields of study 2, A2 p.57, 59-60, 79-80 Fig.2.3, T.2.2-2.3, A.2.2-2.3
Funding success rate 4, A4 p.119,121, 126-127 Fig.4.3, T.4.2, A.4.2-4.3
G Glass ceiling index 3 p.96 Fig.3.6
Government Sector (GOV) 1, A1, 2,
A2, 3, A3
p.32, 38, 42, 47, 69-71, 77, 82, 104, 111
Fig.1.9, Fig.1.12, Fig.1.15, A.1.3, Fig.2.5, T.2.6-2.7, T.2.10, A.2.5, Fig.3.11, A.3.5
Grade A 3, A3 p.91-94, 97, 98,
108-109
Fig.3.3, Fig.3.4, T.3.2, Fig.2.5, T.3.3, Fig.3.7,
A.3.2-3.3
Graduates, ISCED 6 2, A2 p.51, 52, 54, 57,
59-60,78-80
Fig.2.1, Fig.2.2, T.2.1, Fig.2.3, T.2.2-2.3, A.2.1-2.3
H Heads of Institutions in HES 4, A4 p.115, 125 Fig.4.1, A.4.1
Heads of Universities or assimilated Institutions 4 p.116 T.4.1
Higher Education Sector (HES) 1, A1, 2,
A2, 3, A3,
4, A4
p.31, 37, 41, 46, 62,64, 66,77, 81, 103, 110, 115, 125
Fig.1.9, Fig 1.11, Fig.1.14, A.1.2, Fig 2.4, T.2.4, T.2.5, T.2.10, A.2.4, Fig.3.10, A.3.4,
Chapter or Annex
Page Figure
or Table Human Resources in Science and Technology
(HRST)
1 p.19, 20 Fig.1.1-Fig.1.2
Human Resources in Science and Technology -
Core (HRSTC)
1 p.19, 20 Fig.1.1-Fig.1.2
Human Resources in Science and Technology -
Education (HRSTE)
1 p.20 Fig.1.2
K Knowledge Intensive Activities (KIA) 1 p.23 Fig.1.4
Knowledge Intensive Activities - Business Industries
(KIABI)
1 p.24 Fig.1.5
M Mobility 1 p.43 Fig.1.16
P Parenthood 3 p.100 Fig.3.8
PhD graduates 2 p.51, 52, 54, 57,
59-60
Fig.2.1, Fig.2.2, T.2.1, Fig.2.3, T.2.2-2.3
R R&D expenditure A4 p.129 A.4.4
R&D expenditure per capita researcher 4 p.122-123 Fig.4.4-4.5
R&D personnel 3, A3 p.102-105, 110-112 Fig.3.9-3.12, A.3.4-3.6
R&D personnel, by occupation 3 p.102-105 Fig.3.9-3.12
Research funds A5 p.146
Researchers 1, A1 p.28, 45 Fig. 1.8, A.1.1
Business Enterprise Sector 1, A1, 2, A2
p.33, 39, 48, 73-75,
83
Fig.1.9, Fig 1.13, A.1.4, Fig.2.6, T.2.8-2.9, A.2.6
Compound annual growth rate 1, 2 p.19, 27, 37-39, 64 Fig.1.1, Fig.1.7,
Fig 1.11-1.13, T.2.4
Distribution across sectors 1 p.36, 41-42 Fig.1.10, Fig. 1.14-1.15
Female proportion 1, 2 p.19, 26, 31-33, 66, 74-75
Fig.1.1, Fig 1.6, Fig.1.9, T.2.5, T.2.8-2.9
Government Sector 1, A1, 2, A2
p.32, 38, 42, 47,
69-71,77, 82
Fig.1.9, Fig.1.12, Fig.1.15, A.1.3, Fig.2.5, T.2.6-2.7, T.2.10, A.2.5
Higher Education Sector 1, A1, 2, A2
p.31, 37, 41, 46, 62, 66, 77, 81
Fig.1.9, Fig 1.11, Fig.1.14, A.1.2, Fig.2.4, T.2.5, T.2.10, A.2.4
Mobility 1 p.43 Fig.1.16
In labour force 1 p.21 Fig.1.3
S Scientists & Engineers 1, 3 p.19,21, 89 Fig.1.1, Fig 1.3, Fig.3.2
General introduction 13
Chapter 1 Setting the scope 17
Chapter 2 Scientific fields 49
Chapter 3 Seniority 85
Chapter 4 Setting the scientific agenda 113
Annex 5 Methodological notes 132
Annex 6 List of Statistical Correspondents of the Helsinki Group on Women in Science
151
References 153
Chapter 1 Setting the scope
Figure 1.1 Proportion of women in the EU-27 for total employment, tertiary educated and employed as professionals and technicians (HRSTC) and scientists and engineers in 2010, compound
annual growth rate for women and men, 2002-2010 19
Figure 1.2 Tertiary educated and employed as professionals and technicians (HRSTC), as a percentage
of tertiary educated (HRSTE), by sex, 2010 20
Figure 1.3 Proportion of scientists and engineers in the total labour force by sex, 2010 21
Figure 1.4 Employment in knowledge-intensive activities (KIA), 2010 (%) 23
Figure 1.5 Employment in knowledge-intensive activities – Business Industries (KIABI), 2010 24
Figure 1.6 Proportion of female researchers, 2009 26
Figure 1.7 Compound annual growth rate for researchers by sex, 2002-2009 27 Figure 1.8 Researchers per thousand labour force by sex, 2009 28
Figure 1.9 Proportion of female researchers by sector, 2009 31
Figure 1.10 Distribution of researchers across sectors by sex, 2009 36
Figure 1.11 Compound annual growth rate for researchers in the Higher Education Sector (HES),
by sex, 2002-2009 37
Figure 1.12 Compound annual growth rate for researchers in the Government Sector (GOV),
by sex, 2002-2009 38
Figure 1.13 Compound annual growth rate for researchers in the Business Enterprise Sector (BES),
by sex, 2002-2009 39
Figure 1.14 Distribution of researchers in the Higher Education Sector (HES) by sex and age group, 2009 41
Figure 1.15 Distribution of researchers in the Government Sector (GOV) by sex and age group, 2009 42
Figure 1.16 Share of mobile researchers by gender, 2009 43
Annex 1.1 Number of researchers by sex, head count, 2002-2009 45
Annex 1.2 Number of researchers in the Higher Education Sector (HES), by sex, head count,
2002-2009 46
Annex 1.3 Number of researchers in the Government Sector (GOV), by sex, head count, 2002-2009 47
Annex 1.4 Number of researchers in the Business Enterprise Sector (BES) by sex, head count,
2002-2009 48
Chapter 2 Scientific fields
Figure 2.1 Proportion of female PhD (ISCED 6) graduates, 2010 51
Figure 2.2 Compound annual growth rate of PhD (ISCED 6) graduates by sex, 2002-2010 52
Table 2.1 Proportion of female PhD (ISCED 6) graduates by broad field of study, 2010 54
Figure 2.3 Distribution of PhD (ISCED6) graduates across the broad fields of study by sex, 2010 57
Table 2.2 Compound annual growth rates of PhD (ISCED6) graduates by narrow field of study in natural
Table of contents
Table 2.3 Evolution of the proportion of female PhD (ISCED6) graduates by narrow field of study in
natural science and engineering (fields EF4 & EF5), 2002-2010 60
Figure 2.4 Distribution of researchers in the Higher Education Sector (HES), across fields of science,
2009 62
Table 2.4 Compound annual growth rates of female researchers in the Higher Education Sector (HES),
by field of science, 2002-2009 64
Table 2.5 Evolution of the proportion of female researchers in the Higher Education Sector (HES), by
field of science, 2002-2009 66
Figure 2.5 Distribution of researchers in the Government Sector (GOV), across fields of science, 2009 69
Table 2.6 Compound annual growth rates of female researchers in the Government Sector (GOV)
by field of science, 2002-2009 70
Table 2.7 Evolution of the proportion of female researchers in the Government Sector (GOV),
by field of science, 2002-2009 71
Figure 2.6 Distribution of researchers across economic activities (NACE Rev 2) in the Business Enterprise
Sector (BES), 2009 73
Table 2.8 Proportion of female researchers by economic activity (NACE rev.2) in the Business Enterprise
Sector (BES), 2009 74
Table 2.9 Evolution of the proportion of female researchers in the Business Enterprise Sector (BES), by
field of science, 2002-2009 75
Table 2.10 Dissimilarity index for researchers in Higher Education Sector (HES) and Government Sector
(GOV), 2009 77
Annex 2.1 Number of ISCED 6 graduates by sex, 2006-2010 78 Annex 2.2 Number of ISCED 6 graduates by broad field of study and sex, 2010 79
Annex 2.3 Number of ISCED 6 graduates by narrow field of study and sex in natural science and
engineering (EF4 & EF5 fields), 2010 80
Annex 2.4 Number of researchers in the Higher Education Sector (HES), by field of science and sex, 2009 81
Annex 2.5 Number of researchers in the Government Sector (GOV), by field of science and sex, 2009 82
Annex 2.6 Number of researchers in the Business Enterprise Sector (BES), by economic activity (NACE
rev. 2) and sex, 2009 83
Chapter 3 Seniority
Figure 3.1 Proportions of men and women in a typical academic career, students and academic staff,
EU-27, 2002/2010 88
Figure 3.2 Proportions of men and women in a typical academic career in science and engineering,
students and academic staff, EU-27, 2002/2010 89
Table 3.1 Proportion of female academic staff by grade and total, 2010 90
Figure 3.3 Proportion of women in grade A academic positions, 2002/2010 91
Figure 3.4 Percentage of grade A among all academic staff by sex, 2010 92
Table 3.2 Proportion of female grade A staff by main field of science, 2010 93
Figure 3.5 Distribution of grade A staff across fields of science by sex, 2010 94
Figure 3.6 Glass Ceiling Index, 2004/2010 96
Table 3.3 Proportion of female grade A staff by age group, 2010 97
Figure 3.7 Distribution of grade A staff across age groups by sex, 2010 98
Figure 3.8 Distribution of R&D personnel across occupations for the Higher Education Sector (HES), by
sex, 2009 100
Figure 3.9 Distribution of R&D personnel across occupations for the Government Sector (GOV),
by sex, 2009 102
Figure 3.10 Distribution of R&D personnel across occupations for the Business Enterprise Sector (BES),
by sex, 2009 103
Figure 3.11 Distribution of R&D personnel across occupations in all Sectors (HES, GOV, BES),
by sex, 2009 104
Figure 3.12 The proportion of men/women researchers with children, 2010 105
Annex 3.1 Number of academic staff by grade and sex, 2010 107 Annex 3.2 Number of senior academic staff (Grade A) by field of science and sex, 2010 108 Annex 3.3 Number of academic staff (Grade A) by age group and sex, 2010 109
Annex 3.6 Number of R&D personnel across occupations for the Business Enterprise Sector (BES)
by sex, 2009 112
Chapter 4 Setting the scientific agenda
Figure 4.1 Proportion of female heads of institutions in the Higher Education Sector (HES), 2010 115
Table 4.1: Proportion of female heads of universities or assimilated institutions based on capacity to
deliver PhDs, 2010 116
Figure 4.2 Proportion of women on boards, 2010 117
Figure 4.3 Evolution in research funding success rate differences between women and men,
2002-2010 119
Table 4.2: Research funding success rate differences between women and men by field of science, 2010 121
Figure 4.4 Proportion of female researchers in FTE and R&D expenditure in Purchasing Power Standards
(PPS) per capita researcher, 2009 122
Figure 4.5 R&D Expenditure in Purchasing Power Standards (PPS) per capita researcher in FTE
by sector, 2009 123
Annex 4.1: Number of heads of institutions in the Higher Education Sector (HES) by sex, head count,
2010 125
Annex 4.2: Number of applicants and beneficiaries of research funding by sex, 2002-2010 126
Annex 4.3: Number of applicants and beneficiaries of research funding by sex and field of science, 2010 127
The She Figures is a collection of available data related to the situation of women in science and research. This data collection has evolved over time and has widened its perspective by exploring issues such as innovation, mobility or work-life balance. It also reflects a clear ambition to develop pan-European harmonised statistics facilitating cross-national comparisons and to build a base of gender-disaggregated data available at the EU-level. The She Figures provides valuable knowledge to a wide audience of research stakeholders, ranging from policy makers to researchers themselves. She Figures 2012 follows in the footsteps of She Figures 2003, 2006 and 2009. In general, chapters 1 and 2 are concerned with horizontal segregation, and chapters 3 and 4 with vertical segregation. Chapter 1 assesses the presence of women in knowledge-intensive activities, scientific and technological employment and research from a cross-country perspective. In particular, while it highlights the progression of women in science, engineering and technology and research, it also draws the broad lines of the problem of gender segregation across fields of science, fully analysed in chapter 2. Chapter 3 on seniority illustrates the workings of a glass ceiling that women hit during their ascent in the academic hierarchy. Moreover, data show that there is no spontaneous reduction of vertical segregation over time and particularly over recent years women’s catching up appears to have slowed down, at least at the PhD level. Finally, chapter 4 shows that women’s under-representation at the highest hierarchical levels of the academic career severely cuts their chances of influencing the scientific agenda, it makes it hard for young women in academia to find female role models, and it might bias all decisions that are taken at these high ranks regarding scientific policies, research subjects and credits and nominating rules and criteria.
She Figures 2012 goes further than previous editions by introducing new sets of additional data. In chapter 1, the proportion of women and men employed in knowledge-intensive activities in general and in business industries in particular completes the overall picture of women’s presence in scientific employment. Another new indicator in this chapter is the one on researchers’ mobility. In chapter 3, the proportions of male and female researchers with children were analysed in comparison with the proportions of parents in the total working population in order to get some notion of the extent to which researchers are affected by work/life balance issues. Unfortunately, She Figures 2012 is not able to update the information on the gender pay gap in public and private enterprise as it was first presented in the previous edition, She Figures 2009, because updated data from the European Structure of Earnings Survey were not out in time.
She Figures 2012 reveals that women in scientific research remain a minority (33 % of researchers in the EU-27 in 2009). Their proportion is growing faster than that of men but not enough to indicate that the gender imbalance in science is self-correcting. Positive trends can be observed such as the considerable growth in the proportion of female scientists and engineers or in the share of women graduating at PhD level in sciences although since 2006 the pace at which women have been catching up with men at the PhD level has slackened. However, horizontal gender segregation across different economic sectors and fields of science persists. Female researchers are far more likely to be employed in the higher education and the government sectors than in the business enterprise sector. Female researchers feature in higher proportions in social sciences, agricultural sciences, medical sciences, and humanities than in engineering and technology. Despite an increase in the percentage of women at the different stages of a typical academic career between 2002 and 2010, vertical segregation of women in science is persistent.
Although women’s entry and progression in science is bringing about a more equal representation of men and women in all fields of science and at all stages of the academic career, it still fails to give them an equal opportunity to participate in decision-making concerning scientific policies, research subjects and grants, and so forth. Their presence is essential to promote women in science, because diversity fosters excellence in research and innovation.
Data sources
Most of the statistics used in this publication are drawn from Eurostat, the statistical office of the European Union.
In addition, Statistical Correspondents from all EU Member States and Associated Countries provided data on the seniority of academic staff by sex and age group, differences between men and women for funding success rates, proportion of women on scientific boards and number of female heads of universities and other institutions in higher education. The Statistical Correspondents form a sub-group of the Helsinki Group on Women and Science, the advisory board set up in 1999 by the European Commission. The list of the Statistical Correspondents can be found in Annex 6.
Eurostat
The data from Eurostat originate from a variety of different surveys conducted at national level: • Researchers and R&D expenditure data are collected through the R&D Survey, which since
2004 has been carried out as a joint data collection between Eurostat and the OECD. R&D data for Japan and the United States come from the OECD’s Main Science and Technology Indicators (MSTI).
• Human Resources in Science and Technology (HRST) data and data on women’s and men’s presence in Knowledge-intensive activities (KIA and KIABI) are collected through the European Union Labour Force Survey (EU LFS).
• Education data are collected through the UOE (UNESCO-UIS, OECD, Eurostat) questionnaire. • Data on parenthood come from the European Statistics on Income and Living Conditions
(EU-SILC 2010).
Statistical Correspondents
The statistics on the seniority of academic staff, research funding success rates, membership of scientific boards and heads of institutions are collected at the national level through Higher Education and R&D Surveys, Ministries and Academies of Science, Research Councils and Universities as part of their own monitoring systems and administrative records. It should be noted that these data are not always ready for cross-country comparison at EU level. Technical details relating to adherence to standards and categorisation and data sources can be found in Annex 5.
Key definitions
PhD/Doctorate or equivalent graduates: The International Standard Classification of Education (ISCED) identifies a specific level – ISCED 6 – as “tertiary programmes which lead to the award of an advanced research qualification” (UNESCO, 1997). Education programmes such as PhDs and their equivalents are included in this level for all countries, as well as some post-doctoral programmes and, in a few cases, some shorter post-graduate programmes that are a pre-requisite for the Doctorate (for example the D.E.A. in France).
Human Resources in Science & Technology — Core (HRSTC): This section of the workforce is defined as those who are both qualified tertiary educated graduates from an S&T field of study and working in professional or technician occupations not formally qualified as above.
Scientists and Engineers (S&E): Data for this group are also drawn from the European Union Labour Force Survey, more specifically from the professional occupations category, but are restricted to “physical, mathematical and engineering occupations” and “life science and health occupations” and therefore exclude scientists in other occupational fields, such as social or agricultural sciences. Researchers: According to the common definition in the Frascati Manual (OECD, 2002), “Researchers are professionals engaged in the conception or creation of new knowledge, products, processes, methods and systems and also in the management of the projects concerned”.
1
The purpose of this chapter is to assess the presence of women in research in a cross-country perspective and set the context for the chapters that follow. It analyses the relative shares of women and men engaged in various forms of scientific employment.
Tertiary educated women more successful in finding a job
The employment participation, both as a snapshot for the year 2010, and as a dynamic process of change over the period 2002–2010, has been analysed by comparing the proportion of women in total employment with their share among the highly educated working in a science and technology occupation as professionals or technicians and among those working only as professionals (scientists and engineers) for the year 2010.
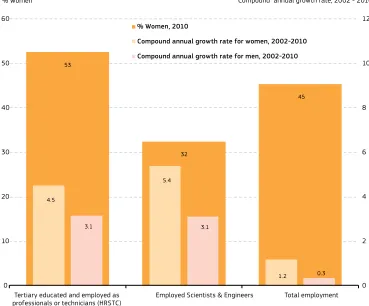
As shown in Figure 1.1, the fact that the proportion of women is higher among highly educated people employed as professionals or technicians (53 % among HRSTC – Human Resources in Science and Technology Core) than in total employment (45 %) illustrates that tertiary educated women are more successful in finding a job than their counterparts with a lower level of education. However, their proportion drops to 32 % among employed scientists and engineers, a narrower category of employment than highly educated people working as professionals or technicians (HRSTC), which in turn exemplifies the problem of gender segregation in education. Women and men are oriented towards gender-typical fields of study which are in turn associated with unequal opportunities on the labour market.
Between 2002 and 2010, women have been catching up with men as women’s compound annual growth rate has exceeded that of men both in total employment and in the two more precise sub-groups. The difference is largest among scientists and engineers, where the share of women has grown by an average of 5.4 % per year between 2002 and 2010 compared with a male growth rate of just 3.1 %. These growth rates are respectively 4.5 % and 3.1 % for highly educated women and men working as professionals or technicians. Employment in these subcategories thus seems to be expanding much more rapidly over recent years for both men and women than total employment. The growth in total employment was limited to 1.2 % on average per year for women and to 0.3 % for men over the period considered.
The limitations of headcount employment
1
Figure 1.1: Proportion of women in the EU-27 for total employment, tertiary educated and employed as professionals and technicians (HRSTC) and scientists and engineers in 2010, compound annual growth rate for women and men, 2002–2010
Source: Eurostat - Human Resources in Science & Technology (online data code: hrst_st_ncat); Labour Force Survey main indicators
(online data code: lfsi_emp_a).
53
32
45
4.5
5.4
1.2
3.1 3.1
0.3
0 2 4 6 8 10 12
0 10 20 30 40 50 60
Tertiary educated and employed as
professionals or technicians (HRSTC) Employed Scientists & Engineers Total employment
Compound annual growth rate, 2002 - 2010 % Women
% Women, 2010
Compound annual growth rate for women, 2002-2010 Compound annual growth rate for men, 2002-2010
An overall pattern of more highly-educated women working in a science and
technology occupation
[image:21.499.70.439.82.388.2]1
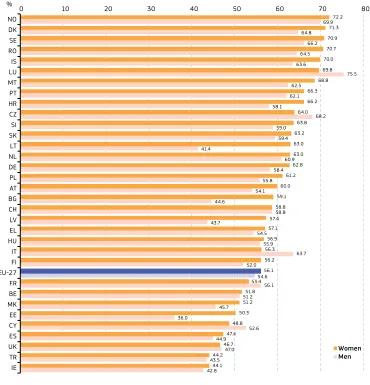
Figure 1.2: Tertiary educated in an S&T field and employed as professionals and technicians (HRSTC), as a percentage of tertiary educated in an S&T field (HRSTE), by sex, 2010
Data unavailable: EU-25, EU-15, IL, JP, US.
Source: Eurostat – Human Resources in Science & Technology (online data code: hrst_st_ncat).
72.2 71.3 70.9 70.7 70.0 69.8 68.8 66.3 66.2 64.0 63.8 63.2 63.0 63.0 62.8 61.2 60.0 59.1 58.8 57.4 57.1 56.9 56.3 56.2 56.1 53.4 51.8 51.2 50.3 48.8 47.4 46.7 44.2 44.1
69.9 64.8
66.2 64.5 63.6
75.5 62.5
62.1 58.1
68.2 59.0
59.4 41.4
60.9 58.4 55.8 54.1 44.6
58.8 43.7
54.5 55.9
63.7 52.0
54.6 56.1 51.2 45.7 36.0
52.6 44.9
47.0 43.5 42.8
0 10 20 30 40 50 60 70 80
NO DK SE RO IS LU MT PT HR CZ SI SK LT NL DE PL AT BG CH LV EL HU IT FI EU-27 FR BE MK EE CY ES UK TR IE %
Women Men
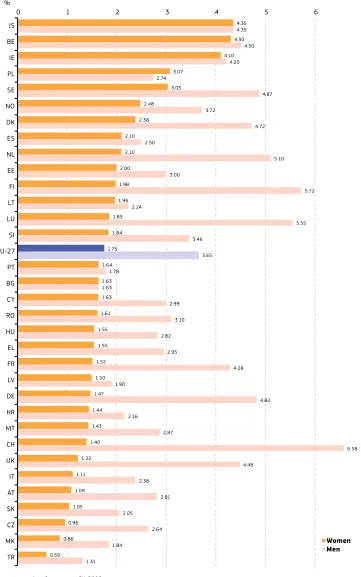
In most EU countries, gender differences stand out more in the field of science and engineering, a subgroup of the highly qualified working as professionals or technicians in the previous figure. Figure 1.3 shows the proportion of male and female scientists and engineers in the total labour force. When the proportion of female scientists in the total labour force is equal to the proportion of male scientists in the total labour force then we can say that 50 % of scientists and engineers are women. In 2010, there were only three countries where the proportion of female scientists and engineers was at 50 % or more: Iceland (50 %), Bulgaria (50 %), and Poland (53 %). On average 32 % of scientists and engineers were women in the EU-27. In many countries, the share of women among scientists and engineers was at a much lower level still. Switzerland is at the very bottom of the country ranking with just 18 % of women in this category.
[image:22.499.59.429.68.453.2]1
Figure 1.3: Proportion of scientists and engineers in the total labour force, by sex, 2010
4.35 4.30 4.10 3.07
3.03 2.48 2.38 2.10 2.10 2.00 1.98 1.96 1.85 1.84 1.75 1.64 1.63 1.63 1.61 1.55 1.55 1.52 1.50 1.47 1.44 1.43 1.40 1.22 1.11 1.09 1.05 0.96 0.86 0.59
4.35 4.50 4.20 2.74
4.87 3.72
4.72 2.50
5.10 3.00
5.72 2.24
5.55 3.46
3.65 1.78
1.63
2.99 3.10 2.82
2.95
4.28 1.90
4.82 2.16
2.87
6.58 4.48
2.38 2.81 2.05
2.64 1.84
1.31
0 1 2 3 4 5 6 7
IS BE IE PL SE NO DK ES NL EE FI LT LU SI EU-27 PT BG CY RO HU EL FR LV DE HR MT CH UK IT AT SK CZ MK TR %
[image:23.499.75.436.59.636.2]1
Uniform image in Knowledge-Intensive Activities (KIA), differentiation in
Knowledge-Intensive Activities – Business Industries (KIABI)
Another way of illustrating how women’s representation lowers as the population studied is narrowed down or becomes more specialised is by comparing the indicators on women’s and men’s relative presence in knowledge-intensive activities (KIA) or in knowledge-intensive activities – Business Industries (KIABI) as they are presented in Figures 1.4 and 1.5.
Figure 1.4 shows the relative presence of women and men in knowledge-intensive activities (activities where more than one third of the workforce is tertiary-educated). In all countries, the share of women in knowledge-intensive activities exceeds that of men and the gap is above 20 percentage points in 6 new member states (Estonia, Lithuania, Latvia, Slovakia, Poland and Malta) and Iceland. The highest shares of women in knowledge-intensive activities are observed in Luxembourg, Iceland, Malta, Sweden, the UK, Ireland and Belgium. This predominance of women in KIA should be attributed to the fact that KIA in this figure (as opposed to in Figure 1.5) include highly feminised public sectors such as education, health care, social work, and so forth.
Restricting the scope to Business Industries – KIABI (Figure 1.5) – changes the picture of women’s and men’s relative presence in knowledge-intensive activities. Whereas the gender gap was systematically in favour of women in Figure 1.4, when only Business Industries are concerned, the countries are divided in two groups of roughly equal size: in the first group, the share of women in knowledge-intensive business industries is still higher than that of men whereas in the second group, the inverse is observed. The highest shares of women are still to be found in Luxembourg, Malta, Ireland and Iceland but Sweden, the UK, and especially Belgium have fallen down in the ranking. It is also striking to see that when the focus is on Business Industries, the gaps between the shares of men and women in knowledge-intensive activities are much smaller in absolute value than when all sectors of economic activity are analysed.
KIA and KIABI:
1
Figure 1.4: Employment in knowledge-intensive activities (KIA), 2010 (%)
0 10 20 30 40 50 60
LU IS MT SE UK IE BE FR US DK DE HU CH FI NO
JP EE EU-27 SI LT AT SK IT CZ LV NL CY PL EL HR ES PT BG MK RO TR
Total Women Men
[image:25.499.72.446.55.653.2]1
Figure 1.5: Employment in knowledge-intensive activities — Business Industries (KIABI), 2010
Exceptions to the reference year: MK: 2011. Data unavailable: EU-25, EU-15, IL.
Others: US data: US Current Population Survey; JP data: JP Labour Force Survey.
Source: Eurostat - High-tech industry and knowledge-intensive services (online data code: htec_kia_emp2).
0 5 10 15 20 25 30
LU MT IE IS CY CH US JP DE SE SI UK IT DK HU AT FI BE FR EU-27 CZ NL EL SK NO ES EE HR PL BG LV LT PT MK RO TR
Total Women Men
%
[image:26.499.54.427.54.575.2]1
Female researchers: underrepresented at EU level, but slowly catching up
The gender distribution in the population of scientists and engineers as it was illustrated by Figures 1.1 and 1.3 is almost replicated in the population of researchers (Figure 1.6) which covers a broader base of subject domains than scientists and engineers, although the occupational function is defined more narrowly than human resources in science and technology. There is a clear pattern of female under-representation. The average proportion of female researchers in the EU-27 stood at 33 % in 2009 but wide variations were noted between countries: whereas Luxembourg, Germany and the Netherlands respectively have just 21 %, 25 % and 26 % of female researchers, at the top of the country ranking according to the proportion of women in research, there are two Baltic States, Latvia and Lithuania, where there are more women than men in research, but also Bulgaria, Portugal, Romania, Estonia, Slovakia, and Poland, all of which have at least 40 % of women in their researchers population.
The compound annual growth rate of the numbers of female and male researchers over the period 2002-2009 is shown in Figure 1.7. Again women seem to be catching up with men over time as their share of the total research population has been growing at a faster rate over the period considered although it must be remembered that the growth rate for women is on a smaller base than that for men so that if it is merely sustained and not radically increased, it will still take a long time to significantly improve the gender balance in research. Exceptions are the Czech Republic, Hungary, Greece and France where the number of male researchers has grown at a faster rate. In the EU-27 on average, the number of female researchers has increased at a rate of 5.1 % per year compared with 3.3 % for male researchers. The gap between the average annual growth rates of female and male researchers increased between 2006 and 2009 due to an important slowdown in the male growth rate, from 3.9 % over the period 2002-2006 to 2.4 % between 2006 and 2009. Given that the mean growth rate for women is higher in the EU-15 than in the EU-27 whereas both geographical entities put forth the same growth rate for male researchers, it appears that in the EU’s most recent Member States, the share of women in research is increasing at a slower pace than in the older Member States. An important exception is Cyprus where the compound annual growth rate of female researchers was as high as 11 % between 2002 and 2009. Moreover, from Figure 1.7 it appears that the gender gap in growth rates is generally smaller in countries where the growth rates for researchers have been lowest and it is higher in countries where the numbers of researchers have grown most rapidly. It is the widest in Austria, Malta, the Netherlands and Germany.
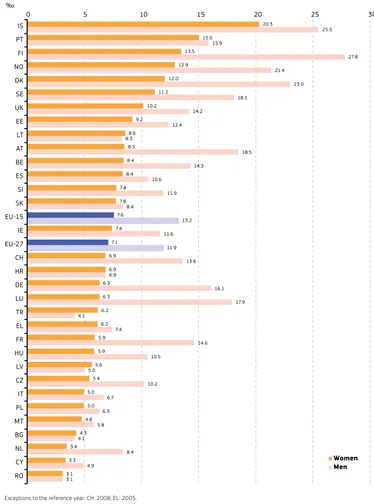
Male researchers represent 12
‰ of the labour force, females 7‰
This positive trend over time should not mask the pattern of female under-representation as shown in Figure 1.6 (proportion of female researchers). A similar pattern was also noted in the analysis of the number of researchers in the total labour force by sex. Figure 1.8 plots these results per thousand for the year 2009. Six exceptions aside (Lithuania, Turkey, Latvia and Bulgaria where the share of female researchers among active women is higher than the share of male researchers among active men; and Croatia and Romania where there are equal shares of researchers for both sexes), there are considerably fewer female researchers among active women than there are male researchers among active men. The male rates were 10 or more points per thousand higher that the female rates in Finland, Luxembourg, Denmark, and Austria. On average across the EU-27, 12 ‰ of the male labour force were researchers in 2009 compared with 7 ‰ of women on the labour market.
1
Figure 1.6: Proportion of female researchers, 2009
Exceptions to the reference year: CH, JP: 2008. EL: 2005. Data unavailable: EU-25, IL, US.
Provisional data: NL.
Data estimated: EU-27, EU-15, IE and UK. Others: Head count.
Source: Eurostat - Statistics on research and development (online data code: rd_p_femres).
52 51 48 46 46 45 43 43 41 40 38 38 36 36 36 36 36 35 34 33 33 33 32 32 32 31 30 29 29 28 27 26 25 21 13
0 5 10 15 20 25 30 35 40 45 50 55
[image:28.499.54.433.57.564.2]1
Figure 1.7: Compound annual growth rate for researchers, by sex, 2002–2009
Exceptions to the reference years: JP: 2002-2008; EL: 2003-2005; DE, LU, NL, PL, IS, NO: 2003-2009; CH: 2004-2008; MT, FI: 2004-2009; SE, UK: 2005-2009.
Data unavailable: EU-25, MK, IL, US. Break in series: DK: 2002, FR: 2002, SE: 2005. Provisional data: NL: 2005.
Data estimated: EU-27, EU-15, UK; DK, FR: 2002; MT: 2004; NL: 2003; SE: 2005. Others: Head count.
Source: Eurostat - Statistics on research and development (online data code: rd_p_persocc).
15.2 10.9
10.6 10.0 8.1
7.7 7.6 7.3 7.3 7.1 6.9 6.5 6.2 6.2 6.1 5.9 5.7 5.6 5.5 5.4 5.1 4.9 4.7 4.6 4.6 3.4 3.4 3.3 3.1 3.0 2.8 1.7 0.8 0.7 –3.1
13.9 4.4
6.2 5.7
9.7 3.6
2.2 2.5
6.8 3.5
5.0 4.5 4.4 4.0
5.7 2.4
–0.4
5.6 3.3
4.6 3.3 –0.9
5.1 0.3
1.6 2.3 1.0
3.0 3.7 0.5
0.0
2.8 0.6
0.3 –3.1
– 4 0 4 8 12 16
PT AT CY LU EL DK DE NO TR IT ES LT SK IE SI BE MT EE EU-15 BG EU-27 NL CZ CH JP IS FI RO FR UK HR HU PL LV SE
%
[image:29.499.75.439.54.544.2]1
Figure 1.8: Researchers per thousand labour force, by sex, 2009
Exceptions to the reference year: CH: 2008; EL: 2005. Data unavailable: EU-25, MK, IL, JP, US.
Data estimated: EU-27, EU-15, IE, UK. Others: Head count.
LU: results for men and women may be overestimated due to commuters excluded from the denominator. The labour force is defined as the sum of employed and unemployed persons (15 years and over).
Source: Eurostat - Statistics on research and development (online data code: rd_p_persocc).
20.3 15.0
13.5 12.9 12.0 11.2 10.2 9.2 8.6 8.5 8.4 8.4 7.8 7.8 7.6 7.4 7.1 6.9 6.9 6.3 6.3 6.2 6.2 5.9 5.9 5.6 5.4 5.0 5.0 4.8 4.3 3.4 3.3 3.1
25.5 15.9
27.8 21.4
23.0 18.1
14.2 12.4 8.3
18.5 14.3
10.6 11.9 8.4
13.2 11.6
11.9 13.6 6.9
16.1 17.9 4.1
7.4
14.6 10.5
5.0
10.2 6.7
6.3 5.8 4.1
8.4 4.9
3.1
0 5 10 15 20 25 30
IS PT FI NO DK SE UK EE LT AT BE ES SI SK EU-15 IE EU-27 CH HR DE LU TR EL FR HU LV CZ IT PL MT BG NL CY RO ‰
[image:30.499.52.426.56.560.2]1
Summary of key findings regarding women’s relative representation in various formsof scientific employment
1
Women researchers in broad economic sectors: different perspectives
Figure 1.9 allows for a more detailed analysis of the proportions of female researchers as they were presented in Figure 1.6 for the year 2009. It yields the proportion of female researchers in three broad economic sectors: Higher Education, the Government Sector and the Business Enterprise Sector.
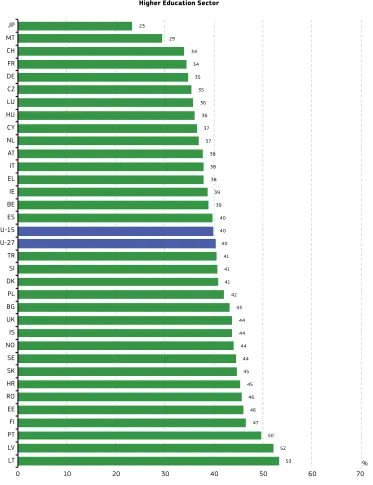
Whereas women’s presence appears to be relatively similar in the Government Sector and in Higher Education, it is considerably weaker in the Business Enterprise Sector. On average in the EU-27, women represent 40 % of all researchers in the Higher Education Sector, 40 % in the Government Sector but merely 19 % in the Business Enterprise Sector. The degree of cross-country disparity is larger in the Business Enterprise Sector than in the Higher Education and Government Sector. In the Higher Education Sector, just one EU-27 country has a proportion of women in research that is below 30 % (Malta). On the contrary, female proportions of 50 % or more are found in Portugal, Latvia and Lithuania. In the Government Sector, no EU-27 member state has a proportion of female researchers below 30 % (but this is the case for Japan and Turkey); and 50 % or more of all researchers are women in Romania, Lithuania, Latvia, Bulgaria, Portugal and Estonia. In the Business Enterprise Sector, the country distribution in terms of the size of the proportion of female researchers is skewed downwards compared with the previous two sectors. Women represent less than 15 % of the research population in three EU-27 countries (the Netherlands, Germany, and Luxembourg). Leaving aside Latvia where 53 % of researchers in the Business Enterprise Sector are women, their share is highest, although only around 40 %, in Romania, Bulgaria and Croatia. In sum, regardless of the sector, Japan systematically shows the lowest proportion of female researchers and within the EU-27 it is Germany that systematically reports among the lowest shares of female researchers. Latvia, Lithuania, Portugal, and Romania (but also Croatia for the non EU-27 members) are always among the countries with the highest proportions of women in research.
1
Figure 1.9: Proportion of female researchers by sector, 2009
Exceptions to the reference year: CH, JP: 2008; EL: 2007 (BES); EL: 2005 (HES & GOV). Data unavailable: EU-25, MK, IL, US.
Data estimated: EU-27, EU-15; UK (BES); IE (HES). Others: Head count.
Source: Eurostat - Statistics on research and development (online data code: rd_p_femres).
53 52 50 47 46 46 45 45 44 44 44 44 43 42 41 41 41 40 40 40 39 39 38 38 38 37 37 36 36 35 35 34 34 29 23
0 10 20 30 40 50 60 70
LT LV PT FI EE RO HR SK SE NO IS UK BG PL DK SI TR EU-27 EU-15 ES BE IE EL IT AT NL CY HU LU CZ DE FR CH MT JP
%
[image:33.499.75.448.61.546.2]1
Figure 1.9: Proportion of female researchers by sector, 2009 (continued)
Exceptions to the reference year: CH, JP: 2008; EL: 2007 (BES); EL: 2005 (HES & GOV). Data unavailable: EU-25, MK, IL, US.
Data estimated: EU-27, EU-15; UK (BES); IE (HES). Others: Head count.
Source: Eurostat - Statistics on research and development (online data code: rd_p_femres).
61 60 54 53 53 52 50 48 47 46 45 45 44 44 43 42 42 41 41 40 40 39 39 39 37 35 35 35 35 33 32 32 30 29 14
0 10 20 30 40 50 60 70
EE PT BG LV LT HR RO ES IS CY SI SK MT IT AT FI NO PL EL HU EU-27 SE IE EU-15 CZ LU UK DK FR CH BE DE NL TR JP
%
1
Figure 1.9: Proportion of female researchers by sector, 2009 (continued)
Exceptions to the reference year: CH, JP: 2008; EL: 2007 (BES); EL: 2005 (HES & GOV). Data unavailable: EU-25, MK, IL, US.
Data estimated: EU-27, EU-15; UK (BES); IE (HES). Others: Head count.
Source: Eurostat - Statistics on research and development (online data code: rd_p_femres).
53 43
41 38 32 31 30 29 28 28 27 27 26 26 24 24 24 23 22 22 22 21 21 20 19 19 19 19 17 16 16 14 13 11 7
0 10 20 30 40 50 60 70
LV BG HR RO IS LT PT ES EL EE CY MT IE SE BE DK TR SI NO PL SK HU IT FR EU-27 UK EU-15 CH FI AT CZ NL DE LU JP
%
1
Private Non-Profit Sector has a certain importance only in Italy, Portugal and
Cyprus
Figure 1.10 presents the distribution of male and female researchers across four broad sectors of activity for the year 2009: the Higher Education Sector, the Government Sector, the Business Enterprise Sector and the Private Non-Profit Sector. It confirms the trends highlighted by Figure 1.9 and compares the share of female and male researchers across the economic sectors. Figures 1.11, 1.12 and 1.13 add valuable information as they show the rate at which the numbers of male and female researchers have been increasing (or decreasing) on an average annual basis between 2002 and 2009 in each of three broad economic sectors (HES, GOV and BES). Both Figure 1.9 and 1.10 show that, in most countries, women are more likely than men to opt for employment in the Higher Education and Government Sectors. These sectors are in contrast with the Business Enterprise Sector, which is more likely to be chosen by men. On average throughout the EU-27, the respective shares of female and male researchers in the Higher Education Sector stood at 66 % and 48 % in 2009. In the EU-27, 12 % of female researchers and 9 % of male researchers were employed in the Government Sector. As mentioned above, in the EU-27, the Business Enterprise Sector employed a higher proportion of male researchers than female researchers, with an average of 42 % and 21 % respectively in 2009. The Private Non-Profit Sector employs a share of researchers that is worth mentioning only in Italy, Portugal, and Cyprus with 6-7 % of female researchers and 3-7 % of male researchers in 2009.
Gender imbalance across broad economic sectors has been levelling out over
recent years
As shown in Figures 1.11, 1.12 and 1.13, it appears that gender imbalance in the research population in three broad economic sectors, HES, GOV and BES, has been levelling out over recent years.
The Higher Education Sector: Higher growth in the number of female
researchers contributes to closing the gender gap
In the Higher Education Sector, where 40 % of researchers are women in 2009, the compound annual growth rate in the number of female researchers has been stronger than that of men over the period 2002–2009 in most countries (31 out of 33). The opposite was observed only in 2 countries, Luxembourg and Latvia, but with almost identical growth rates for women and men in the latter country. In Luxembourg, the compound annual growth rate over 2002-2009 of male researchers stood at 53 % and that of female researchers at 45 %. These extremely high figures should be interpreted in light of the creation of the University of Luxembourg in 2003. Throughout the EU-27, the average annual growth rate for female researchers has stood at 5.5 %, compared with 3.5 % for male researchers. Growth rates for both female and male researchers are extremely variable between countries: Luxembourg aside, they range from 19 % for women and 16 % for men in Portugal to levels close to zero for women or negative even for men in Hungary, Sweden and Poland. We may nevertheless conclude that there is a move towards a more gender-balanced research population in higher education: the proportion of female researchers in the Higher Education Sector increased from 35 % in 2002 to 37 % in 2006 and to 40 % in 2009.
The Government Sector: negative growth in the number of researchers in five
countries but an overall trend towards a narrowing gender gap
1
Women in the Business Enterprise Sector moving towards greater equality in
just over half of the countries
A decrease in the overall number of researchers was also observed in the Business Enterprise sector in five countries: Latvia, Romania, Switzerland, Slovakia and the UK. In this sector, where the proportion of female researchers is generally lower than that of men, the compound annual growth rate of female researchers has been stronger than that of men over the period 2002-2009 in 18 of the 33 countries under review. However, the closing of the gender gap is much slower in this sector as the share of female researchers increased by just one percentage point between 2002 (18 %) and 2009 (19 %). There is a high level of cross-country disparity in the pace at which the balancing out is taking place. For example, whereas in Portugal the respective compound annual growth rates for female and male researchers stood at 19.8 % and 18.7 % over the period 2002-2009, in Latvia, the number of female researchers decreased at a slower pace than the number of male researchers (–11.5 % and –14.1 % respectively). The opposite was observed in 14 countries, pointing towards a widening over time of the gender gap in the research population of the Business Enterprise Sector. These countries are Turkey, Poland, Hungary, France, Slovenia, the Czech Republic, Bulgaria, Romania, Switzerland, Luxembourg, Iceland, Greece, Lithuania, and Slovakia. Finally, in the UK, identical negative growth rates were noted for the male and female research populations.
1
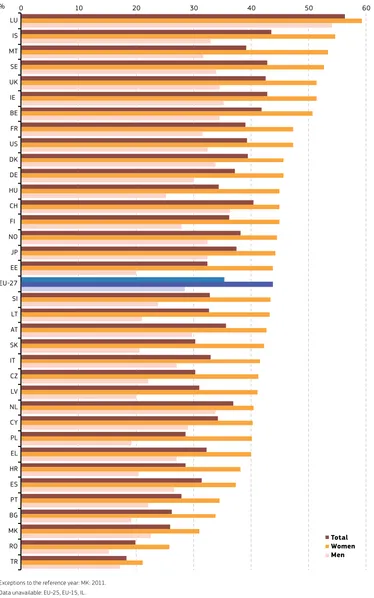
Figure 1.10: Distribution of researchers across sectors, by sex, 2009
Data unavailable: EU-25, MK, IL.
Exceptions to the reference year: EU-25, CH, JP: 2008; EL:2005; EL: 2007(BES). Data estimated: EU-27, EU-15, UK (BES&PNP); IE (HES).
Confidential data: HR (PNP). Others: Head count.
DE, IE, LV, LT, LU, HU, NL, TR, NO, CH: the distribution of researchers was calculated between HES, BES and GOV. No data available for PNP sector.
Source: Eurostat - Statistics on research and development (online data code: rd_p_persocc).
0 10 20 30 40 50 60 70 80 90 100
Women Men Women Men Women Men Women Men Women Men Women Men Women Men Women Men Women Men Women Men Women Men Women Men Women Men Women Men Women Men Women Men Women Men Women Men Women Men Women Men Women Men Women Men Women Men Women Men Women Men Women Men Women Men Women Men Women Men Women Men Women Men Women Men Women Men Women Men Women Men
EU
-2
7
EU
-1
5
BE
BG
CZ
DK
DE
EE
IE
EL
ES
FR
IT
CY
LV
LT
LU
HU
MT
NL
AT
PL
PT
RO
SI
SK
FI
SE
UK
HR
TR
IS
NO
CH
JP
Business Enterprise Sector Government Sector Higher Education Sector Private Non-Profit Sector
1
Figure 1.11: Compound annual growth rate for researchers in the Higher Education Sector (HES), by sex, 2002–2009
Exceptions to the reference years: CH, JP: 2002-2008; DE, LU, PL, SE, IS, NO: 2003-2009; EL: 2003-2005; FI: 2004-2009; UK: 2005-2009. Data unavailable: EU-25, MK, IL, US.
Break in series: DK, FR (2002).
Data estimated: EU-27, EU-15; PT, CH: 2002; LU: 2003; IE: 2009. Others: Head count.
Source: Eurostat - Statistics on research and development (online data code: rd_p_persocc).
19.1 15.3
14.9 14.7 11.4
11.2 9.7 8.9 8.7 7.7 7.5 7.5 7.4 7.1 6.5 6.3 5.9 5.8 5.6 5.5 5.4 5.1 4.9 4.2 4.2 4.1 3.9 3.6 3.6 2.6 1.4 0.6 0.3 0.1
16.3 11.9
10.6 9.9 5.5
5.8 7.2 1.4
6.2 3.0
2.6 2.8
3.2 3.9 3.4
6.0 5.4 3.6 3.4
3.5 5.1 2.0
0.8 0.9
2.4 0.7
1.9 2.1 –0.9
2.6 0.6 –0.5
–0.2 –0.4
– 2 0 2 4 6 8 10 12 14 16 18 20 22
LU PT RO CY BG DK AT EL DE SK CH IT NO SI LT BE CZ IS EU-15 TR EU-27 IE FI NL HR ES JP UK EE MT LV FR PL SE HU %
Compound annual growth rate for women, 2002-2009
Compound annual growth rate for men, 2002-2009
1
Figure 1.12: Compound annual growth rate for researchers in the Government Sector (GOV), by sex, 2002–2009
Exceptions to the reference years: CH, JP: 2002-2008; DE, NL, PL, SE, IS, NO: 2003-2009; EL: 2003-2005; FI: 2004-2009. Data unavailable: EU-25, MK, IL, US.
Break in series: DK, FR: 2002; NL: 2003. Data estimated: EU-27, EU-15; PT: 2002. Others: Head count.
Source: Eurostat - Statistics on research and development (online data code: rd_p_persocc).
11.6 11.0 9.2 8.5 8.0 7.6 7.4 6.6 5.7 5.6 5.0 4.3 4.3 3.8 3.7 3.6 3.0 2.9 2.8 2.8 2.7 1.6 1.6 1.5 1.3 1.3 0.6 0.6 0.3 – 0.1 – 0.2 – 0.5 – 1.2 – 5.7
– 5.8
7.8 9.6 7.9 3.7
3.4 5.7 2.1
–1.3
2.2 2.4 1.7 1.7
2.9
8.3 –4.3
1.7 –0.9
2.1 2.5 0.0
0.8 – 2.9
– 3.1 – 0.8
2.2 0.1 – 3.4
0.5 – 1.8
– 0.2 – 2.4 – 2.8 – 3.2 – 6.5
– 7.5
– 10 – 5 0 5 10 15
ES LU TR NO DE BE AT CH EU-15 IT IS EU-27 SI MT CY FR JP EE SK CZ FI IE NL UK LV HU EL PL BG RO LT HR PT DK SE %
1
Figure 1.13: Compound annual growth rate for researchers in the Business Enterprise Sector (BES), by sex, 2002–2009
Exceptions to the reference years: JP: 2002-2008; DE, LU, NL, PL, SE, IS, NO: 2003-2009; EL: 2003-2007; MT, FI, CH: 2004-2008; UK: 2005-2009. Data unavailable: MK, IL, US.
Break in series: DK, ES: 2002; MT: 2004.
Data estimated: EU-27, EU-15, UK; LU: 2002; PT: 2002. Others: Head count.
Source: Eurostat - Statistics on research and development (online data code: rd_p_persocc).
23.5 22.3 19.8 19.1 12.8
11.7 11.2 8.7 8.3 8.3 7.2 7.0 6.5 6.4 6.3 5.9 5.8 5.5 5.3 5.2 4.6 4.5 4.4 4.3 3.9 2.9 1.4 0.7 – 0.2 – 2.2 – 2.5 – 7.4
– 8.1 – 9.5 – 11.5
24.9 23.5 18.7
15.5 9.6
3.6 2.5
11.2 3.4
– 1.2
11.6 11.7 4.9
3.8 2.1
2.5 3.5
6.5 1.1
15.3 3.2
0.9 2.6
3.4 6.9
7.1 1.1
0.6 0.7
2.0 – 2.5
– 1.5 – 4.6 – 6.1 – 14.1
– 15 – 10 – 5 0 5 10 15 20 25
TR LT PT EE ES AT MT HU IE NL SI BG IT CY NO JP DK FR HR EL EU-15 BE DE EU-27 PL CZ SE FI IS LU UK SK CH RO LV
1
The gender gap in the research population by age group: highest for the under
35s and over 55s
The picture of women in research is further completed by Figures 1.14 and 1.15, which analyse male and female researchers according to their belonging to 4 different age groups (<35 years, 35-44 years, 45-54 years, and 55+ years). Figure 1.14 does this for the Higher Education Sector and Figure 1.15 for the Government Sector. In both of these large economic sectors, the greatest gender differences are in most countries observed in the two extreme age classes, among the youngest researchers aged under 35 and among those above 55 years of age. Women outnumber men in the youngest age group, with the exception of Cyprus and Latvia in the Government sector, while the opposite was observed for researchers above 55 years of age. Clearly, these figures illustrate the workings of a generation effect.
Part-time often prevents advancing in careers
Because of data limitations the analysis carried out in this chapter is based on headcount measures of employment, so that variations in working hours are not accounted for. However, part-time employment could be a major determinant of the high level of gender segregation that characterises the research population and that is further analysed in chapters 2 and 3. In particular, part-time jobs are often behind vertical segregation as they slow down or prevent women from advancing their careers and getting promoted to high-responsibility positions in research.
1
Figure 1.14: Distribution of researchers in the Higher Education Sector (HES), by sex and age group, 2009
Exceptions to the reference year: CZ, LU: 2006; PL: 2005.
Data unavailable: EU-27, EU-25, EU-15, BE, DK, DE, IE, EL, FR, MT, NL, PL, SE, UK, MK, TR, IS, CH, IL, JP, US. Others: Head count.
Source: Eurostat - Statistics on research and development (online data code: rd_p_persage).
0 10 20 30 40 50 60 70 80 90 100
Women Men Women Men Women Men Women Men Women Men Women Men Women Men Women Men Women Men Women Men Women Men Women Men Women Men Women Men Women Men Women Men Women Men Women Men
BG
CZ
EE
ES
IT
CY
LV
LT
LU
HU
AT
PT
RO
SI
SK
FI
HR
NO
<35 35-44 45-54 55+
1
Figure 1.15: Distribution of researchers in the Government Sector (GOV), by sex and age group, 2009
Exceptions to the reference year: LU: 2007; CZ: 2006.
Data unavailable: EU-27, EU-25, EU-15, BE, DK, DE, IE, EL, FR, MT, NL, PL, FI, SE, UK, MK, TR, IS, CH, IL, JP, US. Others: Head count.
Source: Eurostat - Statistics on research and development (online data code: rd_p_persage).
0 10 20 30 40 50 60 70 80 90 100
Women Men Women Men Women Men Women Men Women Men Women Men Women Men Women Men Women Men Women Men Women Men Women Men Women Men Women Men Women Men Women Men Women Men
BG
CZ
EE
ES
IT
CY
LV
LT
LU
HU
AT
PT
RO
SI
SK
HR
NO
<35 35-44 45-54 55+
1
Figure 1.16: Share of mobile researchers (1) by gender, 2009
Data unavailable: EU-25, EU-15, FR, CY, HR, TR, IS, NO, CH, IL, JP, US.
0 10 20 30 40 50 60 70 80 90 100
LV SK BE HU RO CZ PL AT EL DE EE UK EU-27 DK ES SE NL IT PT FI BG IE
Men Women
%
Researchers’ mobility: women more mobile only in Ireland
1
Summary of key findings regarding women’s relative representation in research On average in the EU-27, women represent 40 % of all researchers in the Higher Education Sector, 40 % in the Government Sector but merely 19 % in the Business Enterprise Sector. The degree of cross-country disparity is larger in the Business Enterprise Sector than in the Higher Education and Government Sector. The Private Non-Profit Sector employs a share of researchers that is worth mentioning only in Italy, Portugal, and Cyprus in 2009.
The gender imbalance across broad economic sectors has been levelling out over recent years. There is a straightforward move towards a more gender-balanced research population in the higher education sector. In the Government Sector, the total number of researchers has decreased in a number of countries but in most countries women’s presence has been strengthening over recent years. A decrease in the overall number of researchers was also observed in the Business Enterprise sector in five countries. In this sector, where the proportion of female researchers is generally lower than that of men, there also seems to be a move towards greater equality in the majority of countries under review although there is a high level of cross-country disparity in the level at which this balancing out is taking place.