Rochester Institute of Technology
RIT Scholar Works
Theses Thesis/Dissertation Collections
1996
The Integration of an information processing
system: A Case study based at the Lodge at
Woodcliff
Robert Sweeney
Follow this and additional works at:http://scholarworks.rit.edu/theses
This Thesis is brought to you for free and open access by the Thesis/Dissertation Collections at RIT Scholar Works. It has been accepted for inclusion in Theses by an authorized administrator of RIT Scholar Works. For more information, please [email protected].
Recommended Citation
The
Integration
of anInformation
Processing
System:
A
Case
Study
Based
at
the
Lodge
atWoodcliff
by
Robert
P.
Sweeney
Action
Research
submitted to theFaculty
of theSchool
ofFood,
Hotel
andTravel
Management
at the
Rochester Institute
ofTechnology
in
partialfulfillment
of requirementsfor
thedegree
of
Masters
ofScience
ROCHESTER INSTITUTE OF TECHNOLOGY School of Food, Hotel and Travel Management
Department of Graduate Studies
M. S. Service Management
Statement Granting or Denying Permission to Reproduce ThesislProject
The author of a thesis or project should complete one of the following statements and include this statement as the page following the title page.
Title ofthesis/project: The Integration of an Information Processing
System: A Case Study Based at the Lodge at Woodcliff
I, Robert P. Sweeney, hereby (grant, deny) pennission to the Wallace Memorial Library ofR. I. T., to reproduce the document titled above in whole or part. any reproductionwill not be for commercial use of profit.
OR
I, , prefer to be contacted each time a request for reproduction is made. I can be reached at the following address:
ROCHESTER INSTITUTE OFTECilJ.~'()LOGY School of Food, Hotel and Travel ;\1anagement
Department of Graduate Studies
:''1. S. Service Management
Presentation of ThesislProject Findings
Nwme: Robert P. Sweeney Date:9 /12/96 SS#:
Title of thesis/project:The Integration of an Information Processing
System: A Case Study Based at the Lodge at Woodcliff
Specific Recommendations:
CDse other side
ifnecessary.)Thesis Committee: (1) Dr. Ri chard Marecki
(2) _
(3) _
Facuity Advisor: _ _---'D:::..::...r~.~Rc=i...:::c:..:..h:..::a"_.::·r:....:d::...:Mc:.;a==-r::..=e~c.:..:kc=i _
Number of Credits Approved: __6 _ Credits
7/;//L
Date Corrimittee Chairperson's Signature
c-i
~
L- /1
"-~
Department Chairperson's SignatUre(Chairperson)
Note: This fonnwill not be signed by the Department Chairperson until all corrections, as suggested in the specific recommen6.tions (above) are completed.
Abstract
To make the claim that one provides 'World Class' service is easy.
Supporting
that claim is not so easy ifyou do not have the proper tools. The Lodge at Woodcliff, a resort hotel in Rochester, New York claims to provide'World Class'
service, but does not have the facts or tools to produce the facts
to support this claim.
Data has beencollected related to service quality throughout the resort.
This action research will attempt to integrate an information processing
system at the Lodge at Woodcliff. This informationprocessing system will
enable management at the Lodge at Woodcliff to measure quality standards
throughout the resort as well as make decisions based on statistics rather than
senses of whatis needed to be done.
Additional materials contained within this case study will provide
Acknowledgements
Iwould like to thank Dr. Richard Marecki and Dr. Jim Jacobs (aka Jake)
for their guidance overthe past year. Both ofthem have a giftfor teaching 'change'
in the thinking process.
Most importantly; THANKS Mo and Jack for the support, love and
guidance.
List of Charts
Figure Description Page
4.1 Pareto Diagram: Rooms Division Complaints 21
4.2 Control Chart: # ofDinner Reservations in
Dining Room 23
Table of Contents
Abstract i
Acknowledgements ii
Listof Charts iii
Chapter One: The Proposed Task 1
Introduction 1
The Problem Statement 2
Proposed Task 2
Scope of the Research 3
Background Information 3
The Purpose 4
Significance of the Research 4
The Nature of the Research 5
Abstract of Literature Review 5
Hypothesis 6
Definition of Terms 6
Assumptions 7
Procedures/Methodology 7
Stage One 8
Stage Two 8
Stage Three 9
Chapter Two: Review of Literature 10
ChapterThree: Stage One 15
Present Operating System 15
System Requirements 15
Compatibility 16
Capability 16
Software 17
Price Benchmark Study 18
Organizational Focus 18
Chapter Four: StageTwo 19
Installing the System and Software 19
Training the Operator 19
Familiarity 20
Pareto Diagrams 20
Control Charts 23
Radar Charts 24
Chapter Five: Stage Three 26
Integration 26
Resistance to Conform 26
Creating the Environment 26
Management's Challenge 28
Chapter Five: Stage Three (cont.)
Organizational Focus (cont.)
Know what Quality service is All
28
About 29
Understand Sampling
Mastering Basic Tools
Process Thinking
Involving People
Know how to Apply the Critical
29
30 30 30
Success Factors 31
Education 28
Identifying
MeasurementsBackground Information Related to Quality
Tools
32
33 Pareto Diagrams
Control Charts
33 34
Radar Charts 35
Chapter Six: Conclusions and Recommendations 37
Conclusions 37
Chapter
One
The
Proposed Task
Introduction:
Imagine an organization which spends the time, energy and money to
collect data related to customer service, yet lacks the ability to process this
information into a series of useful documents.
At present, the Lodge atWoodcliff holds a large bank of information,
compiled from feedback from guests and reports completedby employees at the resort. The make-up of this data is related to customerservice and/or
particular departments throughout out the resort. This data offers no insight to management in its 'raw state.'
Using this data bank and data continually
being
collected in regard to customer service; an information processingsystem needs to be developed to provide management with useful
information
by
which they can make decisions related to customer service.The puzzling question is; why would any organization spend the time,
man hours and dollars to collect information, yet not have a use for the information? There is no reason for this practice to take place. With the
addition of an information processing system, the transformation of this data
can prove to be quite valuable to the managers throughout the organization. Imagine this scenario: An organization which knows which mistakes
it makes most frequently, when those mistakes are made and which mistakes
offer the greatest amount ofenergy to the decrease in customer satisfaction;
contributing to loss inmarket share. This is powerful knowledge which can
turn a mediocre manager into a fantastic manager. This manager can lead his
employees through training related to these areas of growth opportunity. It is
important to note that the efforts are driven
by
the demands ofthe customersthemselves. Imagine that; an organization acting upon the demands of the
customer. Is that not the core ofthe service industry?
The Problem Statement:
The Lodge atWoodclifflacks the ability to transform 'raw7 data into
useful information
by
which managers can better make decisions. Theproblem is clearly defined as; datain its 'rawform' provides little useful
information to managers.
Proposed Task:
The proposed task is to integrate a computerized information system
consisting of a DOS based computer system and compatible statistical analysis
software, which will generate statistical process control (SPC) documents and
quality measurement diagrams. Also there is a need for training to be delivered throughout the entire property regarding the usefulness of the
information and how it relates to decision making aimed towards higher
levels of customer satisfaction.
Educating the management and staff at the Lodge at Woodcliff about
the meaning and uses of information that is provided by the information
processing system will be donein group seminars related to quality
improvement and the tools used to assist an organization as it moves toward
a process of continuous quality improvement. By understanding what the
information/reports reflect, management and staff can make better marketing
Scope/Limitations ofthe Research:
The data bank held by the Lodge atWoodcliffcontains data related to
all departments throughout the resort. This project shall reach out to encompass all ofthe departments on which data has been collected. The information processing system will be versatile enough to generate reports
related each respective department in the resort.
Support in the implementation will be provided by means of
educational seminars to the entire staff of the Lodge at Woodcliff.
The limitations set for this research are focused on the type of quality
measurement taking place. The
beginning
stages of quality measurement involves defect management. This, in a sense is a reactive approach. Thisresearch does not attempt to measure customer satisfaction. All of the data used to generate the statistical reports related to this study represent past occurrences.
Background Information:
Simply put; the data being collected throughout the Lodge at Woodcliff
contains valuable information related to customer service. In its raw form,
this data does not provide any insight asto what perceptions are held
by
thecustomer.
Time, effort and monies are being spent on the collection of this data,
but it sits idle; providing little to no value to managers in the organization. This is much like making an investment in a fabulous piece of equipment,
putting it into a closet and choosing notto use it to provide thebest quality
service possible to the customer. Anytime an investment is made in a
gain greater competitive advantage and/or improve on quality? The data
being
heldby
the Lodge at Woodcliffsits idly in a databank, providing nogrowth to the organization or its efforts focused on quality improvement. In order to transformthe 'raw7 datainto a usable form; adding value
and purpose as well; an information processing system needs to be
researched, purchased, installed, customized, and understood. At present, the Lodge at Woodcliff uses DOS based computer systems throughout the resort. Inmaintaining compatible with the existing system, DOS based hardware and
software will be sought to provide the necessary strengthto supportthe efforts of statistical analysis and SPC.
It seems that most organizations within the service industry hold very little knowledge of what kind of measurements and measurement tools can
help
them compete at a more competitive level. Without overwhelming theorganization members at the Lodge at Woodcliff, the presentations
supporting the implementation of the information processing system will be quite simple, interactive and 'user
friendly.'
This will enable participants to
clearly understand the value of the system as it applies to their respective departments.
The Purpose:
At the Lodge at Woodcliff, thereis a need to betterunderstand the
concerns of the customer. This can be done through the analysis of the feedbackthathas already been collected
by
the Lodge atWoodcliff.The purpose of this project is to
develop
an informationprocessing
Significance oftheResearch:
The importance of this project reaches various members of the Lodge
at Woodcliff's management team as well as the staff throughout the resort. On an operational level, this project will
help
prepare reports thathelp
the entire management team to understand the critical success factors which
customers indicate as contributors to a positive experience at the Lodge at Woodcliff.
Critical success factors constantly changing; by
using an information processing system to track these changes, management maintains a close
relationship with their customers. Without the deployment of this system, critical success factors can change without
being
recognized. This leads toeventual loss in market share.
More importantly, managers can use the information generated by the informationprocessing system to make more educated decisions, with a focus
on the customers needs.
Nature of the Research:
This project is a case study takingplace at the Lodge atWoodcliff. It
attempts to implement the use of an informationprocessing system related to
analyzing survey data and converting it into more useful and meaningful information representedby charts and graphs. This project is described as "action research,"
meaning that it will include the implementation of such a
system, and will be supported by an education process.
AbstractofLiterature Review:
measurement, quality, quality software, statistical process control, quality
tools, survey techniques, quality training, quality education, control charts
and information systems.
Educational text books, current literature, periodicals, and journals are
all sources that will be reviewed for information pertaining to the
aforementioned topics. Writings by authors such as A.C. Rosander, Henry L.
LeFevre, Peter Mears, Mary M. LoSardo and Norma M. Rossi offer guidance,
stimulation and insight relative to piecing together a simple, yet effective
implementation strategy for the information processing system. Two
periodicals that will supply valuable reference material pertaining to the
softwares available and the 'coaching' associated with the implementation of
the information processing system are Quality and Quality Progress. These
readings maintain an up to date outlook onthe efforts associated with
struggles faced
by
organizations when implementing quality programs.Found here is valuable informationregarding not only the system
requirements, but also the interpersonal requirements need to successfully
implement quality programs.
Hypothesis:
If an informationprocessing system is implemented at the Lodge at
Woodcliff, then they should have the ability to derive useful and meaningful
reports related to collected data.
Definitionofterms:
Information processing system: a computerized systemto used to
converted from its 'raw' state
Quality
tools: charts, graphs and/or techniques used in the assessmentof quality in an organization (ie. Pareto diagramss, frequency
charts, bar charts, control charts)
Statistical Process Control (SPC): Using generated statistics to plot
changes in a particular area of service or product creation over a
period of time
Critical success factors: those elements associated with a service or
product which add to the success of its existence within the
market place
Wholistic organization: an organization which understands its
existence as a series ofinter-related processes which perform
simultaneously to produce its services or goods
Assumptions:
It is assumed that the management and staff of the Lodge at Woodcliff
are committed to the task of using the survey data and an information
processing systemto betterunderstand the critical success factors
communicated by the customers and employees who supply the data.
The Lodge at Woodcliff has submitted applications for the Excelsior
Award, indicating their desire to become a 'World
Class'
provider of service.
This classification includes superior practices related to quality control and
customer research. Therefore,
developing
the assumption that this projectprovides value to the efforts applied toward achieving 'World Class'
status.
Procedures/Methodologv:
The Lodge at Woodcliff will providing collected data that will be
recoded
by
a team of researchers from the RochesterInstitute ofTechnology.This provided data will be the subject of statistical manipulation in order to
derive more meaningful information. The proposed software to be used for
such analysis isMinitabs statistical software, whichis produced by Minitabs,
Inc. Graphic displays and/or reportsto be generated by the software will
include Pareto diagrams, run charts, control charts, pie charts, radar charts
and
frequency
charts. Further review and analysis will be performed by themanagement team at the Lodge at Woodcliff,
determining
the usefulness ofthe reports, understanding of the information contained in the generated
reports and what additional support or changes need to madeto successfully
integrate the system into the daily operations of the resort.
To structure the progress of this project, three stages have been
identified. This outline of the three stages provides an overview of the action
steps which will contribute to the integration of the information processing
system.
Stage One:
The initial stage of this project will conduct research relative to
the information processing system. This will entail review of current
periodicals; articles related to softwares, system requirements,
capabilities and the compatibility ofsuch softwares. Price
benchmarking in its most simple form (comparative pricing of retail
vendors withinthe Rochester area) will be done to determine what
system hardwares are most affordable and capable ofperforming the
Stage Two:
At this point, the actions will turn toward the installing and
training the operator of the system. This willbe done using the
manuals provided
by
the software manufacturer(s), on-line support,software manufacturer support systems, and experimental trial and
error.
StageThree:
To round out the implementation of this project, the final phase
will support the integration of the information processing system
through seminars focused on quality improvement and quality
improvements tools. Specialinterest will be placed on what these
quality improvement tools represent, and how they can alter the
decision making process. These seminars will certainly reflect the goal
of long term quality improvement, rather than the 'quick fix' approach
Chapter
2Review
ofLiterature
In researching the dynamics involved in the implementation of the
information processing system; a number of viewpoints were established.
These viewpoints touched on include financial concerns, the technological
aspect of the information processing system, the interaction of the operator
with the system, managerial development and the organizational needs.
Initially concern related to the dollars to be spent on this project
surfaced. TheJuly, 1995 issue of Quality magazine offers great insight to the
costs, as well as the applications of over 350 different manufacture's software
packages; all of which are related to quality. Inthe "Quality Software
Directory,"
a grid format is presented indicating the abilities ofthe software
and a suggested retail price.
The technological dimension of this project was looked at very simply.
The system desiredmustbe DOS based, easy to use and provide simpleyet
meaningful reports for the management team. When reviewing the the
directory, key components of the software capabilities were that it provide
control charts, run charts, histograms, Pareto diagrams, distribution charts,
scatter diagrams and a summary of statistics. These specificreports/diagrams
are consideredby the management at the Lodge at Woodcliffto be easy to
create, understand and provide sufficient feedback for defect management. It
was found that the majority of the softwares on the market are focused on
manufacturing /engineering. Furthermore; very few manufacturers of
From the standpoint of the operator of the system, ease of use and the
availability oftechnical support sits high among priorities. Due to this lack of available training, software that is easy to use, as well as it
being
wellestablished in industries was sought. This would enable support fromthe external environment (other users of the same software in the local
community).
Viewing
this project as an investment is simple to do. The discoveryof organizational growth in terms of financial strength is supported by the gains in stock value of those companies who had received the Malcolm
Baldridge National Quality Award. From an unspecified month in 1991 until September 1, 1994, stock of organizations who had received the Baldridge Award rose 99% whileDow Jones Industrials rose 41.9% and Standards and
Poors rose 34.1%. (Helton,1995) The financial growth in such companies can
directly
be related to quality initiatives placed within each organization.Further support for the implementation of an information processing systemis highlighted by common characteristics withinBaldridge Award recipients. In each of the organizations receiving the Baldridge Award, training programs focused on the application of quality tools and techniques. This led to organizational growth, increased awareness of theprocesses
occurring within the organization and higher standards of quality.
At the beginning stages, one must ask themselves; what can such a system do for our organization? In simple terms, develop greater
awareness of the variation that is present in the organization, provide
feedback to make better decisions for which to combatdefects and
develop
an understanding of the adhesive that links the processes within anyorganizationinto a system.
While conducting research, one article that stood out as providing
reason for such a system. "The Role of StatisticalThinking in Management,"
which appears intheFebruary, 1995 issue ofQuality Progress (Hare, Hoerl, Hromi, Snee, 1995) clearly states the advantages given to management who
perform workfunctions based on statistical feedback. Three objectives of
statistical thinking as outlined
by
the article are "process thinking,understanding variation, and using data whenever possible to guide
actions."
Process thinking encompasses the theories that all workis an
interrelated string of events or processes, in which the majority of defects
occur. The affective manager looks to correct the process in order to engineer
a system that delivers the end product mamtaining the desired quality.
Within the processes taking place, there is variation. This is considered a
given parameter. Statistical thinking strives to understand the variation;
thus reducing it to the most minuscule amount. Understanding the
variation is derived from data retrieved throughout the system (linked
processes). Facts based on the correct amount ofinformation guide actions
aimed at improvements to the system.
Educational support which will conclude this project is enhanced by
the writings of Peter Mears Ph.D. Mears authored "Quality Improvement
Tools and Techniques." Here can be found a simple, progressive introduction
into the uses of quality tools and techniques, such as control charts, Pareto
diagrams, histograms, scatter diagrams, and distribution charts. Writings
detail how these tools/techniques are created; starting with the origin of the
data and followed up with an explanation of the significance and meaning of
the representative chart/diagram. Comprehensive review of the tools/
are applied, and
whythey are applied.
Additionalsupport pertaining to the statistical background associated
withthe education process is provided by the writings ofBob. E. Hayes and
A.C. Rosander. Hayes provides indepthstatistical knowledge, most of which
focuses on the validity ofthe data collected, and the reports derived from the
data. Rosander provides excellent examples of practical application for the
quality tools/techniques. It is through valuable application ofthese
tools/techniques that the statistical thinking process begins. Statistical
thinkingis developed as a behavior. By using the quality tools/techniques,
behavioral patterns will change and create an environment seeking
opportunities for which to apply quality tools and techniques.
(Hare, Hoerl, Hromi, Snee, 1995)
There is yet one issue which cannot be left out. This is the contribution
of all those involved in this information processing system. There has to be
some physical labor involved withthis system. Whether itbe the people
who collect the data, the personwho creates the data file on the computer or
those who receive the reports generated by the information processing
system; the commitment of all involved is necessary for success. The key to
this is that members are ensured that they will be heard, and that their
contributions will be respected. (LoSardo, Rossi, 1993) Barriers of
participation mustbe taken into consideration. These may consist of lack of
educationregarding statistics, fear of identificationof problems in one's own
work area, conflicting goals, personal grievances or the employees may be too
close to the problemto recognize thatone exists. "At the Service Quality
Frontier: A Handbook for Managers, Consultants and Other Pioneers"
dedicates an entire chapter to this issue;
identifying
techniques to be used ingaining commitment of those involved in the process.
In an article written
by
Jaclyn R.Jeffrey
(1995), entitled "Preparing theFront Line,"
motivating employees is labeled as one of three
key
elements toproviding excellent customer service. In the fourteen organizations researched for this article, it found that one way these companies are
motivating employees is to give them the information, skills, tools, and
knowledge to performtheir jobs effectively. When this is done; we see a
paradigm shift. The manageris now servicing the employee. At this point
we created an empowered employee with the confidence to perform at the
desired standard and with the goals ofthe organizationin mind.
Through active collection of data, analysis of that data, and making
decisions based uponthat data, managers can successfully move forward into
Chapter
Three
Stage
One
Stage One ofthis action researchis to make the decision of what
computer and software to buy based upon a review of literature related to
technology issues and perform a simple price benchmark study. The
technology issues looked at included softwares, systemrequirements,
compatibility and capability of softwares that provide statistical analysisin a
variety of forms. A simple price benchmark study was performed to
determine which software and hardware combination is most affordable as
well as functional.
Both internal and external influences had a part in deciding what
computer and softwarewas to be purchased for the Lodge at Woodcliff.
Outlined below are these influences and an explanation of what part each
may have played in the decision making throughout stage one of this project.
Present Operating System
The Lodge atWoodcliff presentlyuses DOS base computers
throughout the operation. Staff members who use computers as part
of their daily job routine are familiar with DOS applications. Therefore
itwas decided that a DOS base computer wouldbe used to performthe
statistical analysis work at the Lodge at Woodcliff.
System Requirements
It was also determined through past experience and projected
future needs that the computer systembe at least 16K insize to store
large data banks ofstatistics, operate statistical analysissoftware, as well
as many other software applications associated withthe operations of
the Lodge at Woodcliff.
Compatibility
The Lodge at Woodcliffuses Microsoft Windows to set up
the desk top computer systems throughout the resort. The
chosen statistical analysis software mustbe compatible with the
presently used Microsoft Windows.
Capability
At the time ofthis study, datarelated to defects in service
had been collected from various departments at the Lodge at
Woodcliff. Initially the purpose ofthe statistical analysis was to
reduce defects. Defect management maintains a reactive
position, as it focuses on what has already takenplace and
requires a rather longperiod of time to collect alarge data
sample and analyze the output of the 'system.'
When selecting the statistical analysis software for the
Lodge atWoodcliff, the future needs ofthe organization had to
be taken into account. The Lodge at Woodcliffnot only needed
to work on defectmanagement, but also develop a proactive
strategy for managing service defects. Time andlabor needs tobe
reduced to initiate this proactive effort. The software for this
transitionshould be capable ofproviding statistical reports such
Lodge at Woodcliff to become proactive in its quality efforts.
Software
TheJuly, 1995 issue ofQuality magazine offers great
insight to the costs, as well as the applications of over350
different manufacture's software packages; all of which are
related to quality. Inthe "Quality SoftwareDirectory,"
(Appendix A) a grid format is presented indicating the
capabilities ofthe software and a suggested retail price. Itwas
determined that the best software to perform the statistical
analysis would be Minitabs. Minitabsis able to produce
reports associated with defect management, as well as provide
the valuable reports such as run charts, control charts and radar
charts.
Early inthe research, it was realized that the primary
operator of the information processing system was quite
intimidated by the idea of statistical analysis. In the long runof
the project this did not turnout to be a problem. None the less,
this had to kept in mind throughout the project. When deciding
which software to use for this project, those that are more
'user-friendly'
certainly offer a greater potentialfor success. One
additional concern related to choosing software for this project is
that outside
help
be readily available. This may be sought fromindustry professionals, educators and students. Therefore, it was
important to use a software that is commonly used in various
settings.
Price Benchmark Study
A very simple price benchmark study was performed in the
Rochester, New York area. The purpose ofthis was to determine
where to purchase the computer system inorder to receive the best
value for the price. Three major computer retail stores were visited.
The three stores visited are Comp USA, Computer City and Lechmere.
The decision was made to make the purchase at Comp USAbecause
the value of the service, warranty and capabilities of the particular
system exceeded those of the other two retail stores.
Organizational Focus:
There may be many elements which contribute to the
successfully transforming any organizationinto a quality focused
organization. Some of the more critical elements which apply to this
research may be knowing whatquality service is all about,
understanding sampling, mastering basic tools, process thinking,
involve people and lastly know how to apply all of these theories.
(LeFevre, 1989) These subjects will be discussed furtherin Chapter
Chapter
Four
Stage Two
The second stage of this project focused on installing the computer
system and most importantly training the operator of the system.
Installingthe System andSoftware:
Installing the computer system and software is a much smaller
task than one can imagine. When the computer system was
purchased, the installationservice was included in the price ofthe
computer system. Installing the software was as simple as following
the software manufacturer's directions and loading disks into the
external drive ofthe computer. The software has the capability to place
its own
functioning
system into the proper file(s) for operation.Installing the system and software turned outto be extremely easy.
Training the Operator
The bigger task to accomplish during StageTwo ofthis project is
to train the operator of the system. As stated earlier, the primary
operator ofthe system, Jose Abarca, expressed anxiety overthe idea of
statistical analysis. Due to this concern, it was decided thattraining the
operator had to come in small steps, while avoiding technical terms
associated withstatistical analysis.
While most statistical software may seem difficult to use,
Minitabs has provenin both private and educational settings to be
easy to operate as well as be
highly
functional. Having fun andgenerating useful information using Minitabs was the tone set for
time spent training the operator. It was not hard to convince the Jose Abarcathat using Minitabs canbe fun as well as educational and
inspiring. It now seems that collecting data and analyzing it has turned
into a 'hobby' for those atthe Lodge at Woodcliff. The toughest
question asked is, "What else can I
measure?"
Familiarity:
On the agendafor the first meeting withJose Abarca was to familiarize him with the ease of Minitabs. After spending
an hour creating fictitious spread sheets of data and converting theminto visual tools, Jose Abarca that using Minitabs to do
statistical analysis is extremely easy. It wasn'tlongbeforehe felt comfortable using Minitabs and seeking opportunities to exercise his new skills.
Pareto Diagrams:
The focus ofthe second meeting with Jose Abarca was on
understanding the meaning of the generated information. Creating Pareto diagrams withMinitabs is effortless, but
understanding exactly what important information they contain may notbe effortless to everyone. AppendixB contains the educational materials used to explain Pareto diagrams to Jose
Abarca, as well as being offered as training tools forthe
Jose Abarca, Pareto diagrams simply provide information
highlighting
the major contributors to the subject beinganalyzed. (Mears, 1995) This tool allows any organizationto
choose a starting point for problemsolving, monitoring success
oridentifying thebasic cause of a problem. (Brassard,1988) The
illustration in Figure 4.1 is an example of how the Pareto
diagram may be used. Data hasbeen gathered on the subject of
defects occurring in the rooms division ofthe resort. A Pareto
diagram such as the one below may be created using the collected
data.
Rooms Division Complaints (Figure 4.1)
100%
A: Room not clean
B: A/Cnot working
C: Television not working
D: Desk staff not courteous
E: No hotwater
As illustrated by the above Pareto diagram, the most
frequently
occurring complaint pertains to guest rooms notbeing
sufficiently cleaned. The second mostfrequently
occurring complaint pertains to the A/C not working
properly in the guest rooms. This indicates that trouble shooting
energy should be focused on properly cleaning of rooms and
correcting the A/Cproblems.
In order to monitor successes related to these individual
subjects it is necessary to compare data collected during different
time periods. This will indicate if problem solving efforts have
beensuccessful.
UsingPareto diagramsto identifybasic causes to a
problem may involve the use of process flow charting.
Understanding the process taking place in order to clean a guest
room may
help
to identify the root cause of the problem.Pareto diagrams can offer a variety of information;
valuable to measuring the quality services/goods in any
organization.
As stated earlier, additional educational materials are
contained in Appendix B. These materials demonstrate the
versatility ofPareto diagrams for use in the various departments
Control Charts:
The second meeting with Jose Abarca detailed the creation
of control charts with the use of Minitabs as well as the
significance of the information contained within these graphic
illustrations. A control chart is essentially a visual display of a
process, indicating whether or not the process is within statistical
control. The data contained within the graphic illustration
represents samples taken over a period of time. A simple
example ofhow a control chart could be used is givenbelow.
The subject being analyzed is the number of dinner reservations
received for the dining room atthe Lodge at Woodcliff.
# of Dinner Reservations in Dining Room (Figure 4.2)
UCL
AVG
LCL
Date 2/1 2/2 2/3 2/4 2/5 2/6 2/7 2/8 2/9 2/10 2/11 (1996)
As illustrated in Figure4.2, on the day ofFebruary 6, 1996
there was a unusually great number of reservations taken for
dinner service in the dining room, reaching beyond the upper
control limits (UCL). On the date ofFebruary 8, 1996 there was
an unusually low number of reservations taken for dinner
service in the
dining
room, reaching beyond the lower controllimits (LCL). The use of this informationis to identify out of
control occurrences, such as the two dates identified, as well as
highlight trends which may occur. These out of control
occurrences as well as trends may be causedby avariety of
reasons which can be identified through examination of the
variables which effect the process. The next logical step here may
be to chartthe collected data as itrelates to particular days ofthe
week. This may lead to further identification of out of control
processes ortrends.
Additional educational materials related to control charts
offered in Appendix B.
Radar Charts:
The purpose ofthe final meeting withJose Abarca was to
discuss radar charts. Radar charts are aform of pie chart which
have data plotted along the the slices fromthe center of the pie.
Each slice is representative of a question. The response to the
question is the datapoint plotted. Figure 4.3 is a radar chart
illustrating the responses that may have given by guests who
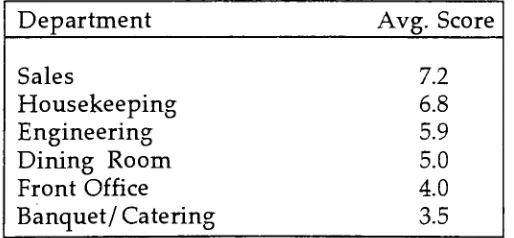
had attended a banquet function.
Figure 4.3 indicates that guests were most satisfied with
the friendliness ofthe staff, identified
by
a score of6.8. Guestsbanquet function, identified
by
a score of3.9. What this radarchart tells us is that efforts should be made to enhance the
atmosphere of the banquet facilities.
Radar charts afrequently used to
display
data retrievedfrom surveys using a LikertScale to capture the level of
satisfaction of customers. There is a great possibility that in the
future, Jose Abarca will be analyzing survey data with thehelp of
Minitabs. Radar charts are just one simple
method by whichsurvey data canbe quicklytranslated into a
more meaningful form.
Figure 4.3 Radar Chart ofBanquet Function Survey
Friendliness
Atmosphere
Value
Responsiveness
25
Accessibility
Chapter
Five
Stage
Three
Stage Three of the proposed project is to integrate the information
processing system throughout the resort. The actual actions taken to
integrate the system must to be initiated
by
themanagement of the resort.More interesting to the process of integration may be the resistance to
conform. As it is difficult to fully participate in the process ofintegration,
valuable information related to successfully accomplishing the task may be
soughtto better the chances of success.
Integration:
Resistance to Conform:
Instituting change in any environment is not an easy task.
Resistance to conform is a natural reaction of many employees that
have been working in an environment with a strong hierarchal
structure. Asking them to communicate
freely
and provideinformation about their work without fear of punishment for less than
adequate performance is a toughconcept for many employees to
buy
into.
Creating the Right Environment:
Because of the natural resistance to conform, it is necessary to
empathy.
Speaking
the truth and presenting real scenarios related to theprocesses taking place in an environment helps everyone involved in
process improvement efforts to understand the challenges faced
by
each individual on a
day
to day basis. The more details an employeecan provide about their work environment, the more likely it is that
others can contribute to the improvement of that environment. A
realistic
display
of the work environment and its processes is a greatstart to process improvement.
Developing an understanding within each individual that they
are accountable for their work environment and the processes
contained within it is very important to conformity. When getting
together to discuss practices that take place in an environment, it
should be done with the understanding that only they knowthat work
environment well. Afterall, they are the owners of that work station.
Measure the changes that occur under the control of each individual in
that environment. The successes that come to exist in that work
environment are due to their hard work, and commitment to make
improvements. Because they own the process, they shall celebrate its
successes.
In order to fully understand the challenges faced within any
work environment, it is vital that those coaching teams through
process improvement put themselves in the shoes of others. Imagine
yourself in their positions, performing the same tasks they do
everyday. Canyou feel their sense offrustration? What can be done to
better that work environment? Can you understand how the process
came to exist in its present form? Is it in need of total reengineering or
just some minor adjustments? By understanding the challenges faced
by
those individuals, one can better understand the tasks needed to beperformed to make improvements. This understanding is known as
empathy.
Management's Challenge:
It is the challenge of the management team at the Lodge at
Woodcliff to create an environment rich in honesty, accountability,and
empathy to start the improvement process. Without these principles
in place, itwould be a waste of energy to implement any quality
initiatives within their work environment. Soliciting buy-in from
employees has to be sincere, rewarding and inspiring. Like marketing
any intangible product, quality has to have its positive impacts
enhanced. Throughfree communication of the challenges to be faced,
aligning individuals with organizational goals and displaying the
rewards, an organization with a 'quality first attitude may transpire.
For all the techniques, training or ideas that may exist in an
organization, none of them will prove to be affective if the people
within the organization can't work together for a common reason.
(Lizard, Ross, 1993)
Organizational Focus:
As mentioned at the end of ChapterThree, the writings of Henry
LeFevre suggest that therebe six critical success factors which mustbe
quality focus. Discussed here are the six elements which can have an
impact on the survival rate of quality initiatives.
Knowwhat QualityService isAll About:
To initiate quality, we must have a strong understanding
of what quality is. Quality varies
depending
on the industry,market, organization, organizational goals, competitors
standards and mostimportantly, customer standards. Having a
firm understanding of expectations and how quality is affectedby
outside variables allows us to focus our efforts on the important
issues which contribute to the processes which take place within
our environment.
UnderstandingSampling:
Sampling is a importantpart to collecting valid data to
measure quality. Continuous sampling:
allows forless disruption to a process due to smaller
sampling sizes.
accelerates responses to problems and efficiency to
solving those problems.
identifies quality performance in terms of workers, steps
in a process or meeting workstandards.
identifies special needs that may require additional
tiaining, redistribution of work tasks or resources.
helps to set realistic goals which fluctuate
depending
onfeedback and reward milestone achievements.
MasteringBasicTools:
Researchhas told us that one of the factors contributing to
the success of individuals within theirjobs is the mastering of
quality tools. (Jeffrey, 1995) Providing workers with the tools to
succeed is important. Just as important may be the inspiration
provided to workers to applythese tools and make them part of
their everyday work environment. It is important to fully
understand and know how to apply quality tools.
Process Thinking:
Understanding the steps which take place in a process
make it easier to apply quality tools. Identifyingmeasurements,
knowing
what tool tobe used to determine level of quality beingmaintained and where opportunities for improvement exist are
all part of process thinking.
Involving People:
Single-handedly is not the approach to take when looking
to yutiate a quality campaign. There are owners of the processes
which take place in a work environment. Consulting those
closest to the processes often provides the most realistic
understanding of the process itself. Reach a level of
accountability forwhattakes place during a process. This will
facilitate participationin quality efforts. To state goals and
monitor the rate of achieving them is not enough. Surround
coaching sits high on the list of priorities.
Knowhow toApplythe Critical Success Factors:
Adjusting and fine tuning play a major role in the
implementation of any quality initiatives. Custom fitting the
previously mentioned critical success factors into your
organization requires a great understanding of your organization
and the dynamics contained within it. Applying these critical
success factors differs in every case. The role ofmanagement
during
the initial implementation may be to educate everyoneinvolved about what the goals of such new practices are, how
the changes in their environment will affect them and the long
termimpacts it mayhave. Educating the workforce maybe the
adhesive which transforms an organization into one with a
'quality first,
'wholistic'
organization.
Education:
Educating and training people how to succeed in a new environment is
very important. Essentially, the rules ofthe game are changing. (Marecki,
1995) Integrating new strategies into a work environment means that there is
reason to support employees with new tools for success. When instituting
quality strategies in the work environment at the Lodge at Woodcliff, quality
tools can aid in the rate of success of those individuals working in the
environment. Supplied in the appendixes of this written report are
materials which canbe used during educational seminars.
By giving staff members astrong understanding ofquality tools and
their uses, the Lodge at Woodcliff is one step closer to implementing its
information processing system. To reiterate the writings of Hare, Hoerl,
Hromi and Snee; actions based uponstatistical dataprovide managers with a
higher rate of success. These qualitytools will provide managers with the
statistical reports needed to make good decisions based on the data.
Identifying Measurements:
Identifying
measurements is not a difficult task. There are somany opportunities to collect data related to the many processes that
are taking place within any environment. What is most important to
identifying
measurements is that the data collected is capable ofproducing information of value.
Takingmeasurements related to the steps in a process help to
understand where the opportunities for improvement exist within
that process. To begin this process of identifyingmeasurements, it is a
good idea to map out or flow chart the process being studied. Whenall
the steps withinthe process have been laid out, we canlook at each
one individually and determine what makes each step successful in its
contribution to the process. Question the integrity of each step in terms
of its cost, time efficiency, laborusage or even its impact on the other
steps within the process. With a focus on service industries, move
yourself through the process as ifyou were creating the service.
Fully understanding the the process which creates the service
allowsyou to feel the impact ofinefficientsteps within the process. To
identify the measurements within the steps, sense the restraints which
exist and ask yourself, 'how do I measure this restraint?'
issue or perhaps multiple steps
being
accomplished at once? Is thiscosting more money than it should? Does the output ofthis step have
certain quality goals that should be monitored? What is the
measurement of that goal?
Once measurements are identified, we can move into the uses of
quality improvement tools and techniques. Without the focus of what
is the subject to be measured, a lot oftime canbe spent collecting
meaningless data and generating meaningless reports. That is a
practice as useless as notusingthe data at all.
Background Information Related to QualityTools:
What are the quality tools which willbe used to measure quality
at the Lodge at Woodcliff? What do these graphic illustrations
represent? How can we use them to make decisions? Do these
statistical reports provide us with information about the future? Are
there various ways to apply these tools in our environment? These
questions will be answered for each of the quality improvement tools
focused upon.
Pareto Diagrams:
A Pareto diagram is a graphic illustration ofthe
conditions which contribute to a problem. It is represented in
the form of abar chart. The primary purpose of the Pareto
diagram is to identify the major contributors to a problem.
By identifying the major contributors to a problem,
decisions canbe made as to where to direct efforts that will have
a significant impact on the reduction of the problem.(Brassard,
1998) By comparing charts of the same data from different
periods of time, it is possible to recognize improvements,
negative impacts or trends that may exist.
Pareto diagrams can be valuable inmany work
environments. Pareto diagrams can be used to identify
contributors to problems occurring injust about any process.
(Brassard,1988) Pareto diagrams can
help
to see where futureimprovement efforts are going to be focused. When trends are
recognizable withinPareto diagrams, we can develop an
understanding of whatmay happen downthe road. Trends are
not always accurate, but certainly offer some informationof
value. Because trends focus on past patterns, they suggest what
may occur in the future.
Some examples of the uses ofPareto diagrams are
described in AppendixB.
Control Charts:
A control chart is a graphic illustration representing the
variability contained within a process. Its primary purpose is to
determine the consistency of a process over a period of time.
Control charts contain upper control limits (UCL) and lower
control limits (LCL), which are statistically determined. When a
process falls outside those limits, it is known to be out of control.
One ofthe truly attractive aspects to using control charts is
thatthey do not need alarge sample ofdatato be collected.
Control charts are generated using a small sample size to
determine the consistency of the process being examined.
Control charts are used to make the decision as to whether
or not a process is out of control. In other words, when a process
is altered
by
one or more of the variables within it, it may falloutside ofthe control limits. This indicates that the process is in
need of examination. This may be the first step to identifyingthe
root causes of a problem. Identifying the root causes may call for
the employment of other quality improvement tools which
more closely examine the variables contained within a process.
Trends which exist within control charts indicate that the
variables which alter thequality of a process may be cyclical. We
can view the reoccurrence of the kind of defectwhich creates a
trend and learn about its existence. Byunderstanding when and
how a variable affects theprocess
being
studied,we can reducethe impact it may have on the process.
Some of the environments where control charts may be
used are manufacturing, health care, insurance, human
resources, food service, and even urban development.
Some of the more typical applications of control charts
within a resort environment are presented in Appendix B.
RadarCharts:
Radar charts are a formof pie chart
illustrating
the scoresof a survey whichhas been conducted. Decisions can be made
based upon the changes of scores over time, the prioritizing of
categories or the needs of customers.
There is an endless variety of ways to employ radar charts
ina resort setting. Figure 4.3 suggests thatitbe used to analyze a
survey conducted related to banquet functions. Radar charts can
be used to view the differences inscores betweenmarket
segments at the resort, perceptions of service quality between
departments at the resort or the different levels ofjob
satisfaction throughout the staff at the resort.
Radarcharts are easy to produce and can give a glimpse of
the here and now. Using radar charts to understand the future is
more difficult. Market changes, changes in work
environments and implementation of strategies can have an
affect on the responses received on surveys. We can use radar
charts to identify the affects ofthe changes and forecast the
reactions to such changes.
Some of the more simple applications of radar charts that
Chapter Six
Summary,
Conclusions
and
Recommendations
There may be many ways to institute quality within any organization.
One of the many tools needed to determine quality is measurement. At the
Lodge at Woodcliff, the implementation of an informationprocessing system
is certainly a value added to the qualityefforts
being
employed.Claiming to provide 'World Class' service without the ability to
providethe data to supportis has been a practice at theLodge at Woodcliff.
With the
help
of this information processing system, management at theLodge at Woodcliff can not only support their claims, but monitor the
changes that occur as well as look forward to the futureby recognizing and
understanding trends within their environment.
Summary:
In Chapter One, we discussed the thirteen points which
comprise this study. The most note worthy contributors to this section
of the document are the problem statement, the proposed task, the
purpose, the significance of theresearch and the procedure/
methodology. The linking of these five elements form the foundation
for the study. When reflectingon the writings, it is difficult to ignore
the interdependence of these elements and their substantial
contribution to the overall task at hand.
Linking together the thirteen points of rationale from Chapter
One is the review of literature, contained in Chapter Two. A
simplistic approach was adhered to when researching the theories/
practices which support the implementation of an information
processing system. A great deal of emphasis was placed on keeping the
action research simple, easy to understand and well within the mental
reach of those
benefiting
from its existence.Chapters Three, Four and Five represent the procedure/
methodology guidelines worked within for the project. Outlined
below are the subject matters which started out as a mental model and
finally
transpired into writings.Chapter Three- StageOne:
Research the organization's needs.
Research the information processing system's needs.
Benchmark the cost factors associated with the purchase
of the information processing system.
Organizational Focus
Chapter Four- Stage Two:
Install the information processing system.
Train the operator on the operations/applications of the
system.
ChapterFive- Stage Three:
How to identify what to measure.
Integrate the system:
Focus on resistance to conform.
Chapter Five- Stage Three (cont.):
Management's Challenge
Organizational Focus
Organizational Focus (critical success factors)
Know what quality service is all about
Understand sampling
Mastering basic tools
Process thinking
Involving people
Know howto apply critical success factors
Education
Identifying Measurements
Quality improvement tools:
Understanding of tools:
What are the tools?
What do these graphic illustrations
represent?
How canthese tools be used to make
decisions?
What are the various ways to apply
these tools in a working
environment?
Conclusions:
Previous research supports the theory that
developing
a goodunderstanding of quality tools and their applications among employees
will increase job satisfaction, provide valuable tools needed to succeed
in a work environment and most importantly, motivate employees.
Qeffrey, 1995)
Integration of this information system and all the possible
quality initiatives which accompany it is a difficult process. The keys to
bringing
this research a reality may be a change in the workenvironment in terms of how personnel operate on a day to day
basis and educating everyone involved in the quality efforts
being
employed.Recommendations:
Because the Lodge at Woodcliffhas not had the ability to
transform raw data into meaningful information, recommendations
could be endless. Keeping recommendations simple is very
important, so those involved with the project at the Lodge at Woodcliff
are not overwhelmed.
The work environment at the Lodge at Woodcliff must undergo
some changes. An environment conducive to continuous
improvement and lateral communications must be created. This may
start with an education process. This education process should notbe
limited to management. Sharing the wealth ofthe education process
with all staff members may be the opportunity to breakdown barriers
between management and staff;
leading
to open communication.An education process related to the implementation of this
information processing system at the Lodge at Woodcliff should take
involved with this education process.
The focus of the training should be on:
what quality means to the Lodge at Woodcliff.
what the information processing system do.
how to identify measurements.
what is meant by quality improvement tools.
defining the logistics of quality improvement tools
what they represent
how decisions canbe made using these tools
how to apply quality improvement tools
what quality improvement tools tell us about the
future.
During the education process develop three key elements. These
elements are necessary for quality improvement. These three elements
are honesty, accountability and empathy.
Before venturing into un