Evaluation of efficacy of Dried Blood Spots (DBS) as compared to
plasma samples for the detection of HIV-1 drug resistance
mutations
CERTIFICATE
This is to certify that the dissertation titled, “Evaluation of efficacy of Dried Blood
Spots (DBS) as compared to plasma samples for the detection of HIV-1 drug
resistance mutations” is the bonafide work of Dr. Priyanka Sabu in partial fulfilment
of the rules and regulations for the M.D. (Branch- IV Microbiology) examination of
the Tamil Nadu Dr. M.G.R. Medical University, to be held in May 2018.
Dr. Rajesh Kannangai Dr. V. Balaji
Guide Professor and Head
Professor and Head Dept. of Clinical Microbiology
Dept. of Clinical Virology Christian Medical College
Christian Medical College Vellore- 632004
Vellore- 632004
Principal
Christian Medical College
DECLARATION
I hereby declare that this MD dissertation titled “Evaluation of efficacy of Dried Blood
Spots (DBS) as compared to plasma samples for the detection of HIV-1 drug resistance mutations” is the bonafide work done by me under the guidance of Dr. Rajesh
Kannangai, Professor and Head, Dept. of Clinical Virology, Christian Medical College,
Vellore. This work has not been submitted to any other university in part or full.
Dr. Priyanka Sabu
Dept. of Clinical Microbiology, Christian Medical College,
CERTIFICATE
This is to certify that this dissertation work titled “Evaluation of efficacy of Dried Blood Spots (DBS) as compared to plasma samples for the detection of HIV-1 drug resistance mutations” was done by candidate- Priyanka Sabu (Registration no. 201514353) for the award of Degree of MD Microbiology (Branch IV). I have
personally verified the plagiarism results on urkund.com website. I found that the uploaded thesis file contained pages from introduction to conclusion and result showed
NINE percent of plagiarism in the dissertation.
Acknowledgement
I am indebted to my guide, Dr. Rajesh Kannangai, Professor and Head of the Department of
Clinical Virology for being an inspiration, an ocean of patience and a constant problem-solver
throughout the study period. Also for giving me the freedom of speech to raise my doubts,
queries, difficulties and opinions, and for sparking an interest in HIV and research as a whole.
I am thankful to Dr. Balaji, Professor and Head of Department of Clinical Microbiology for his support and encouragement.
I thank Dr. John G Fletcher, Associate Professor in the Department of Clinical Virology for
his valuable ideas given for this study.
I thank all the faculty from the Departments of Clinical Microbiology, Clinical Virology and
Parasitology for their insightful suggestions given for this study.
I thank Dr. Jaiprasath for his intellectual help and guidance.
I am immensely thankful to Mrs. Veena Vadhini for patiently and efficiently teaching me the basics, for being a part of all the brainstorming and troubleshooting that was done during this
study and for always stepping up when things went over and beyond my head.
I extend my gratitude to Mr. John Paul Demosthenes for helping me with sample collection
and teaching me sample processing. And for spirited encouragements in his booming voice
during tough times.
I am grateful to Mr. Ben Chirag Ghale for helping with the sample collection, in handling
difficult individuals and samples, and distracting me by calling my name out a few hundred
times a day.
I am deeply obliged to each and every person from the Department of Clinical Virology for
their support and help in one way or the other during the study period.
I am extremely grateful to the individuals who accepted to take part in the study.
I thank Mrs. Vishalakshi providing the statistical analysis that was needed for this study. I thank Dr. Naveen Kumar for the help and technical support provided for NGS.
I thank the Institutional Review Board and the Department of Clinical Virology for funding
the study through Fluid Research Fund and Virology Special Fund, respectively.
I am thankful to all my friends, both near and far for lending a hand and an ear, at all times.
I specially thank my friends, Dr. Jai Ranjan for always having experience on his side, Dr.
Anushree for showing how to calmly face the storm, Dr. Nitin Kumbhar for prodding me to do my work and Dr. Diviya Alex for all of the above and her precious time and intense effort.
My deepest gratitude, to Mr. Sabu Pappachan, Dr. Mercy Sabu, Mr. Thampi Paulose and Mrs.
Mary Thampi for their words of encouragement and whispers of prayers. I am indebted to
Ms. Preethika Sabu and Mr. Vinith Thampi for being voices of reason and providing
technological support. I sincerely thank Dr. Manu Thampi for his patience, reassurance, and
persistence that I can do all things through Him who strengthens me.
Thank you St. Jude.
Sl. no. Contents Page no. 1
2 3 4 5 6 7 8
Introduction
Hypothesis and Objectives Review of Literature Materials and Methods Results
Discussion
Summary and Conclusion Bibliography
1 4 5 39 60 87 98 101
1 1. Introduction
Human immunodeficiency virus (HIV) infection can lead to a clinical disease spectrum
extending from being asymptomatic to advanced immunological incompetency as a
consequence of quantitative and qualitative inadequacy of T lymphocytes resulting in a stage
known as Acquired Immunodeficiency Syndrome (AIDS), where the affected persons are left
susceptible to a host of life threatening opportunistic infections and malignancies which
account for most of the symptoms seen in HIV infected individuals (1). Since it was first observed in 1981, HIV infection has turned into an explosive pandemic which has left no
region of the world untouched, causing significant morbidity and mortality (2).
HIV is a diploid single-stranded RNA virus belonging to the family Retroviridae and genus
Lentivirus. There are two types of the virus – HIV-1 and HIV-2. The former, identified
separately in Paris and United States, is responsible for approximately 99% of all human
infections globally (3). The latter, isolated in 1986 in West Africa (4), is associated with lower levels of viremia and transmission rates and also has a slower progression of the disease when
compared to HIV-1 (5).
HIV is transmitted through unprotected sexual intercourse, parenteral route by transfusion or
through sharing of needles and from a mother to her child during pregnancy, during childbirth
and breastfeeding (6).
Though there is no cure for HIV infection, appropriate treatment with antiretroviral drugs can
control the virus and suppress its replication, turning a fatal disease into a lifelong chronic infection. The number of AIDS related deaths (ARD) and associated morbidity have been
remarkably reducing over the years. This fall corresponds with the worldwide increase in
access of people living with HIV to antiretroviral therapy (ART) from 7.7 million in 2010 to
2 easy and free access to ART (8) with approximately 1.04 million individuals receiving ART
in India, having a coverage of about 49% among people living with HIV as of December 2016
(9).
However the advent of drug resistant mutations has put the long-term management of
HIV/AIDS at risk. Thus making resistance testing among ART-experienced individuals who
are failing their current regimen, crucial. Also the use of resistance testing in the choice of the
initial therapy has proved to result in a greater decrease in viral load and is cost-effective. Additionally it is important in the monitoring of individuals on treatment and for surveillance
of drug resistance in the community to help select appropriate treatment regimens (10) (11).
Following the trends in disease evolution has shown that HIV-1 drug resistance testing is a
decisive part in the management of HIV infection.
Of the two methods available to test for HIV resistance, genotypic assays are the gold standard
and plasma is the most appropriate clinical sample (12), since it is known to have HIV-1 RNA at higher and more stable levels than serum and whole blood (13). Also, it should be collected
while the patient continues to be on the failing ART regimen to sustain the selective pressure
on the viral populations (14). Plasma samples must be separated from blood cells within 6
hours of collection to prevent RNA degradation and is to be stored at -70⁰C until the time of
testing (12). These genotypic assays are available only in select laboratories in India. The lack
of adequate facilities and equipment, and the effort involved with maintaining the cold-chain
of plasma during transportation and storage at the tropical temperature, leaves the resource-limited settings incapable of managing HIV-1 infected individuals satisfactorily (15).
Alternate, practical and reliable means to obtain, store and transport blood samples are
essential to develop cost effective assays in such settings. Dried blood spot (DBS) is being
3 onto a DBS card, its storage at room temperature and transport to reference laboratories at
ambient temperature has made DBS an appealing sample for HIV-1 drug resistance testing
(15).
Many studies have reported the successful genotyping of HIV-1 from DBS and some have
shown a high genotypic concordance with plasma genotypes. During the past few years DBS
has started to be used widely for HIV-1 drug resistance testing world over and an increased
number of reports from resource-limited areas have indicated DBS as the preferred specimen for transmitted HIV-1 drug resistance surveillance where collection of plasma is not feasible
(16).
However, from India there is only minimal information available on drug resistance
genotyping assays for the detection of HIV-1 drug resistance mutations using DBS samples
stored at ambient temperature.
Furthermore, apart from the mutations in HIV RNA, additional mutations may be present in
the proviral DNA which was integrated into the host cell genome. From the plasma sample, only the mutations in viral RNA can be detected but from DBS samples, mutations in both
viral RNA and proviral DNA can be detected. And the origin of the additionally detected
mutations can be confirmed by drug resistance testing of peripheral blood mononuclear cells
(PBMC).
These reasons lead to the need to undertake a study to test for drug resistance mutations from
corresponding plasma, DBS cards and PBMC samples and to evaluate the efficacy of DBS
4 2. Hypothesis and Objectives
Hypothesis
Dried blood spot (DBS) is as efficient as plasma sample for the detection of HIV-1 drug resistance mutations.
Objectives
1) To sequence HIV-1 pol gene from plasma, DBS and PBMC to assess drug resistance
mutations in the reverse transcriptase and protease regions in individuals showing
treatment failure.
2) To compare the frequency of HIV-1 drug resistance mutations detected in plasma, DBS
and PBMC to confirm the origin of mutations.
3) To evaluate the efficacy of DBS for detection of HIV-1 drug resistance mutations in
5 3. Literature Review
3.1 Discovery
In 1981, Centre for Disease Control (CDC) released an unusual report of five previously
healthy young homosexual men who suffered from Pneumocystis carinii pneumonia (PCP)
in United States. Their case histories suggested that the cell-mediated immune system was
impaired and was probably due to a disease transmitted sexually (17). The disease was recognised as a syndrome and termed ‘acquired immunodeficiency syndrome (AIDS)’ in
1982. Already AIDS seemed to be a long-lasting illness with an extended duration between
exposure, through blood or sexual activity and the state of dramatic immune dysfunction
which was plagued with opportunistic infections or malignancies (18).
Human T-cell leukaemia viruses (HTLV) was considered to be the causative agent since the
different manifestations of AIDS were unified by a depletion of CD4 T-cells. Apart from the
leukaemia and lymphomas, HTLV also caused an AIDS-like wasting syndrome and was transmitted through blood, sexual route and from mother to child, thus justifying the
assumption. Independently, the pursuit of a HTLV-like virus in patients with AIDS was
started in the National Institute of Health (NIH), Bethesda and the Pasteur Institute, Paris (18).
In 1983, Luc Montagnier and his scientists from Pasteur Institute isolated the virus from a
homosexual patient with generalised hyperplastic lymphadenopathy and called it
Lymphadenopathy associated virus (LAV), a unique human retrovirus (19). In NIH, Robert
Gallo who had previously discovered HTLV types I and II also isolated the primary cause of AIDS and named it HTLV type III in the year 1984 (20). Around the same time, another group
of scientists from the University of California, San Francisco under the leadership of Dr. Jay
6 In 1986, the International Committee on Taxonomy of Viruses stated that the retrovirus which
was recognised as the etiologic agent of AIDS was to be renamed as Human
immunodeficiency virus (HIV) to remove the multiple names that was in circulation then (22).
The first confirmation of HIV infection in India was from female commercial sex workers at
a custodial care institution in Tamil Nadu (23).
3.2 Epidemiology 3.2.1 Global scenario
In three and a half decades, HIV has infected more than 70 million people and has led to
roughly 35 million deaths worldwide. By the end of the year 2016, there were 36.7 million
people living with HIV globally with a probable prevalence ranging between 0.7% and 0.9%
in adults aged 15 to 49 years. And mortality due to HIV-related illness for the year 2016 was
1 million people. The disease burden is variable between different regions of the world, the
worst affected being sub-Saharan Africa where 1 in every 25 adults is living with HIV which accounts for approximately 70% of people living with HIV worldwide (24).
3.2.2 Indian scenario
In India, the estimated prevalence of HIV in adults between 15 and 49 years of age is 0.26%,
according to the India HIV Estimation Report for the year 2015. The highest prevalence of
1.15% is seen in the state of Manipur which is followed by Mizoram with 0.80%, Nagaland
with 0.78%, Andhra Pradesh and Telangana with 0.66%, Karnataka having 0.45%, Gujarat
with 0.42% and Goa having 0.40%. Also Maharashtra, Chandigarh, Tripura and Tamil Nadu have an adult HIV prevalence rate more than the national prevalence. Whereas Odisha, Bihar,
Sikkim, Delhi, Rajasthan and West Bengal have an adult HIV prevalence ranging from 0.21%
to 0.25%. The remaining states and union territories have a prevalence below the national
7 peak of 0.38% in 2001-2003 through 0.34% in 2007 and 0.28% in 2012 to 0.26% in 2015
(25).
The number of people living with HIV (PLHIV) was estimated to be 22.26 lakhs in 2007 and
21.17 lakhs in 2015. Andhra Pradesh and Telangana together have the peak number of PLHIV
with 3.95 lakhs, which is followed by Maharashtra with 3.01 lakhs and Karnataka having 1.99
lakhs. These states along with Gujarat, Bihar and Uttar Pradesh make up 64.4% of the
projected PLHIV in India (8).
The prevalence among high risk groups like female sex workers (2.2%), men who have sex
with men (4.3%), transgender (7.5%) and intravenous drug users (9.9%) is assessed by the
National Integrated Behavioural and Biological Surveillance (8). However the virus nor the
disease is not limited to the high risk groups alone. HIV-1 is transmitted to the general low
risk population through a bridging population. They bridge the gap between the high risk
group and the general population and include long distance truck drivers and migrant labourers (26) who maybe clients or partners of commercial sex workers (27).
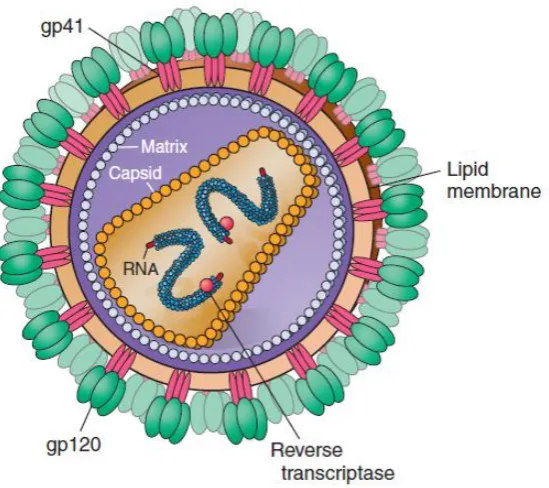
3.3 Structure
HIV is an enveloped, spherical shaped virus particle of 100 nm in size. The lipid bi-layered
viral envelope is derived from the host cell membrane and is embedded with major envelope
proteins, glycoprotein 120 (gp120) and glycoprotein 41 (gp41) which form the knob-like
surface and anchoring transmembrane spikes, respectively. In between the envelope and the
core is the matrix which is largely made of Gag protein p17. Its inner core, composed of p24 capsid protein, is cylindrical or conical in shape and contains two identical copies of single
stranded positive sense viral RNA closely associated with Gag protein p7 along with the
enzymes, reverse transcriptase, integrase and protease which are essential for replication and
8
Figure 1: Structure of HIV-1 (Adapted from Harrison’s Principles of Internal Medicine, 19th edition)
3.4 Genome
HIV-1 genome is 9.7 kbp in length and includes major genes which code for three groups of
structural and enzymatic proteins, six genes encoding non-structural regulatory and accessory proteins, which are flanked by the long terminal repeat sequences (LTR) (28) as shown in
Figure 2.
The three major structural genes are:
Gag gene: Encodes for the proteins forming the viral capsid (p24), nucleocapsid (p7),
matrix (p17) and p6.
Pol gene: Codes for the enzymes – protease (p10), reverse transcriptase (p66/51) and
integrase (p32).
Env gene: Expresses a large precursor glycoprotein (gp160) which is cleaved into surface
9 The six non-structural genes are divided into regulatory genes (tat, rev and nef) that code for
regulatory proteins – transcriptional activator (p14), regulator protein (p19) and negative
regulator protein (p27) respectively and into accessory genes (vif, vpr and vpu) that code for
accessory proteins – viral infectivity factor (p23), viral protein R (p15) and viral protein U
(1).
The long terminal repeat sequences present at both ends of the genome contain promoter and enhancer sequences that are required for initiation of transcription (1,6,28).
Figure 2: HIV-1 RNA genomic structure (Adapted from Scientific Illustration, www.scistyle.com)
3.5 Molecular classification
HIV infection was seen in human beings following zoonotic infections with simian
immunodeficiency viruses (SIV) from African primates. HIV-1 was transmitted from
chimpanzees (SIVcpz) and HIV-2 from sooty mangabey apes (SIVsm) (29).
The phylogenetic clustering of global HIV-1 viral isolates shows four groups: M (Main/
Major), O (Outlier), N (non-M, non-O) and P (30) which represent four separate cross-species transmission events (31).
HIV-1 group M is responsible for the pandemic of HIV-1 infections, due to its many subtypes
and circulating recombinant forms (CRFs). There are nine recognised subtypes of group M,
10 central Africa, each has a distinct geographical distribution and risk group association (30,32).
Subtype B is commonly seen in western Europe, America and Australia, subtype C
predominantly in Africa and most parts of Asia including India, subtype E in Thailand and
subtype F in South America (6). Within a subtype, the variation at amino acid level is 8-17%
and between subtypes it is 17-35%. Recombination of strains are seen between different
HIV-1 groups and also between and within group M subtypes. CRFs are recombinants of different
group M subtypes which were sequenced and found in 3 or more epidemiologically unconnected individuals (30,32). There are around 90 existing CRFs presently (33).
Groups N and O have been limited to a small number of people in Cameroon and in
Cameroon, Gabon and Equatorial Guinea, respectively where their prevalence is extremely
low. Group P has been identified only in 2 individuals from Cameroon (32).
3.6 Genetic diversity
The vast genetic unpredictability and rapid evolution of HIV-1 have contributed significantly to the global spread of the virus. This genetic variability is due to the considerable mutation
and recombination rates of the reverse transcriptase enzyme which does not have a
proof-reading mechanism and is accompanied by high viral replication rates. Mutations like
insertions and deletions are common in HIV-1 genome. Such mechanisms have led to the
generation of virus populations that are genetically diverse within each infected person. Viral
sequences can vary up to 10% within a single individual (32).
3.7 Replication
The principle target of HIV is the immune system, specifically, activated CD4 T lymphocytes.
The virion attaches to the host cell by the interaction of its envelope glycoprotein, gp120 with
11 and CXCR4 (31). The virus penetrates the host cell by the fusion of the viral envelope with
the host cell membrane, aided by the exposed gp41 molecule. Following fusion, matrix and
capsid proteins are digested and the viral enzymes and RNA are released into the host cell
cytoplasm. The reverse transcriptase (RT) enzyme utilizes host nucleotides and forms a
single-stranded DNA from the viral RNA, which is then transformed to a double-stranded
DNA copy (34). This double-stranded DNA is then transported into the nucleus of the infected
cell along with the integrase enzyme which inserts the viral DNA into the host cell DNA. In this state, it is called a provirus and the infection is permanent hereafter (6). It is able to
replicate using the host cell replication machinery. Subsequently, transcription takes place to
produce viral RNA and mRNA which is translated into viral proteins and processed to form
virion components in the cytoplasm of the host cell. Immature virions are assembled under
the organization of gag polyproteins at the cell membrane where the envelope and core
proteins are located. Maturation of the immature virion can occur either while it separates from the host cell by a process called budding or thereafter. The protease (PR) enzyme cleaves
the polyproteins to their functional size, thus generating a complete mature virion that is
capable of infecting another cell (34–36).
The life cycle of the retrovirus therefore involves two forms, a DNA provirus and a RNA
containing infectious virion.
3.8 Transmission
HIV can be transmitted by an active free virus or a latent virus hidden within infected cells (34). The presence of the virus in blood, semen, cervical and vaginal secretions leads to its
12
Heterosexual or homosexual sexual contact (vaginal, oral or anal) with an infected
partner.
Parenteral route by transfusion of tainted blood and blood products, organ transplants
from infected donors, sharing of needles or syringes with infected individuals or needle
stick injuries from contaminated sharps.
From an infected mother to her child during pregnancy, childbirth or breastfeeding (34).
A vast majority (90%) of the global total of HIV infections occurs through heterosexual contact even though the risk of transmission from one unprotected encounter is as low as
0.1-0.2% (6). The factors that determine the risk of sexual transmission are the plasma HIV-1
RNA viral load of the infected partner (37), the frequency of sexual contact and presence of
genital ulcers due to other sexually transmitted infections (31,38) like herpes simplex-2,
syphilis or bacterial vaginosis which may increase the risk of transmission 300 times over
(34). Pregnancy, receptive anal intercourse and behavioural features like homosexuality and
multiple sexual partners are associated with increased risk of sexual transmission whereas male circumcision with reduced risk (31).
The probability of acquiring HIV infection through infected blood products is estimated to be
> 90% (1) however, it has dramatically reduced due to the mandatory screening for
blood-borne infections prior to transfusions and organ transplantations. Owing to the practise of
sharing unsterilized needles, syringes and related paraphernalia has put injection drug users
at three times a higher risk of infection than through sexual transmission (34). The risk
depends on the duration of injection drug use, the frequency of sharing needles, the number of people with whom they are shared and such practices in a geographic setting with high
13 exposure to accidental penetrating needle stick injuries and splashes to conjunctiva, other
mucous membranes or non-intact skin with contaminated blood (6).
The transmission from a HIV infected mother to her child can take place during antenatal
period, perinatal period or via breastfeeding. The rate of transmission ranges from 15-45% if
no interventions are taken, while it is ≤ 1% with effective interventions like ART for infected
pregnant and breastfeeding mothers, a short course for the baby and good breastfeeding
practices (39,40).
3.9 Pathogenesis
The disease is characterized by severe immunodeficiency due to progressive quantitative and
qualitative depletion of CD4+ helper T cells which are the primary targets of HIV. The
observed cellular deficiency and dysfunction of CD4+ cells are due to various mechanisms
like: direct infection and destruction of the cells and/ or indirectly by immune clearance of
infected cells and immune fatigue following aberrant activation (1), as listed in Table 1.
Table 1: Mechanisms of CD4 depletion (Adapted from Harrison’s Principles of Internal Medicine, 19th edition)
Direct mechanisms Indirect mechanisms (41)
Syncytia formation
Accumulation of unintegrated viral
DNA
Alteration of plasma membrane
permeability due to viral budding
Interference with cellular RNA
processing
Apoptosis and autoimmunity
Infected cells killed by HIV-specific
immune response
Inhibition of T cell production by
thymus
Bystander killing of viral antigen-coated
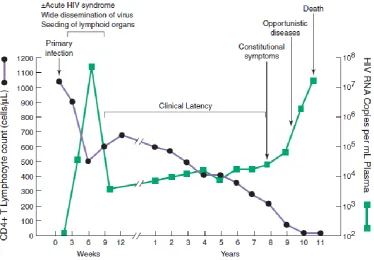
14 HIV infection generally charts the following progression. It has an acute stage of marked viral
replication and dissemination, then a chronic asymptomatic phase of continued immune
activation and viral replication and finally the advanced stage of AIDS (42).
After virus entry, there is a period of unrestrained virus multiplication in the target cells
indicated by non-specific symptoms of a viral illness like fever, fatigue, lymphadenopathy,
rash and myalgia, the high viral RNA and p24 antigen in circulation and a transient fall in
CD4+ cell counts. The viremia leads to dissemination of the virus to all the lymphoid tissue (1,6,43). Once the infection is established it persists lifelong.
Slowly the immune system responds, both viral RNA and p24 antigen fall to a level where
p24 antigen becomes undetectable and viral load gets fixed at a low level called the set-point
(6,43). In spite of the vigorous immune response following the primary infection, HIV
manages to escape immune-mediated elimination and instead flourishes on immune
activation and develops into a chronic persistent infection which may last for approximately 10 years. The inability to clear the infection completely is due to the development of
post-integration latency in infected CD4+ cells where the integrated HIV provirus remains latent
until further activation (1).
The ratio of infected CD4+ cells and viral RNA level rises as the disease progresses until the
individual becomes symptomatic. The persistent assault on the immune system impairs it,
leading to the worsening of symptoms as the immunity deteriorates and progression to AIDS. Once the CD4+ cell counts fall below 200 cells/μl, the infected individual is susceptible to a
host of life-threatening opportunistic infections which the immune system normally would
have been able to prevent and has an increased risk of various malignancies (1,34). The course
15
Figure 3: Viral load and CD4+ cell count during the course of disease in an untreated individual.
(Adapted from Harrison’s Principles of Internal Medicine, based on an original from Pantaleo et al,
N Engl J Med 328:327, 1993)
3.10 Classification of HIV
HIV disease classification and staging systems are decisive for monitoring HIV infected
individuals and their disease progression, thus guiding the clinicians with its management.
The two main systems that are being used are: the World Health Organization (WHO) clinical
staging system and the Centre for Disease Control (CDC) classification system.
The WHO system does not entirely depend on CD4 cell counts or other diagnostic tests, hence
can be easily used in resource limited scenarios (44).
Table 2: WHO Clinical Staging of HIV/ AIDS (45)
Clinical Stage Manifestations
Stage 1 Asymptomatic
Persistent generalized lymphadenopathy (PGL)
16
Herpes zoster, papular pruritic eruption
Angular cheilitis, recurrent oral ulceration
Seborrheic dermatitis, fungal nail infections
Stage 3 Severe unexplained weight loss (>10% of body weight) Inexplicable chronic diarrhoea (> 30 days)
Inexplicable persistent fever (> 30 days)
Persistent oral candidiasis, oral hairy leucoplakia
Pulmonary tuberculosis
Severe systemic bacterial infections
Acute necrotizing ulcerative oral lesions
Inexplicable pancytopenia
Stage 4 HIV wasting syndrome
Recurrent severe bacterial pneumonia, Pneumocystis pneumonia
Extra pulmonary tuberculosis
Disseminated nontuberculous mycobacterial infection
Chronic herpes simplex infection, cytomegalovirus infection
Oesophageal candidiasis,
Extra pulmonary cryptococcosis, disseminated mycosis
Chronic cryptosporidiosis, chronic isosporiasis
Central nervous system toxoplasmosis
Atypical disseminated leishmaniasis
Kaposi sarcoma
Lymphoma (cerebral or B-cell non-Hodgkin)
Invasive cervical carcinoma
Progressive multifocal leukoencephalopathy
Symptomatic HIV-associated nephropathy or encephalopathy
The CDC classification depends on the lowest CD4 cell count that was recorded and on any
17 Table 3: CDC Classification System for HIV (46)
CD4 cell counts (cells/ μl)
Categories
A* B# C†
> 500 200 – 499
< 200
A1
A2
A3
B1
B2
B3
C1
C2
C3
* Category A: Asymptomatic HIV infection, acute or primary HIV, persistent generalised lymphadenopathy (PGL)
# Category B: Symptomatic, not A or C manifestations like oropharyngeal or vulvovaginal candidiasis, herpes zoster, cervical dysplasia, fever or diarrhoea > 1 month.
† Category C: AIDS-indicator diseases like pulmonary and disseminated tuberculosis, Pneumocystis
jiroveci pneumonia, oesophageal candidiasis, extra pulmonary cryptococcosis, CMV, Kaposi’s sarcoma, lymphoma, HIV-related wasting syndrome, encephalopathy.
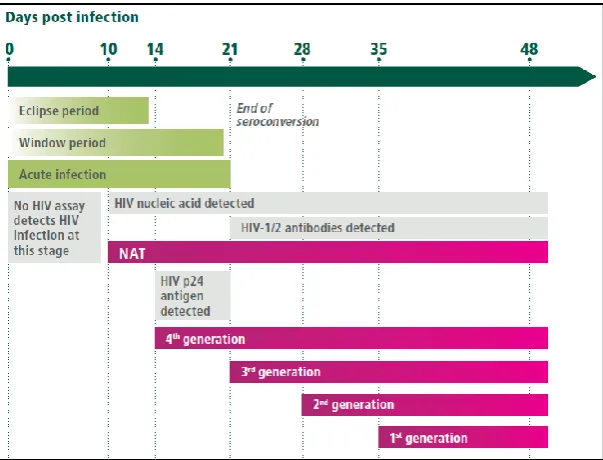
3.11 Diagnosis of HIV infection
Determining the HIV status of an infected person can be done only by laboratory testing. It
can be performed by directly detecting the presence of the virus (RNA or DNA provirus) or
viral products (p24 antigen), on the other hand, for indirect detection, the immune response (HIV-specific antibodies) to HIV infection can also be measured. The appropriate method to
be used for laboratory detection of HIV relies on its natural history and the time since
18
Figure 4: Different HIV detection methods to be used through the course of the disease. (Adapted
from WHO Consolidated Guidelines on HIV Testing Services, July 2015)
Viral nucleic acids can be detected by Nucleic Acid Amplification Tests (NAAT) like
Polymerase Chain Reaction (PCR) which target the structural genes of HIV. It is particularly
useful for HIV diagnosis during the window period when antibodies are absent, to resolve
indeterminate serology results and for early infant diagnosis when maternal antibodies are
present.
Diagnosis of HIV by detection of antibodies in serum or plasma is done using ELISA, rapid tests or Western blot (WB) following a definite algorithm. There are other approaches like
Chemiluminescence Immunoassays (CLIA) and Line Immunoassays (LIA) that can also
detect specific antibodies. p24 antigen can be detected using combination Enzyme
Immunoassay (EIA) based systems that detect antibodies as well and is useful for diagnosis
19 3.12 HIV Testing Strategies
NACO Testing Strategies
Following the detection of AIDS cases for the first time in India, in 1986 and its subsequent
spread as an epidemic led to the development of the first National AIDS Control Programme
(NACP) in 1992 and the formation of National AIDS Control Organization (NACO) to
execute the programme. NACO functions under the Ministry of Health and Family Welfare
(MoHFW) to constitute policies and implement programmes for the control and prevention of HIV infections in India (50).
The NACP-IV (2012-2017) is the programme running presently in its last year of execution.
It aims to cut down new infections by 50% and provide wholesome care, support and
treatment for all individuals living with HIV/ AIDS (8).
The varying prevalence of HIV in different population groups, specifically the low positive
predictive value (PPV) in low prevalence populations demanded the WHO/ NACO to develop precise strategies and diagnostic algorithms depending on the diagnostic tools available in the
market for the detection of HIV infection. The prevalence of HIV in a population influences
the probability of a test accurately detecting the status of an individual being tested from that
population group. The PPV or the probability that an individual who tested positive is truly
infected, increases if the prevalence is higher.
Indian testing strategies (1, 2 and 3) include a rational sequence of performing tests serially
and repeat testing originally positive samples. The tests used in the three strategies are either an ELISA or a Rapid test (E/R) and for confirmation of indeterminate or discordant results,
high specificity tests like WB and Line Immunoassays (LIA) can be used.
20 The different assays used in a strategy must be based on different principles or different
antigens. The first assay should have a high sensitivity and the successive assays should have
a high specificity.
In case of indeterminate results, a second sample is collected 2 to 4 weeks later and should be
tested by WB or PCR or referred to National Research Laboratory (NRL) for confirmation. Molecular assays may be used if the sample is repetitively giving indeterminate results (49).
3.12.1 Strategy 1
This strategy is used in transfusion and transplant screening for donor safety by performing a
single test (Figure 5) of high sensitivity. If the sample tested is reactive then that unit is discarded, the donor is notified and referred to an Integrated Counselling and Testing Centre
(ICTC) for confirmation.
Figure 5: Strategy 1 – For blood transfusion and transplant screening
3.12.2 Strategy 2 A
This strategy is used for sentinel surveillance. If the sample that is positive by the first assay,
21
Figure 6: Strategy 2 A – For surveillance
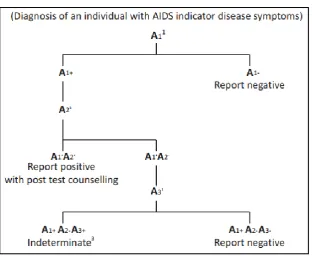
3.12.3 Strategy 2 B
This strategy is used in individuals who are clinically symptomatic of AIDS indicator
diseases. The first screening assay used is of high sensitivity. If the first two assays are
positive, then it is reported as reactive. If the two assays give discordant results, then a third
tie-breaker test is performed (Figure 7). Counselling, informed consent and confidentiality assurance is mandatory in all cases.
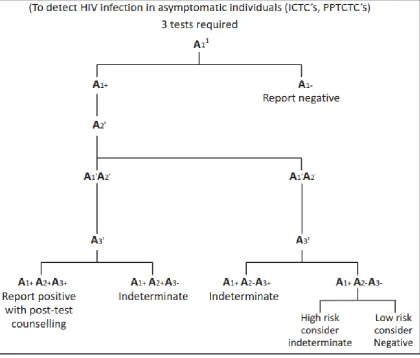
22 3.12.4 Strategy 3
This strategy is used for the diagnosis of HIV in asymptomatic individuals using an additional
[image:30.595.95.516.179.537.2]third test for samples which are positive by the initial test(s) as shown in Figure 8.
Figure 8: Strategy 3 – For testing asymptomatic individuals
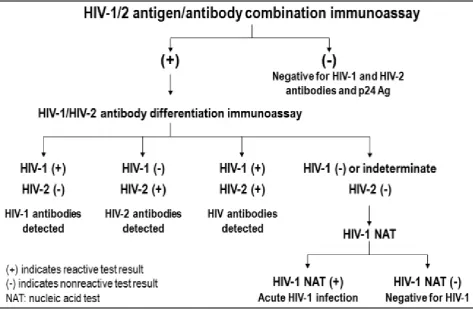
CDC Testing Strategy
In 2014, CDC released HIV Diagnostic Testing Algorithm for serum or plasma samples,
which was superior to the conventional strategy of HIV antibody screening followed by confirmation of positive results by Western Blot. The new algorithm helped to detect HIV
infection earlier and more accurately and distinguished between HIV-1 and HIV-2 infections
23
Figure 9: Recommended laboratory HIV testing algorithm
3.13 Antiretroviral therapy
3.13.1 Antiretroviral agents
Since Zidovudine, the first antiretroviral drug to be licensed became available in 1987, several newer classes of antiretroviral (ARV) drugs have been introduced with varying mechanisms
of action at different steps of HIV replication (53). Science is yet to deliver a cure for HIV
infection, however the use of combination antiretroviral regimens from 1996 has altered the
course of the disease from a progressive fatal illness into a chronic controllable disease
(31,34).
Highly active antiretroviral therapy (HAART) is the standard of care now and includes a
24 reducing replication and increase CD4 cell counts. It also lessens the chance of developing
resistance, thus providing long term effective treatment. However, patients must receive
life-long therapy in order to maintain low to undetectable viremia levels and ultimately may still
develop drug resistant viral variants (34,54).
The following are the different classes of antiretroviral drugs (Table 4):
Nucleoside/ nucleotide reverse transcriptase inhibitors (NRTIs): Act as normal
nucleoside/ nucleotide analogues and gets inserted into the growing viral DNA chain and
terminates its synthesis.
Non-nucleoside reverse transcriptase inhibitors (NNRTIs): Binds to HIV-1 reverse
transcriptase enzyme and changes its spatial conformation, thus non-competitively inhibit
reverse transcription. HIV-2 is intrinsically resistant to this class of drugs.
Protease inhibitors (PIs): Bind to the active site of protease, the enzyme that cleaves viral
polyprotein precursors during maturation of the virion.
Integrase inhibitors: Bind to integrase enzyme-viral DNA complex and inhibit DNA
strand transfer and integration into the host cell genome.
Fusion inhibitors: Bind and disrupt transmembrane glycoprotein 41-dependent fusion of
HIV virion with host cell membrane.
CCR5 antagonists: Bind to CCR5 receptors and changes its conformation such that
25 Table 4: Examples of antiretroviral agents (56,57)
Nucleoside/nucleotide analogues
Non-nucleoside RT inhibitors
Protease inhibitors Integrase inhibitors
Zidovudine (AZT)
Lamivudine (3TC)
Stavudine (d4T)
Emtricitabine (FTC)
Didanosine (DDI)
Abacavir (ABC)
Tenofovir (TDF)
Nevirapine (NVP)
Efavirenz (EFV)
Etravirine (ETR)
Rilpivirine (RPV)
Saquinavir (SQV)
Lopinavir/ritonavir
(LPV/r)
Indinavir (IDV)
Nelfinavir (NFV)
Darunavir (DRV)
Atazanavir (ATV)
Tipranavir (TPV)
Fosamprenavir (FPV)
Raltegravir (RAL)
Elvitegravir (EVG)
Dolutegravir (DTG)
Fusion inhibitors
Enfuvirtide (T-20)
CCR5 antagonists
Maraviroc (MVC)
3.13.2 Antiretroviral Regimen
ART has shown to decelerate the disease progression and benefit in prevention of HIV
transmission. This led to the U.S. Health Department to recommend ART for every individual
diagnosed with HIV infection (34).
Over the years, though the WHO guidelines of when to initiate ART in HIV infected individuals have constantly evolved, yet they were limited by the individual’s CD4 cell counts
and clinical staging of the disease. In September 2015, WHO declared that all individuals
diagnosed with HIV infection should be initiated on ART irrespective of the CD4 cell counts
or clinical stage. Its ‘treat all’ policy made all persons living with HIV (PLHIV), regardless
of population and age were eligible for therapy (58).
26 recommendation and decided to treat all PLHIV with ART irrespective of CD4 count, stage,
age or population (59).
Before the HIV infected person is initiated on ART he is clinically assessed to determine the
stage of infection, his medical history is taken to elicit risk behaviours and a detailed physical
examination is performed. Additionally a thorough laboratory evaluation is done to search for
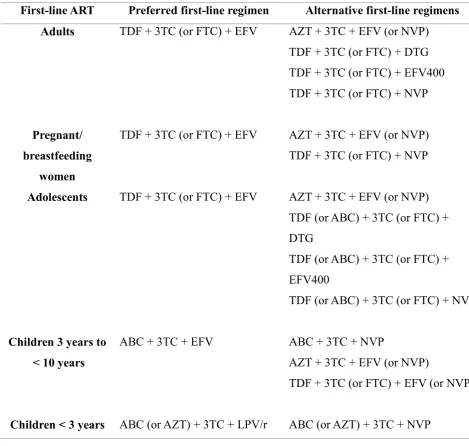
opportunistic infections and to set baseline parameters (60). Then the individual is started on first line ART regimen which usually consists of 2NRTIs + 1NNRTI (Table 5).
Table 5: First line regimen (Adapted from WHO Consolidated Guidelines on the use of Antiretroviral Drugs for Treating and Preventing HIV Infections, 2nd edition, 2016) (57)
First-line ART Preferred first-line regimen Alternative first-line regimens Adults
Pregnant/ breastfeeding
women Adolescents
Children 3 years to < 10 years
Children < 3 years
TDF + 3TC (or FTC) + EFV
TDF + 3TC (or FTC) + EFV
TDF + 3TC (or FTC) + EFV
ABC + 3TC + EFV
ABC (or AZT) + 3TC + LPV/r
AZT + 3TC + EFV (or NVP) TDF + 3TC (or FTC) + DTG TDF + 3TC (or FTC) + EFV400 TDF + 3TC (or FTC) + NVP
AZT + 3TC + EFV (or NVP) TDF + 3TC (or FTC) + NVP
AZT + 3TC + EFV (or NVP) TDF (or ABC) + 3TC (or FTC) + DTG
TDF (or ABC) + 3TC (or FTC) + EFV400
TDF (or ABC) + 3TC (or FTC) + NVP
ABC + 3TC + NVP
AZT + 3TC + EFV (or NVP)
TDF + 3TC (or FTC) + EFV (or NVP)
[image:34.595.63.533.346.792.2]27 The recent guidelines emphasizes on discontinuation of Stavudine in first-line regimen due to
its metabolic toxicities. It permits the use of reduced dose Efavirenz to improve acceptability
and decrease expenses. It includes integrase inhibitors in the first line drugs. Moreover it
recommends the use of fixed dose combinations (FDC) and once-daily regimens for ART
(57).
3.14 Monitoring
While an individual is on ART he must be monitored regularly to look for response to
treatment, development of any toxicities to the ARV drugs and for improved outcomes (61).
CD4 enumeration must be done every 6 months until the patient is stable on ART. It is
performed by flow cytometry using optical or electronic sensors that analyse characteristics
of each cell. In order to avoid diurnal fluctuations, blood sample should be collected at similar
times of the day. The specimen should not be refrigerated, instead kept at room temperature
until testing, preferably immediately (49,57). Even though therapy is now initiated regardless of the CD4 count, it is still relevant in order to decide when to start or stop OI prophylaxis, to
assess risk of disease progression, in priority settings to decide on ART initiation when
universal treatment is not possible and finally in persons in whom ART is failing (62).
HIV viral load (VL) is the preferred method to look for patient response to therapy in routine
monitoring. It is tested at 6 months, 12 months after initiating ART and every 12 months
thereafter if the individual is stable on treatment. In scenarios where viral load can be routinely
monitored, CD4 monitoring can be stopped in individuals with viral suppression and are
stable on ART (57). In order to quantify the actual amount of HIV-1 RNA in a person, a total of cell-free virus, virus in infected cells and integrated provirus must be taken but the usual
28 viral load estimation is plasma, alternatively, DBS specimens prepared from capillary or
venous whole blood can be used with a threshold of 1000 copies/ ml in resource-limited
settings (61). Real time Reverse transcriptase-PCR (RT-PCR) is the commonest technique
used and the result is reported as number of copies per ml blood. An individual who is virally suppressed must have viral load as ‘undetectable’ or below the lower limit of detection of the
assay (49).
3.15 Treatment failure
Virologial failure: After 6 months of initiating ART, if the VL >1000 copies/ ml in two
consecutive quantifications with a 3 month interval between them during which adherence support was given.
Clinical failure: After 6 months of receiving ART, if the individual develops new or
recurrent clinical condition which indicate progressing immunodeficiency.
Immunological failure: CD4 counts persistently <100 cells/ μl or counts ≤250 cells/ μl
after clinical failure in adults and adolescents. In children <5 years, CD4 counts persistently <200 cells/ μl and in children >5 years, CD4 counts persistently <100 cells/μl.
Viral load estimation is the favoured method to identify and confirm treatment failure. A
threshold of 1000 copies/ ml is recommended by WHO because below this level, the risk of
transmission of infection and worsening of disease is dramatically low. Similar to routine
monitoring, the samples that are used are plasma or DBS in order to extent the coverage of
viral load testing to settings with infrastructural challenges.
29 be done depending on clinical and immunological benchmarks to confirm virological failure
and thus avoid unnecessary switching of treatment regimen to second-line ART (57,61).
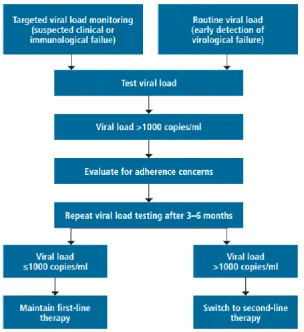
The algorithm that is followed to decide whether a change in treatment regimen is warranted,
is shown in Figure 10.
Figure 10: HIV-1 viral load estimation strategy (Adapted from WHO Information Note on HIV
Treatment and Care, July 2017 Update)
3.16 HIV-1 Drug resistance
Under the aegis of WHO and NACO there has been a steady upsurge in PLHIV receiving
ART, worldwide and in India, respectively. ART has proven to diminish HIV-associated
morbidity and mortality, however, poor adherence and suboptimal treatment can result in
[image:37.595.153.458.209.542.2]30 Individuals receiving ART are under the constant threat of resistance and subsequent
treatment failure, and also the transmission of resistant strains is of rising concern (54,63,64).
3.16.1 Evolution of drug resistance patterns
In the initial decade of ART, single and dual drug regimens mainly consisting of Zidovudine
(AZT) and Stavudine (d4T) were used. However, the development of resistance to these first
regimens led to the pursuit of newer effective regimens. The resistant strains selected out by the extensive use of NRTI, gave rise to cross-resistance to other members of the same class,
to which there was no previous exposure (54,65). The addition of PI and NNRTI to those
resistant to NRTI was beneficial clinically but resistance to these newer drugs led to
triple-class resistance (65).
There has been a paradigm shift in resistance patterns since a NNRTI was added to 2 NRTI
in the first-line regimen and AZT and d4T were replaced by Tenofovir (TDF) and Abacavir
(ABC). These regimens have brought about better virological suppression and improved tolerability. As a result, the commonest resistance in treatment failure is seen against NNRTI
(Efavirenz or Nevirapine) and Lamivudine or Emtricitabine (66). Likewise, ritonavir-boosted
PI has shown to have an upper hand over non-boosted PI with enhanced virological potency.
Unlike other classes of drugs, resistance to PI is rarely detected among individuals on boosted
PI-based regimens in treatment failure probably due to their high genetic barrier (65,67).
3.16.2 Epidemiology
Currently, most of the data available on HIV-1 drug resistance is on subtype B, despite the fact that non-B subtypes cause majority of the global infections (68). The WHO pre-treatment
drug resistance (PDR) surveillance data from 2014-2016, point out that NNRTI resistance has
31 And the overall prevalence of NNRTI resistance among ART-experienced individuals ranged
from 4% to 28% in Africa, where the major subtype is C (69). According to NACO, out of
the 10.75 lakh individuals on ART, 25000 are on second-line regimen and 450 on third-line
regimen following treatment failure to first-line and second-line drugs, respectively. National
AIDS Research Institute (NARI), Pune has recently taken on the responsibility of conducting a nation-wide survey to gauge the burden of HIV drug resistance in India (70).
3.16.3 Types of resistance
A characteristic feature of HIV infection is its high level of replication and turnover in
infected individuals. Furthermore, the notoriously error-prone nature of reverse transcription,
with an average of one mutation per each transcribed viral genome, results in a highly
heterogeneous viral population in an infected individual. These two factors together
contribute to the patient having an assorted mixture of viral quasispecies. Any of these
mutations generated in the presence of ARV drugs, may grant the virus a selective advantage of reduced susceptibility to ARV agents. The respective viral quasispecies will surpass the
others in accordance with the Darwinian selection process. This induced or acquired
resistance, is one mode of developing drug resistance (54).
Alternatively, individuals may be primarily infected with HIV strains that are resistant to
single or multiple ARV agents. As the prevalence of drug resistant HIV-1 rises among
infected individuals, the risk of transmission of resistant viruses to newly infected also
increases (65,71). This transmitted drug resistance (TDR), affects ART outcomes adversely by a faster rate of virological failure when compared to persons infected with susceptible
32 initiation. However, in developing countries with an extended access to ART and where
non-B subtypes predominate, pre-ART resistance testing is not available for routine use (72).
Though WHO recognises the importance of resistance testing for patients to guide selection
of ART regimen, it presently does not recommend it routinely. For the purpose of policy
making, it recommends surveillance of HIV drug resistance (57) by detection of any one of
the surveillance drug resistant mutations (SDRMs) given in WHO surveillance mutation list (72,73).
3.16.4 Genetic barrier to resistance
The number of mutations required to cause resistance to a particular ARV, and the frequency
at which it occurs, decides the ‘genetic barrier to resistance’ of that ARV. Some drugs which
require multiple drug resistance mutations to cause reduced susceptibility have a high genetic
barrier to resistance, whereas others which may need only a single mutation have a low genetic barrier to resistance.
Drug resistance mutations may either be primary mutations, which act directly to reduce the susceptibility of HIV to an ARV, or accessory mutations, which promote viral fitness and
thus reduce susceptibility. Also the inherent antiviral potency of different ARV vary
considerably. Both the genetic barrier to resistance and the inherent antiviral potency
determines the vulnerability of an ARV to resistance (74). The relative genetic barriers and
33
Figure 11: Diagrammatic representation of genetic barrier to resistance and potency or antiviral
activity of drugs from each ARV class. d4T = Stavudine, AZT = Zidovudine, DDl = Didanosine, TDF = Tenofovir, 3TC = Lamivudine, FTC = Emtricitabine, ABC = Abacavir, NVP = Nevirapine, EFV = Efavirenz, ETR = Etravirine, ATV/r = ritonavir boosted Atazanavir, LPV/r = ritonavir boosted Lopinavir, DRV/r = ritonavir boosted Darunavir, RAL = Raltegravir, ENF = Enfuvirtide, MVC = Maraviroc. (Adapted from Tang MW, et al. HIV-1 Antiretroviral Resistance. Drugs. 2012)
3.16.5 HIV-1 drug resistance testing
The progress of drug resistance has substantial implications while choosing ARV regimens.
The accumulation of mutations within the reverse transcriptase (RT) gene, which is the target
for 2 major classes of ARV drugs, has led to a point where drug resistance testing must
[image:41.595.105.505.73.396.2]34 Resistance testing can be done either by phenotypic or genotypic methods, to assess infecting
virus strains. Genotyping detects resistance causing mutations and phenotypic assays are
essentially drug susceptibility tests in which a fixed inoculum of the virus is grown in the
presence of serial dilutions of the drug. Both the tests include extraction of the virus from
plasma, reverse transcription of contiguous protease (PR) and RT genes, and amplification by
PCR (76). These assays detect resistance to NRTIs, NNRTIs and PIs. Testing for integrase
inhibitor resistance and fusion inhibitor resistance may have to be ordered separately. And co-receptor tropism assays should be performed prior to use of CCR5 antagonist (77).
3.16.5.1 Phenotypic testing
Phenotypic in vitro susceptibility assays test the ability of the virus to grow in cell culture at
different drug concentrations. It is typically reported as the drug concentration that inhibits
50% (IC50) of HIV virus replication. A ratio obtained by comparing the IC50 of the test virus
to that of a drug susceptible reference HIV strain is referred to as fold increase or fold change in IC50. These assays use recombinant viruses generated by introducing PCR-amplified
segments (PR/RT, integrase or envelope gene sequences) of patient virus genome extracted
from plasma into a HIV wild type laboratory construct (78,79).
The advantages of phenotypic testing is that it directly measures drug susceptibility which is
cumulative of the acquired mutations in the test strain. This technique is necessary to establish
genotype-phenotype correlations for the development of new ARV drugs and salvage
35 As a result of the high cost, longer turnaround time, insensitivity to minor viral variants and
lack of cut-offs for clinical resistance among all ARV agents, phenotypic testing is mainly set
aside for drug resistance research (76,79).
3.16.5.2 Genotypic testing
It detects drug resistance mutations present in pertinent viral genes. Following the extraction
of the virus from plasma, reverse transcription of the complete PR gene and most of RT gene and amplification by PCR, it is finally conventionally sequenced and its nucleotide sequence
is analysed to detect mutations known to confer resistance. Since there are over 150
recognised mutations associated with HIV drug resistance (HIVDR) and several interactions
between the mutations, the analysis of a resistance profile is complex. Hence various
genotypic resistance interpretation algorithms have been developed. The International AIDS
Society-USA (IAS-USA) has a list of mutations in the RT, PR, integrase and envelope genes.
The WHO HIVResNet also has a list of noteworthy mutations suitable for surveillance of transmitted DR-HIV. The Stanford University HIV Drug Resistance Database
(http://hivdb.stanford.edu) also guides the evaluation of genotypic test results.
Some of the issues with resistance testing are that it is not performed everywhere, only in
selected reference laboratories and are quite expensive. The tests do not detect minority
mutations and usually do not work if the sample has a VL < 1000 copies/ ml. And
comprehending the results of the test can be challenging (81).
Nonetheless, genotypic assays can be completed quickly and the report may be offered within 1-2 weeks of collecting the sample (77,82). The WHO has conventionally recommended
plasma which has been separated from an anticoagulated tube of blood, as the sample for
36 collection and frozen plasma specimens need to be shipped on dry ice. Successful
amplification from plasma depends on viral load, time interval between blood collection and
plasma separation, nature of plasma (haemolysis), and time interval from separation to
storage, storage temperature and time taken prior to testing. Therefore, only settings which
are able to correctly process and ship plasma samples must use it for HIV genotyping.
Serum can be collected as a specimen, following all the precautions taken for plasma. However, studies have shown that viral load in serum is markedly lower than in plasma.
Dried blood spots (DBS) can also be used for HIV drug resistance genotyping, by preparing
it with blood drawn for routine purposes or surveillance and it does not require any special
processing (82).
The concept of spotting blood on a filter paper and then utilising it for diagnostic purposes
began almost a century ago. The key attributes of DBS which makes it advantageous over routine samples were described by Chapman in 1924. They hold good even today and are:
A lesser volume of blood is required when compared to conventional phlebotomy.
Collection of blood is easy, non-invasive and economical.
There is minimal chances of bacterial contamination or haemolysis.
Much longer durations of storage is possible with DBS, with almost no degradation of
the analytes.
For many years, DBS was primarily used in resource-limited situations for the serological
diagnosis of infectious diseases like syphilis, mumps, measles, poliovirus, respiratory
syncytial virus and parainfluenza virus, for the direct detection of Shigella from faeces
37 in neonates. Later, from 2005 onwards a whole range of novel and innovative applications for
DBS have opened up (83). For the detection of infectious diseases by serology or molecular
methods, DBS can be relied upon, since antibodies and nucleic acids remain stable for longer
periods when compared to whole blood, plasma or serum (84).
In the market, very many types of filter paper brands are available with varying thickness and
pore sizes. The two main brands that are approved by US Food and Drug Administration
(FDA) for human whole blood collection are Whatman 903 and PerkinElmer 226 filter paper cards, which show minimal difference in detection of analytes. There are also treated filter
paper cards available, FTA Elute and FTA (Whatman; GE Healthcare, UK), which inactivate
antibodies, viruses and bacteria and causes cell lysis. Such cards can be used only for Nucleic
Acid Amplification Tests (NAATs) (85).
DBS appears to be an attractive alternative to plasma samples for HIV-1 drug resistance
testing. It offers a useful and dependable way to obtain, store and transport blood samples to reference laboratories offering drug resistance testing, which is essential to developing
cost-effective assays in resource-limited settings. Whole blood from a finger or heel stick puncture
can be effortlessly collected onto a filter paper, thus presenting a technical and monetary
benefit over conventional phlebotomy. Since the sample collection is easier, it avoids the use
of syringes and vacutainer tubes, decreases the biohazard risk to the phlebotomist and the
need for centrifugation. HIV-1 loses its infectivity due to the disruption of its envelope on
drying. DBS samples are thus non-infectious and can be readily dispatched in sealed envelopes to higher centres, whereas, plasma needs to be transported in break-proof
containers and requires dry ice to preserve the cold-chain. This in turn will add substantial
38 The WHO working along with specialists has provided a reference protocol on DBS
preparation, storage and transport conditions and processing for HIV-1 drug resistant
genotypic testing (87).
Drug resistance studies from India, where subtype C is prevalent, is the need of the hour.
Specifically, the stability of DBS at the tropical temperature in our country should be looked
into. Then DBS can be used as the convenient and economical sample in India, thus helping the resource-limited settings avail the ideal tools needed in the management of HIV infection.
3.16.6 Minority and archived viral populations
The prevailing population of resistant virus in plasma does not represent the heterogeneous
viral quasispecies in individuals failing HAART. Smaller populations of virus with distinct
mutations can serve as a reservoir for novel resistant genotypes and throughout the HIV
infection, viral genomes are endlessly being archived as latently integrated proviruses (54).
Conventional genotyping techniques, merely detects variants with a frequency ≥ 20% in an infected individual. Nevertheless, novel assays like next generation sequencing (NGS) can
detect minority variants at frequencies that are considerably low. These technologies help to
identify the actual rate of drug resistant variants in treatment-naïve and -experienced persons
and gains significance, since pre-existing resistant minority variants can jeopardize
subsequent treatment (68).
As the half-life of HIV in plasma is around 6 hours, only actively replicating virus can be
obtained and the resulting sequence represents the latest quasispecies selected by ART.
39 4. Materials and Methods
This study was done in the Departments of Clinical Virology and Clinical Microbiology,
Christian Medical College and Hospital, Vellore. It was approved by the Institutional Review
Board (Reference IRB Min. No. 9832 dated 07.01.2016) and was funded by Fluid Research
Fund (Account no. 22Y966) and Virology Special Fund.
4.1 Materials
4.1.1 Study subjects
Consecutive HIV-1 infected individuals in treatment failure referred for HIV-1 drug
resistance genotyping were recruited for the study and their plasma, DBS and PBMC samples
were tested for HIV-1 drug resistance mutations. The study was explained to all the
participating individuals and were recruited only after getting an informed consent. This study
was conducted over a period of 14 months (July 2016 – August 2017).
Inclusion criteria:
1) Serologically confirmed HIV-1 infected individuals
2) ART-experienced individuals with clinical, immunological and/or virological failure
(>1000 copies/ml)
3) Individuals above 18 years of age
4) Individuals who consent to the study
Exclusion criteria:
1) HIV-1 negative plasma samples by reference standard
40 3) Individuals under 18 years of age
4) Individuals who do not consent to the study
4.1.2 Sample size
The prevalence of HIV-1 infection in India is 0.3 with 5% individuals developing drug
resistance following initiation of treatment. Thus the HIV-1 drug resistance prevalence was
calculated to be around 0.02. The required sample size to show an agreement of 0.9 with a
prevalence of HIV-1 drug resistance of 2%, with 80% power and 5% level of significance
was found to be 34 HIV infected individuals. However, it was possible to recruit only 29 individuals.
Agreement -Single group- Dichotomous outcome-Kappa (88)
(Testing against Population value)
Population agreement 0.05
Sample agreement 0.9
Prevalence (Proportion) 0.02
Power (1-beta) 80
Alpha error (%) 5
1 or 2 sided 2
41 Formula:
4.1.3 Specimen collection
After obtaining an informed consent, 8 ml of blood was collected in a sterile EDTA containing
tube for routine testing; no additional blood was collected for the study. 5 spots, each of 80µl
of whole blood was spotted on Whatman 903 filter paper card and kept at 25⁰-30⁰C for 10
days and then stored at -20⁰C until the time of testing. The remaining blood was centrifuged,
plasma separated, multiple aliquots made and then stored at -70⁰C until testing, as part of
standard of care. After plasma was separated and aliquoted, PBMC was extracted from the
42 4.1.4 Study algorithm
Topic: To evaluate the efficiency of DBS for HIV-1 drug resistance mutations as compared to plasma samples.
8 ml of blood was collected in an EDTA containing tube (for routine testing and no additional blood was collected for the study)
80 µl of whole blood was spotted on Whatman 903 filter paper (5 spots) and kept at 25⁰-30⁰C for 10 days and then stored at -20⁰C.
HIV-1 drug resistance genotypic testing was carried out for all plasma, DBS and PBMC samples by amplifying and sequencing the pol gene.
Data analysis was carried out using Finch TV and BioEdit software.
The electropherogram sequences were submitted to Stanford data base for interpretation.
Study subjects: ART-experienced individuals with clinical, immunological and/or virological failure (>1000 copies/ml) coming for HIV-1 drug resistance testing
Informed consent was taken for all study participants
Remaining blood was centrifuged, plasma separated, multiple aliquots made and further stored at -70⁰C. (As part of standard of care)
After plasma separation, PBMC was separated from the remaining blood using Ficoll Paque.
The frequency of drug resistance mutations detected in plasma, DBS and PBMC was compared to confirm the origin of mutations.
The efficacy of DBS for detection of HIV-1 drug resistance mutations in samples stored at ambient temperature for 10 days was evaluated.
43 4.2 Methods
4.2.1 Sample preparation: Plasma (63,89)
Plasma was separated from the EDTA tubes after they were centrifuged at 2000 rpm for 10
minutes at 4⁰C. The plasma was stored as multiple aliquots at -70⁰C until the time of testing.
DBS
80μl each of whole blood was spotted on to Whatman 903 filter paper card as 5 spots, dried
overnight, covered in butter paper and put into a plastic zip lock pouch with two desiccants
and kept at 25⁰-30⁰C for 10 days and then stored at -20⁰C until testing was done by taking
punches of a spot.
PBMC
PBMC was separated from the remaining blood after spotting the filter paper card and plasma separation, by the following method. Three ml of blood sample was diluted in 6 ml of 1X
phosphate buffered saline (PBS) in a sterile 15 ml tube. The 9 ml of diluted blood sample was
mixed well in a plate mixer and 3 ml each of diluted blood samples was carefully overlain
into another 3 sterile 15 ml tube containing 3ml of Ficoll-Paque (GE Healthcare, Uppsala,
Sweden). Then the tubes were centrifuged at 2000 rpm for 20 minutes at 20⁰C and after
centrifugation the PBMC cell layer formed at the centre of the tubes was caref