0095-1137/10/$12.00 doi:10.1128/JCM.02276-09
Copyright © 2010, American Society for Microbiology. All Rights Reserved.
HIV Load Testing with Small Samples of Whole Blood
䌤
Katrin Steinmetzer,
1* Thomas Seidel,
2Andreas Stallmach,
2and Eugen Ermantraut
1 Clondiag GmbH, Jena, Germany,1and Division of Gastroenterology, Hepatology, and Infectious Disease,Department of Internal Medicine II, Jena University Hospital, Jena, Germany2
Received 20 November 2009/Returned for modification 15 January 2010/Accepted 20 May 2010
Access to human immunodeficiency virus (HIV) viral load (VL) testing is of paramount importance for the success of antiretroviral therapy treatment campaigns throughout the world. In many countries, limited laboratory infrastructure and transport capacities preclude a substantial number of people infected with HIV from accessing the necessary testing. Point-of-care diagnostic testing methods for those with HIV infection provide a compelling solution to addressing this challenge. To facilitate ease of use in such tests, finger-stick whole blood (WB) would constitute an ideal sample type if test performance equivalent to laboratory testing could be ensured. To determine the diagnostic sensitivity of a VL assay based on small volumes of WB, we analyzed 1,094 sample pairs of 1 ml of plasma and 10l of WB from donors confirmed to be HIV positive. The probability of detecting HIV nucleic acids in 10l of blood was 59.3% (95% confidence interval, 54.9 to 63.6%), 85.1% (80.0 to 90.2%), 91.5% (88.1 to 95%), and 100% when the corresponding plasma samples had an undetectable VL, a detectable VL less than 40 viral copies/ml (cp/ml), a VL between 40 and 4,000 cp/ml, and a VL greater than 4,000 cp/ml, respectively. Capillary blood and venous blood yielded comparable diagnostic sensitivities. Furthermore, our data indicate that WB could be used to monitor VL changes after highly active antiretroviral therapy (HAART) started. Thus, we have demonstrated the feasibility of small volumes of venous and finger-stick WB as valid samples for VL testing. This approach should facilitate the development of robust point-of-care HIV VL tests.
Universal access to highly active antiretroviral therapy (HAART) is crucial in the fight against human immunodefi-ciency virus (HIV) and AIDS throughout the world. Through international efforts, more than 4 million patients were placed on HAART in December 2008 (43). In the same period, more than 5 million people were in need of HAART but had no access to treatment, according to the World Health Organiza-tion (WHO) (43). Increased access to therapy calls for careful monitoring to detect therapy failure and to ensure adherence (17, 20). Maintenance of a low viral load (VL) under HAART will help to substantially decrease the spread of the epidemic (10). Moreover, models suggest that universal access to ther-apy could eventually lead to epidemiological eradication of the disease (16).
The plasma HIV RNA level is well established as a prog-nostic marker for the HIV-1 infection (29, 30) for monitoring the response to antiretroviral therapy (33) and therapy adher-ence (6, 17, 23, 37). For high-income countries, monitoring treatment response by measuring the plasma VL every 3 or 4 months is recommended by the International AIDS Society (19). Numerous HIV VL tests have been developed and com-mercialized using EDTA plasma as the sample of choice, but in settings with limited infrastructure the transport of fresh sam-ples and generation of plasma is difficult and sometimes im-possible. Dried blood and plasma spots have been evaluated as an alternative sample material to obtain VL data (1, 12, 25). However, as summarized in a systematic review, these methods are less sensitive, with a lower detection limit between 2.9 and
3.6 log10copies/ml (cp/ml), depending on the spot volume (18). In addition, commercially available tests target RNA from viral particles present in the plasma. When using dried blood spots with such tests, a substantial portion of proviral DNA inte-grated into the host genome may also be amplified and not excluded from the analysis, thus making a comparison of data difficult with measurements on EDTA plasma (32, 41).
There is an urgent need for a simple, rapid, and affordable point-of-care VL assay. Such an assay will require small vol-umes of whole blood (WB) instead of large volvol-umes of plasma and, therefore, would be particularly useful for infant diagnos-tics, where large samples volumes are difficult if not impossible to obtain. A “whole-blood approach” is supported by study data wherein the Procleix Discriminatory HIV-1 assay was used to qualitatively analyze 63 WB samples in comparison to corresponding plasma samples. It was found that of 11 plasma samples below the level of detection, 8 contained detectable amounts of HIV-1 RNA (W. Andrews, P. Yan, C. Harrington, B. Phelps, T. Elbeik, E. Fiebig, and V. Ng, poster presented at the annual meeting of the American Association of Blood Banks [AABB], 2003). In an earlier publication, one frozen WB sample was successfully analyzed by using the Procleix Discrimi-natory HIV-1 assay to prove an infection with HIV (39). How-ever, no comprehensive study has been undertaken thus far to demonstrate utility of small-volume WB samples for VL moni-toring of HIV-1. Therefore, in our study we measured the VL in 1 ml of plasma and in 10l of venous WB to determine the diagnostic sensitivities (36) of both assays. Furthermore, we com-pared the diagnostic sensitivities obtained with capillary and ve-nous WB. To demonstrate that WB VL can be used for HAART monitoring, we performed a longitudinal analysis of plasma and blood samples from patients starting HAART. We show the fea-sibility of VL monitoring using only 10l of WB.
* Corresponding author. Mailing address: Clondiag GmbH, Lo ¨bst-edter Strasse 105, 07749 Jena, Germany. Phone: 49 3641 3111167. Fax: 49 3641 3111120. E-mail: [email protected].
䌤Published ahead of print on 2 June 2010.
2786
on May 16, 2020 by guest
http://jcm.asm.org/
MATERIALS AND METHODS
Samples.A total of 1,094 samples of venous WB were obtained from 126 HIV-infected patients after obtaining informed consent over a period of 56 months. Initially, 34 patients did not receive HAART. During the study, 13 patients started HAART. All samples were anonymized. Ethics approval was obtained from the Ethical Committee of the Jena University Hospital on 30/11/ 2006 (1901–11/06). Plasma was separated by centrifugation of WB in K3-EDTA
Monovette tubes (Sarstedt) at 3,500⫻gfor 7.5 min. Plasma and WB samples
were stored frozen at⫺80°C, if storage was required. Storage of WB samples at
⫺80°C did not significantly influence the measured VL, whereas storage at
⫺20°C did (data not shown). A 100-l sample of capillary WB was taken either
from finger tip or the ear lobe using K3-EDTA Microvette (Sarstedt) on the same day as the corresponding venous WB samples and analyzed in the same COBAS AmpliPrep/COBAS TaqMan HIV-1 Test (CAP/CTM) test run.
Venous WB from 7 volunteers and capillary blood from 32 volunteers, all previously tested to be HIV negative, was obtained with informed consent.
Evaluation of the CAP/CTM HIV-1 RNA quantification in the presence of WB.
The COBAS AmpliPrep/COBAS TaqMan HIV-1 Test (CAP/CTM) is not vali-dated by the manufacturer for use with WB samples. To evaluate the VL measurements using the CAP/CTM in the presence of WB, aliquots of the OptiQuant HIV-1 RNA quantification panel (Acrometrix, Benicia, CA) were analyzed in the presence or absence of WB. The panel consists of HIV-1 positive human plasma diluted with a proprietary matrix to yield defined VL between 0
and 107
IU of HIV-1 RNA/ml and is calibrated against the WHO International
Standard for HIV-1 RNA. One copy of HIV-1 RNA is equivalent to 1.7⫾0.1 IU
based on the WHO First International Standard for HIV-1 RNA for Nucleic Acid-Based Techniques (NIBSC 97/656).
The data sheet provided by Acrometrix for the OptiQuant panel states that the quantification was done using the COBAS Amplicor HIV.1 Monitor version 1.5 assay (Roche). According to the data provided by Roche for the comparison between the COBAS AmpliPrep/Amplicor HIV-1 Monitor Test v1.5 and the
CAP/CTM, the results obtained with CAP/CTM for samples between 102
and
104
cp are generally higher by 0.1 to 0.4 log10, whereas for 105cp the average
results are comparable (package insert).
To determine the dynamic range of the modified test for the measurements
with blood, 10l of EDTA-blood of different HIV-negative donors was mixed
with 890l of phosphate-buffered saline (PBS) and then combined with 100l
of OptiQuant aliquots containing between 6 and 600,000 cp of HIV RNA and analyzed using the CAP/CTM as described above.
Based on the information given in the package insert, a hemoglobin (Hb) concentration of up to 900 mg/dl (9 mg/ml) and human DNA up to 0.4 mg/dl (4
g/ml) are tolerated in the samples. In WB the average concentrations of Hb and
human DNA are 150 mg/ml and 30 to 60g/ml, respectively. Therefore, the final
concentrations of Hb and human DNA in a sample containing 10l of WB are
1.5 mg/ml and 0.3 to 0.6g/ml, respectively, so the concentrations of both
potential inhibitors are within the specifications of the manufacturer. For the
measurements without blood, 100-l OptiQuant aliquots were mixed with 900l
of PBS and analyzed as described above.
The modified COBAS protocol for the use with WB has been validated based on the following acceptance criteria: the internal standard had to perform within the range defined by the manufacturer, and a negative run control with blood from donors previously tested to be HIV negative had to give negative results
(the diagnostic specificity [36] was 100%). Linear regressions andR2
values were calculated for log-transformed measurement results.
Determination of VL in EDTA plasma and WB.The plasma VL was deter-mined from 1 ml of plasma using the CAP/CTM versions 1.0 and 2.0 (Roche Diagnostics GmbH, Mannheim, Germany) as recommended by the manufac-turer. The WB VL was determined by using the same assay with the following
modification: 10l of WB was mixed with 990l of PBS to yield the required
sample volume of 1 ml. Corresponding plasma and WB samples were analyzed together in the same run. Because nucleic acid isolation and amplification in the CAP/CTM are based on nonspecific binding of nucleic acids onto silica beads, followed by a real-time reverse transcription-PCR (RT-PCR), RNA and DNA may be coisolated and coamplified. Therefore, when cell-containing samples such as blood are used, the VL measured includes not only HIV-1 RNA but, if present in the sample, also HIV-1 DNA.
Determination of PBMC-associated VL.Venous blood samples from 17 indi-viduals with confirmed infection with HIV and receiving HAART were collected. One of the patients donated WB at two time points. The plasma VLs were below the limit of detection for at least 3 months prior to sample collection. BD Vacutainer cell preparation tubes with sodium citrate (Becton Dickinson, Fran-klin Lakes, NJ) for the separation of mononuclear cells from WB were used to
collect venous blood. The cell separation medium consists of a polyester gel and a density gradient liquid. This permits cell separation during a single centrifu-gation step. To separate plasma and peripheral blood mononuclear cells (PBMC) from erythrocytes and granulocytes, the BD Vacutainer cell
prepara-tion tubes were centrifuged at 1,500⫻gfor 20 min, as suggested by the
manu-facturer. After the centrifugation, the supernatant consists of a plasma layer and a layer containing mononuclear cells and platelets. Granulocytes and red blood cells are located below the polyester layer. Vacutainer tubes were then carefully inverted several times to resuspend the sedimented PBMC fraction in plasma. The plasma containing the PBMC was then transferred into a fresh tube, and
10-l portions were mixed with 990l of PBS and then analyzed using the
COBAS assay as described above.
A second sample of venous blood was collected by using K3-EDTA Monovette tubes (Sarstedt) to generate cell-free plasma as described above after aliquots of
WB were removed. The VLs of all three sample types—10l of plasma
con-taining PBMC, 1 ml of plasma, and 10l of WB—were measured by using the
CAP/CTM. The plasma containing PBMC and WB samples was mixed with 990
l of PBS to yield the required sample volume of 1 ml for the CAP/CTM.
McNemar’s test was used to determine statistical differences in the diagnostic sensitivity of WB, plasma, and plasma containing PBMC.
Determination of VL in capillary WB.To examine the possibility of using capillary WB for VL measurements, 210 sample pairs of venous and capillary WB specimens from donors confirmed to be HIV-infected were analyzed with the CAP/CTM as described above. The numbers of samples with undetectable VLs, VLs below 40 cp/ml, and VLs greater than 40 cp/ml for both specimens were compared by using McNemar’s test.
Statistical methods.All statistical analyses were performed by using SigmaStat 3.5 software (Systat Software, Inc., Point Richmond, CA).
RESULTS
Validation of the CAP/CTM test for the use of WB samples.
Since the CAP/CTM is not validated for the analysis of WB samples, we wanted to test whether the quantification of HIV-1 RNA is influenced by WB. Therefore, we analyzed samples with known VLs between 6 and 600,000 cp per assay in the presence or absence of WB obtained from healthy vol-unteers. The results are shown in Table 1.
According to the package insert, the CAP/CTM HIV-1 test version 2.0 has a linear range from 20 (log10⫽ 1.3) to 107
(log10⫽ 7) cp per test. Positive results are either given as
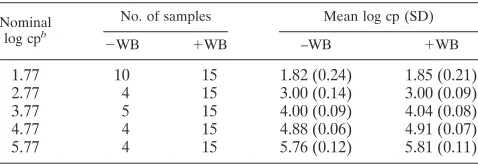
[image:2.585.302.541.89.171.2]detected (VL ⬍ 20 cp/ml) or as VLs in cp/ml. For samples without added WB the CAP/CTM test was positive in 10/12 for an OptiQuant HIV RNA concentration of 6 cp/ml, in 10/12 for a concentration of 20 cp/ml, 12/12 for a concentration of 40 cp/ml, 10/10 for a concentration of 60 cp/ml, and in 4/4 or 5/5 for higher concentrations. For samples with 10l of WB, the CAP/CTM test was positive in 12/15 for an OptiQuant HIV RNA concentration of 6 cp/ml, in 9/12 for a concentration of 20 cp/ml, 12/12 for a concentration of 40 cp/ml, and 15/15 for a concentration of 60 cp/ml and higher concentrations. No TABLE 1. Results of the CAP/CTM version 2.0 validation for the
use of WB samplesa
Nominal
log cpb
No. of samples Mean log cp (SD)
⫺WB ⫹WB –WB ⫹WB
1.77 10 15 1.82 (0.24) 1.85 (0.21)
2.77 4 15 3.00 (0.14) 3.00 (0.09)
3.77 5 15 4.00 (0.09) 4.04 (0.08)
4.77 4 15 4.88 (0.06) 4.91 (0.07)
5.77 4 15 5.76 (0.12) 5.81 (0.11)
a
VL measurements were performed in the absence or presence of WB (⫺WB
or⫹WB, respectively) as indicated.
b
The input copy numbers per sample are given as log values.
on May 16, 2020 by guest
http://jcm.asm.org/
false-positive results were obtained in the presence (15/15) or absence (15/15) of HIV-negative EDTA-blood. For all results obtained with an input of 60 cp/ml and higher, the mean and standard deviations are given in Table 1. However, the differ-ences in results obtained with or without blood were not sig-nificant, as determined by Studentttest. In general, with the exception of the data for 5.77 log cp, the average measured copy number is slightly higher than the nominal copy number given for the OptiQuant panel (as determined by the manu-facturer using the COBAS Amplicor HIV.1 Monitor version 1.5 assay [Roche]).
Based on our results, the linear range for analysis of 10l of EDTA-blood using the CAP/CTM is between 60 and 6⫻105
cp. We could not evaluate the test for higher copy numbers due to the lack of appropriate quantified and standardized samples in this range.
The linear regression for the data obtained with or without EDTA-blood is shown in Fig. 1. Only data for 60 cp and higher were included. The data show that the presence of WB does not impair the quantification of HIV-1 RNA in this range, although the results with EDTA-blood are in general slightly higher by an average of 0.04 (log10cp) than without.
Comparison of VL in plasma and corresponding WB sam-ples.We compared VL data obtained from single measure-ments with 10l of WB and 1 ml of plasma of 1,094 matched samples from 126 donors confirmed to be infected with HIV. A total of 87.5% of the samples were from donors receiving HAART at the time of blood donation. Of the plasma samples analyzed, 44.4% had an undetectable VL, 17.2% had a detect-able VL below the limit of quantification of 40 cp, 18.1% had a VL between 40 and 1000 cp/ml, 8.6% had a VL between
1,000 and 10,000 cp/ml, and 11.7% had a VL greater than 10,000 cp/ml.
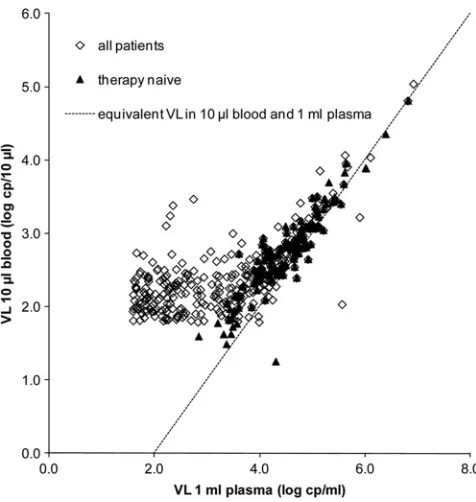
Of the 486 plasma samples with an undetectable VL, 59.3% (95% confidence interval [CI], 54.9 to 63.7%) had a detectable VL in WB. Of these 288 samples, 34.4% (95% CI, 28.9 to 39.9%) had a VL greater than 40 cp/10l of WB. The detailed qualitative VL results are given in Table 2. The observed dif-ferences were found to be statistically significant (McNemar’s test,P⬍0.001). Of the 50 plasma samples with a VL between 1,000 and 4,000 cp/ml, only two corresponding WB samples had no measurable VLs in 10l of WB. Assuming an average hematocrit of 45%, these plasma VLs would correspond to about 5 to 20 cp/10l of WB when no cell-associated viral nucleic acids are present in the blood samples. The CAP/CTM positivity rate for VL between 5 and 20 cp/sample is between 53 and 98% (package insert v2.0). Figure 2 gives a graphical
[image:3.585.301.539.419.670.2]FIG. 2. VL data measured in 1 ml of plasma versus VL measured in 10l of WB. Please note that the plasma VL is shown as the log (cp/1 ml), whereas the WB VL is shown as the log (cp/10l [blood]). Only data with a quantifiable VL (i.e.,⬎40 cp/ml of plasma and⬎60 cp/10l of WB) are shown. The dotted line indicates the expected results if plasma and blood VL would be equivalent.
TABLE 2. Frequencies of qualitative CAP/CTM VL results in 1,094 sample pairs of plasma and WB
Sample type and qualitative CAP/
CTM resulta
No. of samples (%) Plasma, not
detected
Plasma,
⬍40 cp
Plasma,
⬎40 cp Total
WB, not detected 198 (18.1) 28 (2.6) 21 (1.9) 247 (22.6) WB,⬍40 cp 147 (13.4) 55 (5.0) 41 (3.7) 243 (22.2) WB,⬎40 cp 141 (12.9) 105 (9.6) 358 (32.7) 604 (55.2)
Total 486 (44.4) 188 (17) 420 (38.4) 1,094
a
VLs in 10l of WB and 1 ml of the corresponding plasma were analyzed.
CAP/CTM, COBAS AmpliPrep/COBAS TaqMan HIV-1 test.
FIG. 1. Correlation between nominal and measured HIV genome cp in the presence or absence of 10l of WB. The data are given as the log cp/measurement. The linear regression and the coefficient of de-terminationR2are indicated.
on May 16, 2020 by guest
http://jcm.asm.org/
presentation of the VL data. We found a correlation between VL measured in plasma and WB for sample pairs with a plasma VL greater than 3,000 cp/ml (r ⫽ 0.863,P ⬍ 0.001, linear regression VL WB⫽0.706⫻plasma VL – 0.412,R2⫽
0.740). For sample pairs with plasma VLs greater than 10,000 cp/ml, the coefficient of correlation was 0.902 (P ⬍ 0.001). Linear regression was performed on log-transformed data when the plasma VL was⬎3,000 cp/ml. Below a plasma VL of 3,000 cp/ml, no correlation could be established between plasma and WB VL (r⫽0.011,P⫽0.895).
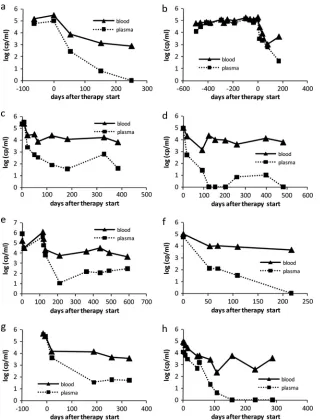
Interestingly, we observed a reasonable similarity of VL changes in WB and plasma over the course of time. Figure 3 shows the time course of plasma and WB VLs for a number of patients with HAART initiated during the observation period. VL in both sample matrices reveals a similar trend, suggesting that the WB VL might be a clinical marker for VL monitoring. The Pearson coefficients of correlation and respective
proba-bilities are shown in Table 3 for every patient. The time course data show good correlations between VLs in plasma and WB with one exception. For this patient (Fig. 3d), during the initial 100 days, the VL in plasma and WB both decreased in a similar way, but after this the plasma VL reached a low/undetectable level, whereas the VL in WB remained at a higher level.
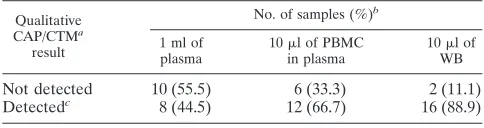
[image:4.585.135.457.66.486.2]Comparison of VL in plasma, WB, and plasma containing PBMC.To gain further insight into the distribution of viral nucleic acids between the various fractions of WB, we analyzed 10l of WB, 1 ml of plasma, and 10l of plasma containing PBMC but no platelets and erythrocytes. Table 4 shows the absolute numbers and percentages of samples with an unde-tected and deunde-tected VL. VLs were deunde-tected in 8/18, 12/18, and 16/18 samples of 1 ml of plasma, 10l of plasma containing PBMC, and 10 l of WB, respectively. The observed differ-ences between 1 ml of plasma and 10l of plasma containing PBMC and 10l of plasma containing PBMC and 10l of WB FIG. 3. VL time courses for eight HIV-positive patients before and after HAART was started. The plasma and WB VLs follow similar trends after the therapy was started. The VLs in WB are higher than the corresponding plasma VLs, indicating that even for the longest period of observation of nearly 600 days after HAART initiation viral nucleic acids can be detected.
on May 16, 2020 by guest
http://jcm.asm.org/
were not statistically significant (McNemar’s test, P ⫽0.789 andP⫽0.105, respectively), but a statistically significant dif-ference was observed between the diagnostic sensitivities of 1 ml of plasma and 10l of WB (P⫽0.007).
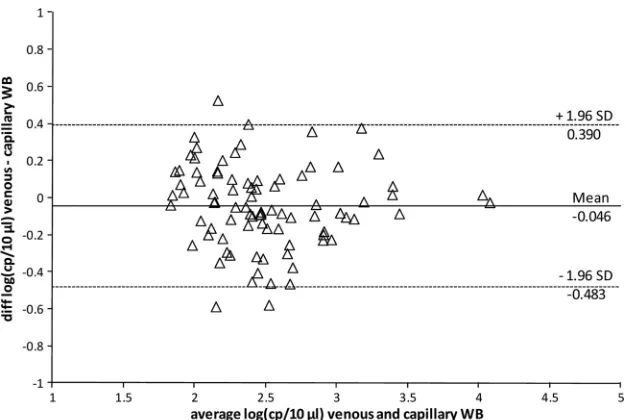
Comparison between VL data measured with venous WB and capillary WB.For the future development of a point-of-care VL test, it is crucial to be able to work with samples that are easier to obtain than venous WB. To demonstrate the feasibility of using capillary WB instead of venous WB to determine the VL in individuals infected with HIV, we ana-lyzed 210 venous blood, capillary blood, and plasma samples from 86 donors. We found that 162 (77.1%) of the venous WB samples, 159 (75.7%) of the capillary blood samples, and 108 (51.4%) of the plasma samples had detectable VLs. The dif-ference observed between venous and capillary WB was not significant (McNemar’s test,P ⫽ 0.770), whereas the differ-ences between venous or capillary WB and plasma were sig-nificant (McNemar’s test,P⬍0.001 for both tests). This indi-cates that analysis of 10 l of capillary or venous WB yield comparable diagnostic sensitivities, which is higher than that obtained with 1-ml plasma samples. Figure 4 shows the scatter plot of log-transformed VL data from venous and capillary WB. Only data pairs with both samples having a VL of at least 60 cp/10 l are shown. The linear regression equation was f(x)⫽0.925x⫹0.393 (R2⫽0.777) for log-transformed VL.
DISCUSSION
The most important result of our study was the high diagnostic sensitivity obtained when we used only 10 l of WB for VL determination. We analyzed more than 1,000 plasma and corre-sponding WB samples from 126 HIV-positive patients with plasma VLs ranging from undetectable to 6.4⫻106cp/ml and
were able to show that by using WB instead of plasma, the sample volume can be reduced, while the diagnostic sensitivity increases. By comparing the VL obtained in WB, plasma, and plasma con-taining PBMC, we could show that the sample volume can be reduced when blood cells are included: the difference in the prob-ability to detect HIV nucleic acids in 1 ml of plasma or in 10l of plasma containing PBMC was not significant, despite the de-creased sample volume. Furthermore, the difference in the prob-ability to detect HIV nucleic acids in 10l of WB was significantly
higher than in 1 ml of plasma. The high diagnostic sensitivity of this WB assay is based on the fact that HIV particles are associ-ated with peripheral blood cells. Several reports described the detection of viral particles and/or HIV-1 RNA not only in asso-ciation with platelets (5, 28, 40), monocytes (44), and resting and activated CD4⫹cells under prolonged HAART (9) but also in CD4⫺CD8⫺T cells, probably originating from infected CD4⫹T cells (26). HIV RNA and HIV antigen were also found to be associated with erythrocytes (8, 14, 22). In addition, it has been noted in several publications that HIV-1 RNA remains detectable in WB even when the plasma VL is below the limit of detection (13, 27, 35, 39; W. Andrews, P. Yan, C. Harrington, B. Phelps, T. Elbeik, E. Fiebig, and V. Ng, poster presented at the annual meeting of the American Association of Blood Banks [AABB], 2003). Our results showing that 59.3% of the 10-l WB samples had detectable VLs while the corresponding 1-ml plasma samples had no detectable VLs agree well with these observations.
[image:5.585.43.279.97.193.2]In our study we validated an established plasma VL assay for the use with WB. The assay principle of the CAP/CTM in-cludes a nonspecific capture step based on silica beads and a RT-PCR and therefore does not discriminate between proviral DNA integrated into the host genome, unintegrated linear and circular DNA, and viral RNA from free viral particles or cell associated RNA. The WB VL therefore represents the entirety of HIV nucleic acids and could be a far more sensitive biomar-ker if direct comparison with already established techniques was not of a primary requirement. However, the inherently higher diagnostic sensitivity may not be the only advantage of a WB VL assay. Cell-associated viral particles have been shown to be more stable and infectious than free HIV (7, 11) and can infect target cells (21, 31, 34). If this is taken into consideration, it appears prudent to include the cell-bound fraction of HIV into the monitoring of the VL under therapy. Thus far, only a few studies have determined the diagnostic sensitivity in WB. Using RT-PCR, HIV nucleic acids were detected in 84% of blood samples of seropositive patients and in 80% of the corresponding plasma samples compared to 97% of corresponding purified PBMC samples. This has been ex-plained by insufficient removal of PCR inhibitors during the nucleic acid isolation from WB (5). Elbeik et al. also found a higher diagnostic sensitivity when using WB instead of plasma using a 100-l sample volume (W. Andrews, P. Yan, C. Har-rington, B. Phelps, T. Elbeik, E. Fiebig, and V. Ng, poster presented at the annual meeting of the American Association of Blood Banks [AABB], 2003). Much more data are available for the analysis of WB stored on filter cards as dried blood TABLE 4. Absolute numbers and frequencies of qualitative results
in different types of HIV-positive samples: comparison of plasma alone and plasma containing PBMC and WB
Qualitative
CAP/CTMa
result
No. of samples (%)b
1 ml of plasma
10l of PBMC
in plasma
10l of
WB
Not detected 10 (55.5) 6 (33.3) 2 (11.1) Detectedc 8 (44.5) 12 (66.7) 16 (88.9)
a
CAP/CTM, COBAS AmpliPrep/COBAS TaqMan HIV-1 test.
b
A total of 18 samples for each indicated sample type were analyzed.
c
Combined numbers of results with detected VL below and above the limit of quantification of the CAP/CTM.
TABLE 3. Pearson coefficients of correlation and respective probabilities for VL measured in WB and plasma at different
time points before and after the start of HAART
Patienta rb Pc
1 (a) 0.994 ⬍0.001
2 (b) 0.933 ⬍0.001
3 (c) 0.920 ⬍0.001
4 (d) 0.566 0.088
5 (e) 0.848 0.002
6 (f) 0.967 0.007
7 (g) 0.937 0.006
8 (h) 0.818d 0.002
aLetters in parentheses refer to the corresponding panels in Fig. 3.
br, Pearson coefficient of correlation.
cP, probability.
dFor the first 108 days,r⫽0.955 andP⬍0.001(eight data points for VLs in
WB and plasma; after that plasma VL became undetectable, whereas WB in blood was still detectable).
on May 16, 2020 by guest
http://jcm.asm.org/
[image:5.585.300.542.99.163.2]spots with contradictory results regarding diagnostic sensitivity and correlation with plasma VL. Some studies based on dried blood spots have suggested that analyzing WB would lead to an increased diagnostic sensitivity compared to plasma measure-ments (32, 38, 41). In contrast to this, several other studies comparing the VLs determined in dried blood spots, dried plasma spots, and fresh plasma samples did not show an in-creased diagnostic sensitivity when blood samples were used but found a good correlation between the VLs obtained from the different sample types (1, 3, 4). However, the studies either included only samples with VLs of at least 1,000 cp/ml and higher or the data show a strong variation at the lower end of detection. Other studies reported a decreased diagnostic sen-sitivity for dried blood spots compared to plasma (4, 15), es-pecially one study purposely performed in a field setting (24). Our direct comparison of VLs measured in 10l of WB and 1 ml of plasma showed a good correlation only for samples with a plasma VLs of 3,000 cp/ml or 3.477 log cp/ml and higher, whereas samples with VL levels below this threshold did not show any correlation but rather a baseline level VL in 10l of WB. The average VL measured in WB for plasma samples below 3.477 log cp/ml is 2.072 (95% CI, 2.041 to 2.103). Based on an average hematocrit of 0.45, a plasma VL of 3,000 cp/ml corresponds to 16.5 cp/5.5 l, which is below the limit of quantification (LOQ) of the CAP/CTM test. Therefore, the baseline level in WB most probably reflects the cell-associated viral nucleic acids, since the amount of VL from plasma in 10
l of WB is negligible. However, despite the fact that there is no correlation between WB and plasma VL below 3,000 cp/ml of plasma, the methodology might be suited for HIV therapy monitoring. Particularly for longitudinal observation, this ef-fect may not be important since a change in VL is the param-eter of interest. In our study, we showed that VL changes in WB and plasma sample from patients starting HAART are comparable. Furthermore, the WHO recommends maintain-ing the first line therapy unless the plasma VL exceeds 5,000 to 10,000 cp/ml (42). We observed a high correlation between a
VL of ⬎3,000 cp/ml measured in plasma and WB, and for blood samples with corresponding plasma VLs of 5,000 cp/ml the diagnostic sensitivity was 100%. Therefore, the WB data generated are consistent and objectively reflect the status of infection, and the VL determined in WB is a true marker for the effect of therapy. Our WB VL data do not distinguish between full-length HIV RNA indicative for ongoing viral replication and other HIV nucleic acids from infected cells. However, as long as the VL remains detectable, low-level rep-lication cannot be excluded and might eventually lead to HAART failure. Including cell-associated HIV-RNA in VL measurements using a RNA-selective assay design will allow detection of resistance mutations earlier (35).
To summarize our findings, we showed that WB VL is a valid marker for therapy monitoring and that capillary and venous WB are equally suited for this purpose. Taken together, the data provide the prerequisite to develop a point-of-care assay for HIV therapy monitoring and diagnosis, with the latter being particu-larly useful for infant diagnosis and for early detection of the acutely infected infants using only minute amounts of WB.
ACKNOWLEDGMENTS
We thank Monique Ru¨ttger, Christiana Mehlhorn, and Kornelia Kuhn for performing the viral load measurements and Tobias Ka¨stner, Carly Scott, and Chris Smit for critical reading of the manuscript.
This study was supported by a technology development grant (2008-FE-0034) from the federal state of Thuringia.
E.E. and K.S. are currently full-time employees of Clondiag GmbH Jena and shareholders of Inverness Medical Innovations.
REFERENCES
1.Alvarez-Munoz, M. T., S. Zaragoza-Rodriguez, O. Rojas-Montes, G. Pala-cios-Saucedo, G. Vazquez-Rosales, A. Gomez-Delgado, J. Torres, and O. Munoz.2005. High correlation of human immunodeficiency virus type-1 viral load measured in dried-blood spot samples and in plasma under different
storage conditions. Arch. Med. Res.36:382–386.
2. Reference deleted.
[image:6.585.136.449.66.276.2]3.Ayele, W., R. Schuurman, T. Messele, W. Dorigo-Zetsma, Y. Mengistu, J. Goudsmit, W. A. Paxton, M. P. de Baar, and G. Pollakis.2007. Use of dried spots of whole blood, plasma, and mother’s milk collected on filter paper for
FIG. 4. Bland-Altman plot of VL data obtained with 10l of venous and 10l of capillary blood. The VLs are log transformed. The means of the differences and the 95% CI values for the mean of differences are indicated as solid and dotted lines, respectively.
on May 16, 2020 by guest
http://jcm.asm.org/
measurement of human immunodeficiency virus type 1 burden. J. Clin.
Microbiol.45:891–896.
4.Brambilla, D., C. Jennings, G. Aldrovandi, J. Bremer, A. M. Comeau, S. A. Cassol, R. Dickover, J. B. Jackson, J. Pitt, J. L. Sullivan, A. Butcher, L. Grosso, P. Reichelderfer, and S. A. Fiscus.2003. Multicenter evaluation of use of dried blood and plasma spot specimens in quantitative assays for human immunodeficiency virus RNA: measurement, precision, and RNA
stability. J. Clin. Microbiol.41:1888–1893.
5.Bruisten, S., B. van Gemen, M. Koppelman, M. Rasch, D. van Strijp, R. Schukkink, R. Beyer, H. Weigel, P. Lens, and H. Huisman.1993. Detection of HIV-1 distribution in different blood fractions by two nucleic acid
ampli-fication assays. AIDS Res. Hum. Retrovir.9:259–265.
6.Bruisten, S. M., M. H. Koppelman, M. T. Roos, A. E. Loeliger, P. Reiss, C. A. Boucher, and H. G. Huisman.1993. Use of competitive polymerase chain reaction to determine HIV-1 levels in response to antiviral treatments. AIDS
7(Suppl. 2):S15–S20.
7.Carr, J. M., H. Hocking, P. Li, and C. J. Burrell.1999. Rapid and efficient cell-to-cell transmission of human immunodeficiency virus infection from monocyte-derived
macrophages to peripheral blood lymphocytes. Virology265:319–329.
8.Cena, M., N. Schwachsa, M. N. Garcia, M. M. Avila, and R. D. Rabinovic.
2004. Determination of HIV-1 p24 antigen associated with erythrocytes: potential uses. International Conference on AIDS, abstr. no. B11460. 9.Chun, T. W., D. C. Nickle, J. S. Justement, D. Large, A. Semerjian, M. E.
Curlin, M. A. O’Shea, C. W. Hallahan, M. Daucher, D. J. Ward, S. Moir, J. I. Mullins, C. Kovacs, and A. S. Fauci.2005. HIV-infected individuals receiv-ing effective antiviral therapy for extended periods of time continually
re-plenish their viral reservoir. J. Clin. Invest.115:3250–3255.
10.De Cock, K. M., S. P. Crowley, Y. R. Lo, R. M. Granich, and B. G. Williams.
2009. Preventing HIV transmission with antiretrovirals. Bull. World Health
Organ.87:488A.
11.Dimitrov, D. S., R. L. Willey, H. Sato, L. J. Chang, R. Blumenthal, and M. A. Martin.1993. Quantitation of human immunodeficiency virus type 1
infec-tion kinetics. J. Virol.67:2182–2190.
12.Fiscus, S. A., D. Brambilla, L. Grosso, J. Schock, and M. Cronin.1998. Quantitation of human immunodeficiency virus type 1 RNA in plasma by
using blood dried on filter paper. J. Clin. Microbiol.36:258–260.
13.Furtado, M. R., D. S. Callaway, J. P. Phair, K. J. Kunstman, J. L. Stanton, C. A. Macken, A. S. Perelson, and S. M. Wolinsky.1999. Persistence of HIV-1 transcription in peripheral-blood mononuclear cells in patients
re-ceiving potent antiretroviral therapy. N. Engl. J. Med.340:1614–1622.
14.Garcia, M. N., M. S. dos Ramos Farías, N. Schvachsa, D. Rabinovich, and M. M. Avila.2006. Detection of HIV-1 antigen associated to erythrocytes in patients with undetectable viral load in plasma for more than 1 year, poster P19. International Meeting of the Institute of Human Virology, Baltimore,
MD. Retrovirology3(Suppl. 1):P19.
15.Garrido, C., N. Zahonero, A. Corral, M. Arredondo, V. Soriano, and C. de Mendoza.2009. Correlation between human immunodeficiency virus type 1 (HIV-1) RNA measurements obtained with dried blood spots and those obtained with plasma by use of Nuclisens EasyQ HIV-1 and Abbott
Real-Time HIV load tests. J. Clin. Microbiol.47:1031–1036.
16.Granich, R. M., C. F. Gilks, C. Dye, K. M. De Cock, and B. G. Williams.
2009. Universal voluntary HIV testing with immediate antiretroviral therapy as a strategy for elimination of HIV transmission: a mathematical model.
Lancet373:48–57.
17.Gross, R., W. B. Bilker, H. M. Friedman, and B. L. Strom.2001. Effect of adherence to newly initiated antiretroviral therapy on plasma viral load.
AIDS15:2109–2117.
18.Hamers, R. L., P. W. Smit, W. Stevens, R. Schuurman, and T. F. Rinke de
Wit.2009. Dried fluid spots for HIV type-1 viral load and resistance
geno-typing: a systematic review. Antivir. Ther.14:619–629.
19.Hammer, S. M., J. J. Eron, Jr., P. Reiss, R. T. Schooley, M. A. Thompson, S. Walmsley, P. Cahn, M. A. Fischl, J. M. Gatell, M. S. Hirsch, D. M. Jacobsen, J. S. Montaner, D. D. Richman, P. G. Yeni, P. A. Volberding, and AS-U.S.A. Interna-tional.2008. Antiretroviral treatment of adult HIV infection: 2008
recommenda-tions of the International AIDS Society-U.S.A. panel. JAMA300:555–570.
20.Hawkins, C., and R. L. Murphy.2009. Management of antiretroviral failure
and resistance in developing countries. Curr. Opin. HIV AIDS4:538–544.
21.He, W., S. Neil, H. Kulkarni, E. Wright, B. K. Agan, V. C. Marconi, M. J. Dolan, R. A. Weiss, and S. K. Ahuja. 2008. Duffy antigen receptor for chemokines mediates trans-infection of HIV-1 from red blood cells to target
cells and affects HIV-AIDS susceptibility. Cell Host Microbe4:52–62.
22.Hess, C., T. Klimkait, L. Schlapbach, V. Del Zenero, S. Sadallah, E. Hora-kova, G. Balestra, V. Werder, C. Schaefer, M. Battegay, and J. A. Schifferli.
2002. Association of a pool of HIV-1 with erythrocytes in vivo: a cohort
study. Lancet359:2230–2234.
23.Holodniy, M., D. A. Katzenstein, D. M. Israelski, and T. C. Merigan.1991. Reduction in plasma human immunodeficiency virus ribonucleic acid after dideoxynucleoside therapy as determined by the polymerase chain reaction.
J. Clin. Invest.88:1755–1759.
24.Johannessen, A., C. Garrido, N. Zahonero, L. Sandvik, E. Naman, S. L. Kivuyo, M. J. Kasubi, S. G. Gundersen, J. N. Bruun, and C. de Mendoza.
2009. Dried blood spots perform well in viral load monitoring of patients who receive antiretroviral treatment in rural Tanzania. Clin. Infect. Dis.
49:976–981.
25.Johannessen, A., M. Troseid, and A. Calmy.2009. Dried blood spots can expand access to virological monitoring of HIV treatment in
resource-lim-ited settings. J. Antimicrob. Chemother.64:1126–1129.
26.Kaiser, P., B. Joos, B. Niederost, R. Weber, H. F. Gunthard, and M. Fischer.
2007. Productive human immunodeficiency virus type 1 infection in periph-eral blood predominantly takes place in CD4/CD8 double-negative T
lym-phocytes. J. Virol.81:9693–9706.
27.Kupfer, B., B. Matz, M. P. Daumer, F. Roden, J. K. Rockstroh, N. Qurishi, U. Spengler, and R. Kaiser.2007. Frequent detection of cell-associated
HIV-1 RNA in patients with plasma viral load⬍50 copies/ml. J. Med. Virol.
79:1440–1445.
28.Lee, T. H., R. R. Stromberg, J. W. Heitman, L. Sawyer, C. V. Hanson, and M. P. Busch.1998. Distribution of HIV type 1 (HIV-1) in blood components: detection and significance of high levels of HIV-1 associated with platelets.
Transfusion38:580–588.
29.Mellors, J. W., C. R. Rinaldo, Jr., P. Gupta, R. M. White, J. A. Todd, and L. A. Kingsley.1996. Prognosis in HIV-1 infection predicted by the quantity
of virus in plasma. Science272:1167–1170.
30.Mellors, J. W., A. Munoz, J. V. Giorgi, J. B. Margolick, C. J. Tassoni, P. Gupta, L. A. Kingsley, J. A. Todd, A. J. Saah, R. Detels, J. P. Phair, and C. R. Rinaldo, Jr.1997. Plasma viral load and CD4⫹lymphocytes as prognostic
markers of HIV-1 infection. Ann. Intern. Med.126:946–954.
31.Moir, S., A. Malaspina, Y. Li, T. W. Chun, T. Lowe, J. Adelsberger, M. Baseler, L. A. Ehler, S. Liu, R. T. Davey, Jr., J. A. Mican, and A. S. Fauci.
2000. B cells of HIV-1-infected patients bind virions through CD21-comple-ment interactions and transmit infectious virus to activated T cells. J. Exp.
Med.192:637–646.
32.Monleau, M., C. Montavon, C. Laurent, M. Segondy, B. Montes, E. Dela-porte, F. Boillot, and M. Peeters.2009. Evaluation of different RNA extrac-tion methods and storage condiextrac-tions of dried plasma or blood spots for human immunodeficiency virus type 1 RNA quantification and PCR
ampli-fication for drug resistance testing. J. Clin. Microbiol.47:1107–1118.
33.O’Brien, W. A., P. M. Hartigan, E. S. Daar, M. S. Simberkoff, and J. D. Hamilton.1997. Changes in plasma HIV RNA levels and CD4⫹lymphocyte counts predict both response to antiretroviral therapy and therapeutic failure.
VA Cooperative Study Group on AIDS. Ann. Intern. Med.126:939–945.
34.Olinger, G. G., M. Saifuddin, and G. T. Spear.2000. CD4-negative cells bind human immunodeficiency virus type 1 and efficiently transfer virus to T cells.
J. Virol.74:8550–8557.
35.Pasternak, A. O., K. W. Adema, M. Bakker, S. Jurriaans, B. Berkhout, M. Cornelissen, and V. V. Lukashov.2008. Highly sensitive methods based on seminested real-time reverse transcription-PCR for quantitation of human immunodeficiency virus type 1 unspliced and multiply spliced RNA and
proviral DNA. J. Clin. Microbiol.46:2206–2211.
36.Saah, A. J., and D. R. Hoover.1997. “Sensitivity” and “specificity” reconsid-ered: the meaning of these terms in analytical and diagnostic settings. Ann.
Intern. Med.126:91–94.
37.Semple, M., C. Loveday, I. Weller, and R. Tedder.1991. Direct measurement of viraemia in patients infected with HIV-1 and its relationship to disease
progression and zidovudine therapy. J. Med. Virol.35:38–45.
38.Stevens, W., L. Erasmus, M. Moloi, T. Taleng, and S. Sarang.2008. Perfor-mance of a novel human immunodeficiency virus (HIV) type 1 total nucleic acid-based real-time PCR assay using whole blood and dried blood spots for
diagnosis of HIV in infants. J. Clin. Microbiol.46:3941–3945.
39.Tobler, L. H., J. Dockter, S. L. Stramer, S. H. Kleinman, D. Todd, C. Giachetti, and M. P. Busch.2002. Use of the Procleix HIV-1 and HCV discriminatory assays to detect HIV and HCV RNA in whole blood.
Trans-fusion42:1525–1527.
40.Torre, D., and A. Pugliese.2008. Platelets and HIV-1 infection: old and new
aspects. Curr. HIV Res.6:411–418.
41.Waters, L., A. Kambugu, H. Tibenderana, D. Meya, L. John, S. Mandalia, M. Nabankema, I. Namugga, T. C. Quinn, B. Gazzard, S. J. Reynolds, and M. Nelson. 2007. Evaluation of filter paper transfer of whole-blood and plasma samples for quantifying HIV RNA in subjects on antiretroviral
ther-apy in Uganda. J. Acquir. Immune Defic. Syndr.46:590–593.
42.World Health Organization.2006. Antiretroviral therapy for HIV infection in adults and adolescents: recommendations for a public health approach. 43.World Health Organization, Joint United Nations Programme on HIV/
AIDS, and United Nations International Children’s Emergency Fund.2009. Towards universal access: scaling up priority HIV/AIDS interventions in the health sector. Progress report 2009. World Health Organization, Geneva, Switzerland. http://www.who.int/hiv/pub/tuapr_2009_en.pdf.
44.Zhu, T., D. Muthui, S. Holte, D. Nickle, F. Feng, S. Brodie, Y. Hwangbo, J. I. Mullins, and L. Corey.2002. Evidence for human immunodeficiency virus
type 1 replication in vivo in CD14⫹monocytes and its potential role as a
source of virus in patients on highly active antiretroviral therapy. J. Virol.
76:707–716.