Schelling’s Conjecture on Climate and Development: A Test
David Anthoff*; Richard S.J. Tol**
Abstract
: We use the integrated assessment model
FUND
to compute the income
elasticities of climate change impacts for different world regions over time. We find
limited support for Schelling’s Conjecture that development might be the best
defense against climate change impacts, and for the idea that the impacts from
climate change might be akin to a “luxury good”. For very poor regions, an increase
in income in the short run is an effective tool to reduce impacts from climate change
by making those societies less vulnerable, in particular to infectious diseases. While
net climate impacts appear to be akin to a luxury good for some countries at specific
times, that effect disappears in the long run as impacts from agriculture make up a
large share of total impacts.
Corresponding Author: [email protected]
*University of California, Berkeley, CA, USA
**Economic and Social Research Institute, Dublin, Ireland
Institute for Environmental Studies, Vrije Universiteit, Amsterdam, The Netherlands Department of Spatial Economics, Vrije Universiteit, Amsterdam, The Netherlands Department of Economics, Trinity College, Dublin, Ireland
ESRI working papers represent un-refereed work-in-progress by researchers who are solely responsible for the content and any views expressed therein. Any comments on these papers will be welcome and should be sent to the author(s) by email. Papers may be downloaded for personal use only.
Schelling’s Conjecture on Climate and Development: A Test
1. Introduction
A decade ago Thomas Schelling proposed a controversial hypothesis: the best defense for poor societies against climate change impacts might be to develop quickly. This would be a more promising strategy for poor countries than to control greenhouse gas emissions (Schelling 1992). We test this hypothesis with the integrated assessment model FUND. Out of a number of otherwise similar models FUND is unique in its rich representation of the interplay of economic development and climate change impacts. We find support for Schelling’s hypothesis in very poor regions. Once regions have reached a certain level of development, further increases in development no longer reduce the impacts from climate change, though.
Most integrated assessment models assume functional forms for the impacts of climate change that mask any such effect. One example is the influential DICE model and its derivatives (Nordhaus and Boyer 2000; Nordhaus 2008). The damage function in DICE is a function of the global average temperature increase since pre-industrial times; it returns the welfare impact of climate change as a percentage of GDP. By assumption, therefore, damages from climate change always increase with GDP, and proportionally so.
3
Weitzman (2010) also investigates the functional form of the damage function from a theoretical point of view. He develops a general damage function that is isomorphic to a setup with a utility function that depends both on consumption and environmental quality. His general damage function embeds two special types of damage functions, namely an additive and a multiplicative form, both of which have been discussed previously in the literature and correspond to two damage functions discussed below.
The FUND model is the only integrated assessment model that specifies the relationship between temperature increases and income increases on human welfare in some detail. There are three features that make it uniquely suited to investigate the relationship between economic development and climate impacts. First, it has regionally disaggregated estimates of climate impacts. This allows for a differentiated view that takes into account different levels of development of different regions. Second, climate impacts in FUND are specified separately for different kinds of impacts that effect human welfare. As such, structural differences between regions in the vulnerability to climate change impacts are accounted for: FUND will not produce impacts from e.g. sea-level rise if a region doesn’t have a coast line. Finally, different kinds of impacts react differently to development (income, urbanization, age structure, economic structure, technology) in the affected region.
This structure of the FUND model allows us to compute the overall income elasticity of climate impacts for each region over time. Such an estimate will mainly depend on the income elasticities that have been estimated in previous work for each individual kind of impact and the share each of these impacts has in total impacts. An estimate of the income elasticity of impacts is a first attempt to answer the original question: How do impacts in different regions change at the margin if that society was a tiny bit wealthier than in the assumed scenarios of economic growth and development? And will that increase in wealth or development reduce or increase the impacts from climate change?
We present the precise methodology used in section 2 and a description of the integrated assessment model FUND in section 3. Section 4 presents and discusses results, and section 5 concludes and hints at further research topics.
2. Concepts
2.1. Income Elasticities of Climate Change Damages
why this is an interesting exercise with the FUND model, but not with a range of other, simpler models.
Let the impacts of climate change at a particular point in time in a particular region be given as
(1)
Here is the total impact in the unit of equivalent consumption, expressed in USD, in
region at time . We assume that impacts depend on income in the same region at the
same time as well as on a vector of other variables .
Our definition of the income elasticity of the damages is just the standard one. First define (2)
to be the change in damages at time in region from the addition of a small extra amount
of income . The income elasticity of impacts in region at time is then readily given by
(3)
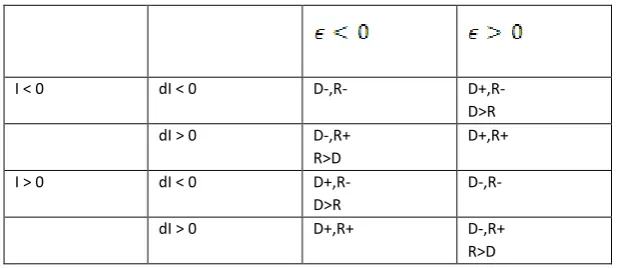
2.2. A classification
The interpretation of a positive vs negative income elasticity of impacts changes with the sign of the total impacts. For beneficial impacts from climate change, a positive income elasticity means that those benefits increase with income, whereas a negative income elasticity implies that the beneficial impacts from climate change decrease with income. If climate change is harmful, a negative income elasticity means that rising incomes reduce those harmful impacts, whereas a positive income elasticity implies that anincome rise increases the harmful impacts from climate change.
5
Income elasticities larger than one have a special significance: they suggest that the valuation of climate change impacts not only increases with an increase in income, but that the increase in valuation of the climate impact is even larger in percentage term than the increase in income. Such cases are similar to “luxury goods” from standard economics, i.e. things that people care more about the wealthier they get.
2.3. Functional Forms for Damage Functions
We next discuss two specific functional damage forms that have been used or discussed in the climate change economics literature, followed by an introduction to the damage function used by FUND.
The widely used DICE integrated model of climate change uses the following specific functional form for climate change impacts:
(4)
Here is climate change impact at time in region , is a parameter and is the
assumed temperature increase at time in region of the underlying model. In this
specification, the income elasticity is 1.
Others have suggested that the appropriate damage function should not depend at all on income, i.e. that impacts from climate change are absolute and do not depend economic development. In our framework this damage function would have the form
(5)
Here is climate change impact at time in region , is simply some function of
the temperature that is assumed in the scenario for which climate damages are to be computed.
Again, computing the income elasticity for such a damage function is trivial: it is 0.
(6)
is the damage function for sector in region at time , assuming a given
temperature trajectory. The individual damage functions in FUND range from fairly simple functional forms to complex sub-models of e.g. sea-level rise. For the purpose of this paper the main observation is that for each type of impact the income elasticity is different and calibrated to estimates from the impacts and valuation literature. As such, the income elasticity that we compute for a specific region and time will depend on the assumed income elasticities of the various damage categories that are accounted for in FUND and the shares of the various impact categories in the total impacts of a given region.
3. The Model
This paper uses version 3.6 of the Climate Framework for Uncertainty, Negotiation and Distribution (FUND). Version 3.6 of FUND corresponds to version 1.6 (Tol 1999; Tol 2001; Tol 2002c) except for the impact module described in (Tol 2002a; Tol 2002b; Link and Tol 2004). A full list of papers, the source code, and the technical documentation for the model can be found on line at http://www.fund-model.org.
In many ways, FUND is a standard integrated assessment model (Tol 1997; Tol 1999; Guo et al. 2006; Tol 2006). It has simple representations of the demography, economy, energy, emissions, and emission reduction policies for 16 regions. It has simple representations of the cycles of greenhouse gases, radiative forcing, climate, and sea level rise. In other ways, though, FUND is unique. It is alone in the detail of its representation of the impacts of climate change. Impacts on agriculture, forestry, water use, energy use, the coastal zone, hurricanes, ecosystems, and health are all modelled separately – both in “physical” units and their monetary value (Tol 2002a; Tol 2002b). Moreover, FUND allows vulnerability to climate change impacts to be an explicit function of the level and rate of regional development (Tol 2005; Tol et al. 2007).
7
4. Results
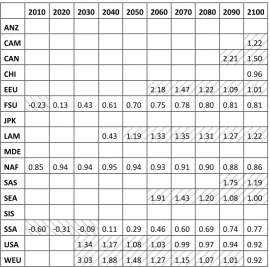
Table 2 and 3 show the estimated income elasticities of climate change impacts for ten selected years and all 16 regions of the FUND model. Table 2 shows the elasticities for regions and times with estimated damages from climate change. Table 3 shows elasticities for regions and times with estimated benefits from climate change.
We removed income elasticity estimates for time periods that are adjacent to a switch from beneficial to harmful impacts. These elasticities are estimated very close to zero impacts and are distorted by limited numerical precision.
Income elasticities vary greatly between regions and change over time. They range from <-1 to >1, which suggests that depending on the circumstances of the society affected, additional income might reduce or increase impacts from climate change. This confirms earlier findings about climate change impacts: They are highly heterogeneous across time and space and aggregated net world impact estimates hide a lot of the distributional consequences of climate impacts. The observation also suggests that what we have come to call Schelling’s Conjecture might be true for some regions in some time periods but not as a general feature of climate impacts.
If the income elasticity of impacts is greater than unity, impacts and impacts relative to income rise with income. In this case, the discount rate would effectively fall in a reduced-complexity model a la Sterner and Persson (2008). Only the former Soviet Union (FSU), North Africa (NAF) and Sub-Saharan Africa (SSA) never have an income elasticity larger than 1 (for the period analyzed in this paper). The reason is that the damage categories that have income elasticities larger than 1 in FUND -- namely biodiversity loss, dryland loss, wetland loss and emigration and immigration due to sea-level rise -- do not play a significant role in these regions. Sea-level rise is less of an issue in the former Soviet Union because most of its coast is uninhabited. In Africa, coastal protection rapidly expands with development. Forced migrations would rarely move to any of these three regions. Finally, all three regions value biodiversity loss less than is the case in other regions due to their relatively slow economic development.
If the income elasticity of impacts is negative, Schelling’s Conjecture may hold. Development policy would reduce the impact of climate change, and may be preferred over greenhouse gas emission reduction.
Among regions and times with net damages, only the former Soviet Union and Sub-Saharan Africa ever have negative income elasticities. In the former Soviet Union this effect is only present in the first decade, and in sub-Saharan Africa it quickly disappears towards the middle of the century. In the former Soviet Union this is driven by a stark reduction in diarrhea deaths. In sub-Saharan Africa, improvements in basic health care also explain the negative income elasticity: Both diarrhea and malaria deaths constitute a large portion of total damages in poor sub-Saharan Africa and these infectious diseases rapidly fall with economic growth. Once Sub-Saharan Africa has left its extreme poverty (an assumption made in all of the commonly used socio economic scenarios employed in climate change analysis), the further reduction in deaths from these diseases from an incremental increase in income is reduced.
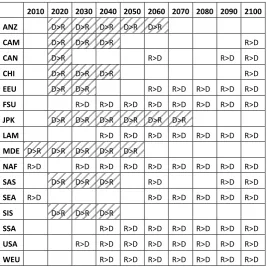
So far, we discussed the case of net damages of climate change. Climate change also has positive impacts, and these may dominate the negative effects in some periods and regions. In this case, the interpretation of the income elasticities changes. The income elasticities for these cases are presented in Table 3. The estimated income elasticities for these cases show a much more homogenous picture than for net damages. Most income elasticities in this case are between 0 and 1, suggesting that while absolute benefits from higher temperatures would increase with higher incomes, relative benefits fall. Income elasticities fall over time in almost all cases.
The main benefits are increased agricultural yield (CO2 fertilization in all regions and a more
beneficial climate in some) and reductions in heating costs. Heating benefits saturate over time, once a region has reached a climate that does not require any heating anymore at all, further temperature increases are not yielding any further benefits. For both sectors, the income elasticities are between 0 and 1 and that explains why the overall income elasticities for regions and times with net benefits stay in the same range.
5. Conclusion
9
For very poor societies, we find strong confirmation of Schelling’s Conjecture. Impacts are dominated by health impacts in those regions and those are the kinds of impacts that fade dramatically as societies develop and get richer. While we do not see this effect for more than a few decades, this result is most likely driven by strong, and maybe questionable, assumptions of the underlying socio economic scenario. Almost all scenarios that are used in climate change analysis make strong assumptions about economic development. Today’s very poor regions are assumed to develop quickly, and for all practical purposes no single region will be “left behind” or stay at a development level as seen today. This seems an area for future research: if some regions stay poor throughout the century, it is highly likely that even small increases in wealth might be the best way to lower the harmful impacts from climate change.
For wealthier regions we see that at least until temperatures reach high levels, climate impacts show characteristics of a “luxury good”, i.e. the valuation of a given temperature increase reacts more than proportional to an increase in income. But this effect wanes at later times, once agricultural impacts begin to dominate the total damage estimates.
In some cases we can clearly say that either more development (i.e. an increase in income) or emission reductions would have a beneficial effect on climate impacts, and not the other. Those cases are presented in Table 4. In later years in particular, when climate change gets more severe, emission reduction clearly dominates as a tool to reduce climate impacts (note though, that we only look at the effect of development on impacts. While impacts might increase with an increase in income, that situation might still be preferred because impacts might increase slower than income).
The conclusions we take from our results are twofold. First, we believe our results show that careful empirical analysis that takes into account regional and sectorial heterogeneities is required to answer bold questions such as whether climate change impacts are a luxury good or whether development might be the best approach to lower climate impacts. Most likely, simple answers cannot be found, in many cases the answer will depend crucially on the circumstances. Our results rest on a large number of assumptions, but we believe the finding that income elasticities vary greatly between regions and time is a robust result. Second, we also believe that the few results on very poor regions (essentially sub-Saharan Africa for the first couple of decades of this century) make for a compelling argument along Schelling’s Conjecture, namely that especially for very poor regions development is key to avoid the worst impacts from climate change.
that are used are estimated on very limited data sets from a few geographical locations and are then extrapolated to the rest of the world. Our analysis ignores all aspects of uncertainty, in particular the potential for catastrophic but unlikely outcomes. The potential for catastrophes has been suggested as the real reason for concern about climate change (Weitzman 2009). More research in this area, especially more original studies of climate change impacts, would certainly be most welcome.
Our results should be of interest for quite a large number of issues that have been discussed in the climate change economics literature in recent years. First, as Schelling has pointed out himself (Schelling 1999) there is a direct connection between discounting and distributional questions and the income elasticity of climate impacts. A marginal change in income will also change marginal utility of a region, and when a Ramsey framework is used, this will change the discount rate. It is the interaction of the effect on the discount rate and on the estimated damages that will determine how the net present value of impacts changes when income changes, they key measure that would drive today’s policy decisions. Second, the income elasticities of impacts should also have an effect on risk adjustments to the computation of the net present value of expected damages, when uncertainty is introduced into a model like FUND. Future research on both questions would be most welcome.
Acknowledgements
We thank Robert Hahn, James Hammitt, an anonymous reviewer and participants of the workshop in honor of Thomas Schelling for helpful comments. All remaining errors are ours. David Anthoff thanks the Ciriacy Wantrup Fellowship program for support.
Bibliography
Guo, J., C. J. Hepburn, R. S. J. Tol and D. Anthoff (2006). 'Discounting and the social cost of carbon: a closer look at uncertainty'. Environmental Science & Policy, 9/3: 205-216. Hasselmann, K., S. Hasselmann, R. Giering, V. Ocana and H. von Stoch (1997). 'Sensitivity
study of optimal CO2 emission paths using a simplified Structural Integrated Assessment Model (SIAM)'. Climatic Change, 37/2: 345-386.
Hoel, M. and T. Sterner (2007). 'Discounting and relative prices'. Climatic Change, 84: 265-280.
Horowitz, J. K. (2002). 'Preferences in the Future'. Environmental and Resource Economics, 21: 241-259.
11
Nordhaus, W. D. and J. Boyer (2000). Warming the World: Economics Models of Global Warming. Cambridge: MIT Press.
Schelling, T. C. (1992). 'Some Economics of Global Warming'. The American Economic Review, 82/1: 1-14.
Schelling, T. C. (1999). 'Intergenerational Discounting', in P. R. Portney and J. P. Weyant (eds.), Discounting and intergenerational equity. Washington, DC: Resources for the Future.
Sterner, T. and U. M. Persson (2008). 'An Even Sterner Review: Introducing Relative Prices into the Discounting Debate'. Review of Environmental Economics and Policy, 2/1: 1–16. Tol, R. S. J. (1995). 'The Damage Costs of Climate Change Toward More Comprehensive
Calculations'. Environmental and Resource Economics, 5/4: 353-374.
Tol, R. S. J. (1997). 'On the Optimal Control of Carbon Dioxide Emissions -- An Application of FUND'. Environmental Modelling and Assessment, 2: 151-163.
Tol, R. S. J. (1999). 'The Marginal Costs of Greenhouse Gas Emissions'. The Energy Journal, 20/1: 61-81.
Tol, R. S. J. (2001). 'Equitable cost-benefit analysis of climate change policies'. Ecological Economics, 36: 71-85.
Tol, R. S. J. (2002a). 'Estimates of the damage costs of climate change. Part 1: Benchmark estimates'. Environmental and Resource Economics, 21/2: 47-73.
Tol, R. S. J. (2002b). 'Estimates of the damage costs of climate change. Part 2: Dynamic estimates'. Environmental and Resource Economics, 21/2: 135-160.
Tol, R. S. J. (2002c). 'Welfare specifications and optimal control of climate change: an application of fund'. Energy Economics, 24: 367-376.
Tol, R. S. J. (2005). 'Emission Abatement versus Development as Strategies to Reduce Vulnerability to Climate Change: An Application of FUND'. Environment and Development Economics, 10: 615-629.
Tol, R. S. J. (2006). 'Multi-Gas Emission Reduction for Climate Change Policy: An Application of FUND'. Energy Journal, 27: 235-250.
Tol, R. S. J. (2007). 'The double trade-off between adaptation and mitigation for sea level rise: an application of FUND'. Mitigation and Adaptation Strategies for Global Change, 12/5: 741-753.
Tol, R. S. J. and H. Dowlatabadi (2001). 'Vector-Borne Diseases, Development & Climate Change'. Integrated Assessment, 2/4: 173-181.
Tol, R. S. J., K. L. Ebi and G. W. Yohe (2007). 'Infectious disease, development, and climate change: A scenario analysis'. Environment and Development Economics, 12/5: 687-706. Weitzman, M. L. (2009). 'On Modeling and Interpreting the Economics of Catastrophic
Climate Change'. The Review of Economics and Statistics, 91/1: 1-19.
Weitzman, M. L. (2010). 'What is the “Damages Function” for Global Warming — and what Difference might it make?'. Climate Change Economics, 1/1: 57-69.
Yang, Z. (2003). 'Dual-rate discounting in dynamic economic–environmental modeling'.
Results
I < 0 dI < 0 D-,R- D+,R- D>R dI > 0 D-,R+
R>D
D+,R+
I > 0 dI < 0 D+,R- D>R
D-,R-
[image:12.595.88.397.114.248.2]dI > 0 D+,R+ D-,R+ R>D
13
2010 2020 2030 2040 2050 2060 2070 2080 2090 2100
ANZ
CAM 1.22
CAN 2.21 1.50
CHI 0.96
EEU 2.18 1.47 1.22 1.09 1.01
FSU -0.23 0.13 0.43 0.61 0.70 0.75 0.78 0.80 0.81 0.81
JPK
LAM 0.43 1.19 1.33 1.35 1.31 1.27 1.22
MDE
NAF 0.85 0.94 0.94 0.95 0.94 0.93 0.91 0.90 0.88 0.86
SAS 1.75 1.19
SEA 1.91 1.43 1.20 1.08 1.00
SIS
SSA -0.60 -0.31 -0.09 0.11 0.29 0.46 0.60 0.69 0.74 0.77
USA 1.34 1.17 1.08 1.03 0.99 0.97 0.94 0.92
[image:13.595.163.434.120.387.2]WEU 3.03 1.88 1.48 1.27 1.15 1.07 1.01 0.92
2010 2020 2030 2040 2050 2060 2070 2080 2090 2100
ANZ 0.62 0.62 0.62 0.61 0.61 0.60 0.59 0.58 0.56 0.53
CAM 0.97 0.82 0.72 0.64 0.56 0.45 0.20
CAN 0.49 0.44 0.37 0.27 0.11 -0.20
CHI 0.70 0.69 0.67 0.66 0.65 0.63 0.58
EEU 0.50 0.34 0.02
FSU
JPK 0.56 0.55 0.55 0.54 0.54 0.53 0.51 0.49 0.45 0.40
LAM 9.77
MDE 0.78 0.84 0.79 0.76 0.74 0.72 0.70 0.67 0.64 0.56
NAF
SAS 0.64 0.35 0.23 0.14 0.06 -0.16
SEA -0.74 -1.10 -2.11
SIS 0.78 0.75 0.93 0.82 0.74 0.69 0.62 0.52
SSA
USA
[image:14.595.164.434.117.389.2]WEU
15
2010 2020 2030 2040 2050 2060 2070 2080 2090 2100
ANZ D>R D>R D>R D>R D>R
CAM D>R D>R D>R R>D
CAN D>R R>D R>D R>D
CHI D>R D>R D>R R>D
EEU D>R D>R R>D R>D R>D R>D R>D
FSU R>D R>D R>D R>D R>D R>D R>D R>D
JPK D>R D>R D>R D>R D>R D>R
LAM R>D R>D R>D R>D R>D R>D R>D
MDE D>R D>R D>R D>R D>R
NAF R>D R>D R>D R>D R>D R>D R>D R>D R>D
SAS D>R D>R D>R R>D R>D R>D
SEA R>D R>D R>D R>D R>D R>D
SIS D>R D>R D>R
SSA R>D R>D R>D R>D R>D R>D R>D
USA R>D R>D R>D R>D R>D R>D R>D R>D
[image:15.595.165.433.92.359.2]WEU R>D R>D R>D R>D R>D R>D R>D
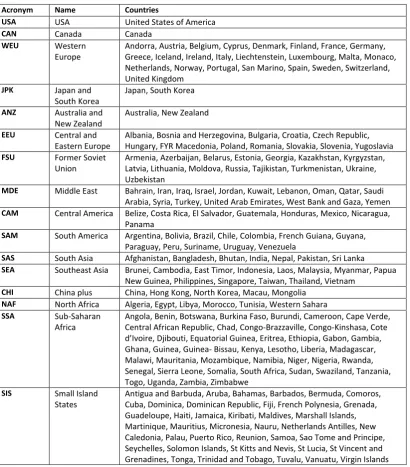
Acronym Name Countries
USA USA United States of America
CAN Canada Canada
WEU Western Europe
Andorra, Austria, Belgium, Cyprus, Denmark, Finland, France, Germany, Greece, Iceland, Ireland, Italy, Liechtenstein, Luxembourg, Malta, Monaco, Netherlands, Norway, Portugal, San Marino, Spain, Sweden, Switzerland, United Kingdom
JPK Japan and South Korea
Japan, South Korea ANZ Australia and
New Zealand
Australia, New Zealand EEU Central and
Eastern Europe
Albania, Bosnia and Herzegovina, Bulgaria, Croatia, Czech Republic, Hungary, FYR Macedonia, Poland, Romania, Slovakia, Slovenia, Yugoslavia FSU Former Soviet
Union
Armenia, Azerbaijan, Belarus, Estonia, Georgia, Kazakhstan, Kyrgyzstan, Latvia, Lithuania, Moldova, Russia, Tajikistan, Turkmenistan, Ukraine, Uzbekistan
MDE Middle East Bahrain, Iran, Iraq, Israel, Jordan, Kuwait, Lebanon, Oman, Qatar, Saudi Arabia, Syria, Turkey, United Arab Emirates, West Bank and Gaza, Yemen CAM Central America Belize, Costa Rica, El Salvador, Guatemala, Honduras, Mexico, Nicaragua,
Panama
SAM South America Argentina, Bolivia, Brazil, Chile, Colombia, French Guiana, Guyana, Paraguay, Peru, Suriname, Uruguay, Venezuela
SAS South Asia Afghanistan, Bangladesh, Bhutan, India, Nepal, Pakistan, Sri Lanka SEA Southeast Asia Brunei, Cambodia, East Timor, Indonesia, Laos, Malaysia, Myanmar, Papua
New Guinea, Philippines, Singapore, Taiwan, Thailand, Vietnam CHI China plus China, Hong Kong, North Korea, Macau, Mongolia
NAF North Africa Algeria, Egypt, Libya, Morocco, Tunisia, Western Sahara SSA Sub-Saharan
Africa
Angola, Benin, Botswana, Burkina Faso, Burundi, Cameroon, Cape Verde, Central African Republic, Chad, Congo-Brazzaville, Congo-Kinshasa, Cote d’Ivoire, Djibouti, Equatorial Guinea, Eritrea, Ethiopia, Gabon, Gambia, Ghana, Guinea, Guinea- Bissau, Kenya, Lesotho, Liberia, Madagascar, Malawi, Mauritania, Mozambique, Namibia, Niger, Nigeria, Rwanda, Senegal, Sierra Leone, Somalia, South Africa, Sudan, Swaziland, Tanzania, Togo, Uganda, Zambia, Zimbabwe
SIS Small Island States
[image:16.595.94.505.79.547.2]17
2010 2020 2030 2040 2050 2060 2070 2080 2090 2100
[image:17.595.89.515.94.361.2]Year Number
Title/Author(s)
ESRI Authors/Co-authors Italicised
2011
389 The Role of Decision-Making Biases in Ireland’s Banking Crisis
2011 Pete Lunn
388 Greener Homes: An Ex-Post Estimate of the Cost of Carbon Dioxide Emission Reduction using Administrative Micro-Data from the Republic of Ireland
Eimear Leahy, Richard S.J. Tol
387 Credit Where Credit’s Due: Accounting for Co-Authorship in Citation Counts
Richard S.J. Tol
386 Does the housing market reflect cultural heritage? A case study of Greater Dublin
Mirko Moro, Karen Mayor, Seán Lyons and Richard S.J. Tol
385 What Can I Get For It? A Theoretical and Empirical Re-Analysis of the Endowment Effect
Pete Lunn, andMary Lunn
384 The Irish Economy Today: Albatross or Phoenix?
John Fitz Gerald
383 Merger Control in Ireland: Too Many Unnecessary Merger Notifications?
Paul K Gorecki
382 The Uncertainty About the Total Economic Impact of Climate Change
Richard S.J. Tol
381 Trade Liberalisation and Climate Change: A CGE Analysis of the Impacts on Global Agriculture
Alvaro Calzadilla, Katrin Rehdanz and Richard S.J. Tol
380 The Marginal Damage Costs of Different Greenhouse Gases: An Application of FUND
David Anthoff, Steven Rose, Richard S.J. Tol and Stephanie Waldhoff
379 Revising Merger Guidelines: Lessons from the Irish Experience
Paul K. Gorecki