Journal of Neural Engineering
PAPER • OPEN ACCESS
Cortical excitability correlates with the
event-related desynchronization during brain–computer
interface control
To cite this article: Ian Daly et al 2018 J. Neural Eng. 15 026022
View the article online for updates and enhancements.
Related content
Combined rTMS and virtual reality brain–computer interface training for motor recovery after stroke
N N Johnson, J Carey, B J Edelman et al.
-Motor imagery-induced EEG patterns in individuals with spinal cord injury and their impact on brain--computer interface accuracy
G R Müller-Putz, I Daly and V Kaiser
-Sensorimotor rhythm-based brain--computer interface training
F Pichiorri, F De Vico Fallani, F Cincotti et al.
-1. Introduction
Brain–computer interfaces (BCIs) can be used to translate planned movements into the actions of a computer or robotic system [1, 2]. They do so by detecting the event-related desyn-chronization (ERD) in the electroencephalogram (EEG), a
localised reduction in ongoing sensorimotor rhythm power (in the frequency band 8–20 Hz) related to body movement imagination and execution [3]. The ERD is observed even in cases when the user of the BCI did not produce any muscle activity [4]. Thus, BCIs can be constructed based on either movement execution or imagination. This type of movement imagination/execution based BCI has numerous potential applications, including for communication [5], robot control [6], and wheelchair control [7].
One promising application of ERD-based BCI is stroke rehabilitation [8] and other forms of movement assistance and rehabilitation [9]. By detecting attempted movements a BCI Journal of Neural Engineering
Cortical excitability correlates with the
event-related desynchronization during
brain–computer interface control
Ian Daly1 , Caroline Blanchard2 and Nicholas P Holmes3,4
1 Brain–Computer Interfaces and Neural Engineering Laboratory, School of Computer Science
and Electronic Engineering, University of Essex, Colchester, CO4 3SQ, United Kingdom
2 Radiological Sciences Research Group, Division of Clinical Neuroscience, University of Nottingham,
Queens Medical Centre, Nottingham, NG7 2UH, United Kingdom
3 School of Psychology, University of Nottingham, Nottingham, United Kingdom
E-mail: [email protected] and [email protected]
Received 7 June 2017, revised 24 October 2017 Accepted for publication 22 November 2017 Published 14 February 2018
Abstract
Objective. Brain–computer interfaces (BCIs) based on motor control have been suggested as tools for stroke rehabilitation. Some initial successes have been achieved with this approach, however the mechanism by which they work is not yet fully understood. One possible part of this mechanism is a, previously suggested, relationship between the strength of the event-related desynchronization (ERD), a neural correlate of motor imagination and execution, and corticospinal excitability. Additionally, a key component of BCIs used in neurorehabilitation is the provision of visual feedback to positively reinforce attempts at motor control. However, the ability of visual feedback of the ERD to modulate the activity in the motor system has not been fully explored. Approach. We investigate these relationships via transcranial magnetic stimulation delivered at different moments in the ongoing ERD related to hand contraction and relaxation during BCI control of a visual feedback bar. Main results. We identify a significant relationship between ERD strength and corticospinal excitability, and find that our visual feedback does not affect corticospinal excitability. Significance. Our results imply that efforts to promote functional recovery in stroke by targeting increases in corticospinal excitability may be aided by accounting for the time course of the ERD.
Keywords: brain state dependent brain stimulation, EEG, BCI, TMS, ERD, neurorehabilitation, motor evoked potentials
(Some figures may appear in colour only in the online journal)
I Daly et al
Cortical excitability correlates with the event-related desynchronization during brain–computer interface control
Printed in the UK
026022 JNEIEZ
© 2018 IOP Publishing Ltd 15
J. Neural Eng.
JNE
1741-2552
10.1088/1741-2552/aa9c8c
Paper
2
Journal of Neural Engineering IOP
Original content from this work may be used under the terms of the Creative Commons Attribution 3.0 licence. Any further distribution of this work must maintain attribution to the author(s) and the title of the work, journal citation and DOI.
2018
4 Author to whom any correspondence should be addressed.
may be used to provide positive reinforcement feedback to an individual undergoing stroke rehabilitation while they attempt to perform movement. A measure of the ongoing sensorimotor rhythm activity that reflects attempted movement, the ERD strength [3, 10], is fed back to the user of the BCI system via a visual feedback modality. The ERD reflects movement inten-tion and may be observed even in cases where no movement is achieved [11], thus it is suitable for use in stroke rehabilita-tion, wherein individuals attempt to move but may be unable to achieve movement. The feedback of the ERD aims to increase corticospinal excitability and hence lead to long term improve-ments in their movement strength [8, 12] and has been shown to result in an increase in functional recovery from stroke [13].
Functional recovery following stroke involves changes in levels of corticospinal excitability [14]. It has been suggested that the strength of the ERD may be a reliable index of cor-ticospinal excitability in both healthy individuals and stroke patients [15, 16]. Specifically, it has been reported that when brain stimulation is delivered at increasing ERD strengths the resulting motor evoked potential (MEP), a measure of corti-cospinal excitability, also increases [16].
Additionally, neural stimulation has been proposed as a tool to promote corticospinal excitability changes as an aid to stroke recovery. Specifically, techniques such as transcranial direct current stimulation (tDCS) and transcranial magnetic stimulation (TMS) have been shown to promote corticospinal excitability and aid stroke recovery [17]. However, the effi-cacy of this proposal is unclear. In particular, the nature of the relationship between the ERD and corticospinal excitability and the effect of ERD-based BCI use on corticospinal excit-ability remains an open-question.
We seek to further explore this relationship between ERD strength and corticospinal excitability. Specifically, we aim to identify how corticospinal activity changes as a function of ERD strength. We also aim to explore how TMS affects levels of corticospinal excitability when used in a BCI con-text i.e. how the provision of visual feedback to a BCI user affects the relationship between different ERD strengths and corticospinal excitability. To this end we aimed to explore the effect of brain state dependent stimulation (the delivery of brain stimulation at a time point and/or magnitude deter-mined by direct measures of the current activity in the brain [18]) and its effect on the magnitude of the MEP. We also introduce direct visual feedback of measured ERD strengths to participants.
Additionally, we also seek to further explore initial observations made in previous explorations of the relation-ship between ERD strength and corticospinal excitability. Specifically, we introduce a sham stimulation condition to validate that the observed relationships between the ERD and corticospinal excitability, initially reported in [16], are a genuine result of brain state dependent stimulation. We used a BCI motor imagination/execution task, in which participants were asked to imagine and make hand contraction and relaxa-tion movements in response to a cue.
We make the following hypotheses:
(i) ERD strength is positively related to corticospinal excit-ability (confirming reports in [16]).
(ii) Visual feedback of ERD strength to participants (as used within BCI systems designed for aiding rehabilitation) modulates corticospinal excitability.
2. Methods
2.1. Participants
Twelve individuals (five male, four left handed, aged 21–36 yr, median age = 25) were recruited via email to participate in the experiments. Each participant provided informed consent to participate and was reimbursed for their participation with £20.00 (GBP) and up to £5.00 (GBP) for travel expenses.
Participants were recruited via email advertisements to a mailing list of participants who had previously participated in other TMS studies. Participants were screened on the basis that they were healthy adults in the age range 18–65 yr at the time of the study. Participants were screened for inclusion in the study based on the University of Reading School of Clinical Language Sciences rules of operation for TMS studies, which were based on the recommended screening procedures out-lined by Rossi et al [19]. No participants had prior experience with BCI systems.
Ethical approval for the study was granted by the University of Reading research ethics committee, where the research was conducted by the authors, who were based in this institution at the time of the research.
2.2. Experiment design
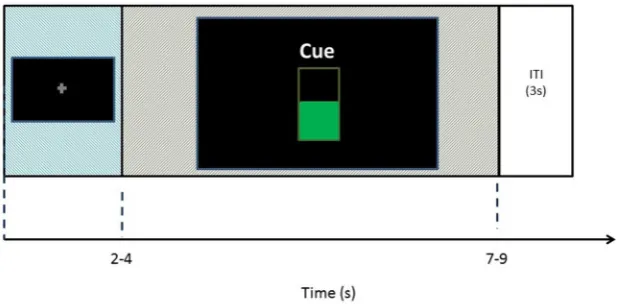
2.2.1. Structure. An overview of the experiment structure is illustrated in figure 1. The participant’s EEG is recorded and used to measure the strength of their ERD, which is then used to deliver stimulation and/or feedback, depending on the trial type. The resulting MEP is measured from the arm.
The experiment consisted of one session on a single day, which contained five runs. The first run was a calibration run, which aimed to identify the optimal scalp location for meas-uring each participant’s ERD via the EEG. This was followed by four testing runs, in which the participants were tasked with attempting right-hand contractions and relaxations during dif-ferent combinations of brain stimulation and both with and without visual feedback of their current ERD strength.
The calibration run consisted of 40 trials, of which 20 were cued movement trials and 20 were rest trials. For each trial type participants were first presented with a fixation cross in the centre of the screen, which remained on screen for between 2–4 s, pseudo-randomly drawn from a uniform dis-tribution. This was followed by a cue for 5 s, which indicated the action the participant should take; either ‘move’ or ‘rest’. For the ‘rest’ trials participants were instructed to remain still, avoiding arm movement, eye movement, and any other movements.
comfortable to them and keep repeating the movements while the ‘move’ cue remained on screen.
After the cue disappeared there was a 3 s inter-stimulus interval period before the next fixation cross appeared on screen. The trial timing is illustrated in figure 1. Trial types were pseudorandomly ordered.
During the testing runs, the trials were structured in the same way. However, there were three different types of cue presented to the participants. In addition to the ‘move’ and ‘rest’ cues, participants were also presented with a ‘move with feedback’ cue. This involved the presentation of visual feedback indicating the current ERD strength to the partici-pants and took the form of a vertical bar, which filled from the bottom of the screen and indicated the current moment-to-moment ERD strength of the participants, this is illustrated in the center of figure 2.
In addition, during some trials transcranial magnetic stim-ulation (TMS) (either real or sham) was delivered over the participant‘s motor cortex during the cued portion of the trial. Further details on this are described in subsequent sections.
2.2.2. Feedback. During the feedback trials participants were presented with a visual representation of their current ERD strength. This took the form of a vertical bar, which filled from the bottom upwards reflecting the current ERD(%). This is illustrated in the center of figure 2.
The feedback bar was updated once every 100 ms for the 5 s duration of the cued period of the trial. There were an equal number of feedback and non-feedback trials in the experi-ment and they were presented in pseudorandom order to the participant.
2.2.3. Experiment conditions. TMS was delivered to the participant’s stimulation location (see section 2.4) at dif-ferent time points in the trials determined by the ERD time course and depending on the trial type. Specifically, during a single trial TMS (either real or sham) was delivered either once or not at all according to the type of trial. There were a total of five types of trial used during the testing portion of the experiment.
Specifically, these trial types were differentiated by the time within the trial at which TMS was delivered. TMS was delivered at 10, 20, 30, and 40% of ERD strength and at 33 ms after the cue presentation time. By delivering TMS at these different points in the ERD time course it is possible to evaluate the relationship between ERD strength and cortical excitability.
[image:4.595.123.483.60.221.2]In addition to these conditions, a sham TMS condition was also used in which sham TMS was delivered in response to the same conditions (see section 2.4 for details). The experi-ment contained an equal number of both sham and real TMS conditions. Finally, there was also a rest condition in which no
Figure 1. Overview of the experiment structure. EEG is recorded and used to measure ERD strength. This is then used to deliver either visual feedback and/or TMS stimulation to the participants. The resulting MEP strengths are then measured via EMG.
[image:4.595.146.456.260.412.2]TMS (either real or sham) was delivered and the participant was instructed to just rest and avoid movement.
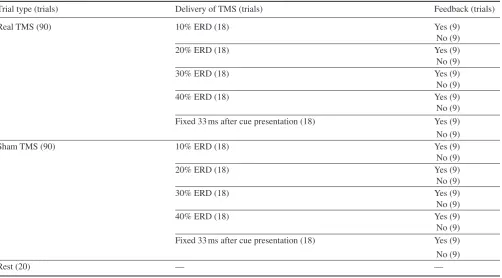
In summary, after the calibration run the experiment con-sisted of four test runs, each of which contained 50 trials. Forty-five percent of these 200 trials (90 trials) used real TMS and 45% used sham TMS. The remaining 10% were rest trials. Both the trials in which real TMS was delivered and sham TMS was delivered were split into five groups, each containing 18 trials. For each of these groups of trials TMS was delivered according to one of the conditions described above. Finally, of the 18 trials in each group half (nine trials) included the use of visual feedback of the ERD strength to the participant and half did not. This is summa-rised in table 1.
2.3. Recording
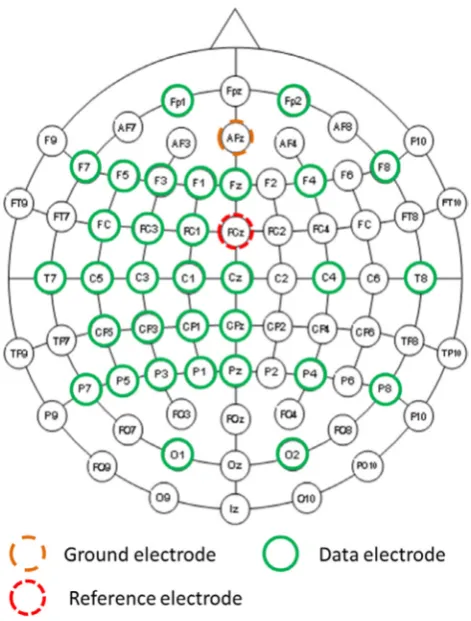
2.3.1. Electroencephalogram. The EEG was recorded from participants throughout the experiment via a 32-channel EEG amplifier (BrainProducts, Germany). EEG was recorded from 32 channels arranged following a modified version of the extended international 10/20 system for electrode placement, with electrodes clustered over the left motor cortex. This is illustrated in figure 3.
EEG was sampled at a rate of 500 Hz and impedances were kept below 10 kΩ for all channels over all participants.
2.3.2. Electromyogram. The electromyogram (EMG) was recorded from the participant‘s right forearm over the flexor digitorum superficialis muscle. The ground electrode was
attached to the styloid process of the ulna near the wrist. The EMG signals were recorded at a sample rate of 4000 Hz via a PowerLab data recording system (ADI instruments, USA).
2.4. Transcranial magnetic stimulation.
TMS was delivered in single pulses at key moments during the experiment via a MagStim 200 stimulator (MagStim, USA). A 10 mm diameter figure 8 coil was used to deliver the TMS at 120% of resting motor threshold, with thresholds identified for each participant prior to the testing runs [20].
Stimulation thresholds and locations for each partici-pant were identified, following procedures outlined in [20], by first systematically moving the stimulation coil over the left motor cortex in small incremental steps and periodically stimulating while visually inspecting the recorded EMG. When a good spot was found the resting threshold was then identified by increasing/decreasing the stimulation level until a level was found for which five out of ten stimulations produced a visible MEP (defined as an MEP with a peak-to-peak amplitude in the 50 ms after the TMS pulse of at least 50 μV).
[image:5.595.51.554.96.374.2]Sham TMS was delivered by a second figure 8 TMS coil from a second MagStim 200 system (BiStim2 2002). This coil was positioned approximately 10 cm above the participant’s head, far enough away to not cause any stimulation. This sham coil was stimulated with an additional 10% output to produce a similar acoustic effect for the participant to the real stimula-tion coil.
Table 1. Experimental conditions used. The numbers in brackets indicate the number of trials for which each condition was presented. Conditions were applied simultaneously, for example real TMS, applied at 10% of detected ERD strength with feedback presented to the participant was used in nine trials during the testing runs.
Trial type (trials) Delivery of TMS (trials) Feedback (trials)
Real TMS (90) 10% ERD (18) Yes (9)
No (9)
20% ERD (18) Yes (9)
No (9)
30% ERD (18) Yes (9)
No (9)
40% ERD (18) Yes (9)
No (9) Fixed 33 ms after cue presentation (18) Yes (9) No (9)
Sham TMS (90) 10% ERD (18) Yes (9)
No (9)
20% ERD (18) Yes (9)
No (9)
30% ERD (18) Yes (9)
No (9)
40% ERD (18) Yes (9)
No (9) Fixed 33 ms after cue presentation (18) Yes (9) No (9)
2.5. Brain–computer interface
A BCI was constructed to measure ERD strength and feed it back to participants during each trial.
2.5.1. Channel identification. ERD was used as a measure of movement intention [11]. The exact set of EEG channels that optimally record the ERD can differ between participants due to differences in head shape and small inter-participant differ-ences in EEG cap positioning [21]. Therefore, the calibration run was used to identify a set of EEG channels from which to get the best measure of the ERD from each participant.
A set of candidate bi-polar EEG channel pairs were con-sidered as possible candidate channel pairs from which to measure the ERD. These are listed in table 2.
The ERD strength was measured for each bi-polar channel pair for each trial in the calibration run. The pair of bi-polar channels which had the largest median recorded ERD during the move trials was then used as the channel pair for meas-uring the ERD strength from that participant dmeas-uring the sub-sequent runs.
2.5.2. Event-related desynchronization. The ERD was mea-sured by taking Welch’s power spectral density estimate of the magnitude of the EEG within the frequency band 8–20 Hz (the alpha and lower beta frequency bands), as this frequency range was found in pilot testing (and reported in previous literature [22, 23]) to contain the majority of the ERD dur-ing motor execution tasks. The Welch spectrogram was taken from a 1 s long segment of EEG beginning from the delivery
of the cue to move (or imagine movement) given to the partici-pant. Additionally, a measure of ERD strength in the baseline period of the trial was taken by estimating the median power within the 2 s prior to the start of the cued task period (the last 2 s of the fixation cross presentation time).
To avoid contamination of the ERD measurement by transi-tory large amplitude TMS artefacts in the EEG, samples with amplitudes greater than 100 uV were discarded. The TMS artefact in the EEG was observed to be in the range of several hundred to over 1000 uV, and very short (<10 ms including settling period) so this method is appropriate.
The ERD was then rescaled as a percentage of baseline activity via
ERD(%) =
(Baseline−ERD) Baseline
×100,
(1)
where ‘Baseline’ denotes the median activity in the pre-move-ment cued period (calculated the same way as the activity in the cued period, via Welch’s spectrogram) and ‘ERD’ denotes the median activity, calculated via Welch’s spectrogram, in the cued movement period of the trial.
During the 5 s cued movement period in the testing runs, the ERD(%) was recalculated every 100 ms within a sliding window approach with a window length of 2 s covering the most recent 2 s of recorded EEG.
2.6. Analysis
2.6.1. Artefact rejection. The EEG data was first visually inspected for artefacts. This was done by a researcher experi-enced in EEG inspection (author ID, 6 yr experience) who was blinded to the current trial conditions for the visual inspection process. Incidences of artefacts were manually labelled for each trial for every participant. Trials were then discounted from fur-ther analysis if any of the following conditions were met. (i) The cued period of the trial contained EMG artefacts on
one or more EEG channels.
(ii) The cued period of the trial contained movement artefacts on one of more EEG channels.
[image:6.595.53.289.61.372.2]Discounting these trials from subsequent analysis means that the results are based on trials for which there is no large artefact contamination. Therefore, delivery of TMS and visual feedback during these trials is based on ERD strength only and not on artefact contamination.
Figure 3. Electroencephalogram (EEG) recording montage.
Table 2. Bi-polar channel pairs considered as candidate locations for the largest ERD.
Channel pairs
F7–FC5 C3–CP3
F5–FC3 C1–CP1
F3–FC1 Cz–Pz
FC5–C5 CP5–P5
FC3–C3 CP3–P3
FC1–C1 CP1–P1
[image:6.595.347.511.86.192.2]2.6.2. Motor evoked potentials. Motor evoked potentials (MEPs) were measured in terms of their amplitude in the time period 0.01–0.1 s relative to delivery of the TMS (either real or sham). For trials in which no TMS was provided (the rest trials and trials in which the participant did not produce suf-ficient ERD to trigger either a real or sham TMS) the MEP amplitude and latency was extracted from a time period rela-tive to the median TMS time from all trials in which TMS was delivered for the same participant. The MEP amplitude was measured as the peak to peak difference in amplitudes within this 0.01–0.1 s window.
2.6.3. Statistical testing. An ANOVA was used to deter-mine the effects of the factors ‘TMS type’, ‘ERD level’, and ‘Feedback’. ‘TMS type’ has three levels: ‘Real TMS’, ‘Sham TMS’, and ‘Rest’ (no TMS delivered). ‘ERD level’ has six levels: ‘10% of ERD strength’, ‘20% of ERD strength’, ‘30% of ERD strength’, ‘40% of ERD strength’, ‘Fixed time TMS’, and ‘Rest’ (no TMS delivered). Finally, ‘Feedback’ has two levels: ‘Feedback’, and ‘No feedback’.
The ANOVA was applied to the participant population with an additional random factor ‘Participant number’. Subsequent exploratory analysis was conducted to explore the effects of different stimulation times and feedback on MEP amplitudes and latencies, and on ERD strengths.
3. Results
3.1. Artefact rejection
The artefact rejection process resulted in 8.48% of the trials being rejected due to artefact contamination. This left a total of 2041 trials in the dataset over all participants. Trials were removed approximately uniformly over all participants, with each participant having a median of 11 trials removed due to artefact contamination.
Additionally, the placement of the EMG electrodes dif-fered between participants due to day-to-day differences in placement of the leads. This means that the amplitude of the MEPs recorded from some participants was inverted when compared to others. In order to correct this, to allow for com-parative visual inspections of MEPs between participants, the mean MEPs recorded from each participant were plotted and then visually inspected. For participants with inverted grand average MEPs (MEPs in which the first deflection from zero was positive) the polarity of the MEPs were corrected by negating the amplitude of the recorded MEP signals.
3.2. Event-related (de)synchronisation
The strength of the baseline used to calculate the ERD strength during movement attempts was first evaluated. An ANOVA with factors ‘Participant’, ‘TMS type’, ‘ERD level’, and ‘Feedback’ was applied to identify any effects of exper-imental conditions on baseline strength. No significant effects were observed (p>0.05) suggesting that baseline EEG was
consistent across conditions.
The strength of the event-related desynchronization was explored. The root mean squared amplitude of the ERD was calculated over the 5 s trials and compared across condi-tions via the ANOVA with factors ‘Participant’, ‘TMS type’, ‘ERD level’, and ‘Feedback’. This confirmed a significant effect of the interaction terms ‘Participant’ × ‘TMS type’ (F(101 664)=4.07,p<0.001) and ‘Participant’ × ‘Feedback’
(F(101 664)=3.01,p=0.0009).
To correct for these effects of ‘participant’, z-scoring (sub-traction of the mean and division by the standard deviation) was used to correct for inter-participant differences. We then applied an ANOVA to the z-scored data with factors ‘Participant’, ‘TMS type’, ‘ERD strength’, and ‘Feedback’. This revealed a main effect of ‘TMS type’ (F(11 664)=16.25,p<0.001) and
‘ERD strength’ (F(41 664)=3.15,p=0.0137). This suggests
the need for separate analysis of the effects of TMS delivery at different ERD strengths for the two different TMS conditions ‘real’ and ‘sham’.
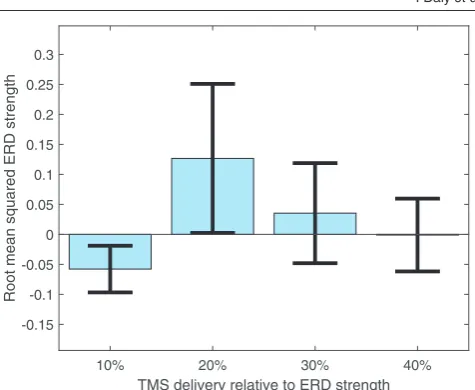
Therefore, the ANOVA was repeated twice, once for real TMS and once for sham TMS to investigate the effects of each of these types of stimulation, at different times relative to the ERD time course, and feedback, on the ERD. When sham TMS was used no significant effects of the timing of the stim-ulation (relative to the ERD strength), or feedback were found (p>0.05). However, when real TMS was used a significant effect of the timing of the stimulation on the ERD strength was noted F(4824)=3.56,p=0.0069.
To investigate this effect further the ERD strength is plotted as a function of the timing of the TMS in figure 4.
This suggests that, when TMS is delivered over the motor cortex during an ongoing ERD, the strength of the ERD is modulated depending on the timing of the TMS. Specifically, if TMS is delivered at 20% ERD strength this acts to increase the overall strength of the ERD (as measured by the root mean squared amplitude of the ERD).
TMS delivery relative to ERD strength
10% 20% 30% 40%
Root mean squared ERD strength
[image:7.595.311.549.52.247.2]-0.15 -0.1 -0.05 0 0.05 0.1 0.15 0.2 0.25 0.3
3.3. Corticospinal excitability
We then investigated the effect of the different factors (‘participant’, ‘TMS type’, ‘ERD strength’, and ‘ feed-back’) on corticospinal excitability (as measured by the MEP strength) via the ANOVA. The results revealed that there were significant effects of the factor ‘TMS type’ (F(11 571)=89.22,p<0.001) and stimulation time as a
percent age of ‘ERD strength’ (F(41 571)=5.786,p<0.001),
but no significant effect of ‘Feedback’ (F(11 571)=0.11,p=
=0.7491).
We then checked the effect of the TMS condition on the magnitude of the MEPs to confirm that the observed effects were a result of genuine stimulation and not an effect of other extraneous factors, such as, for example, the participants reacting to the noise of the TMS device. Welch’s ANOVA was used to compare MEP peak-to-peak amplitudes (measured from individual trials) between real and sham TMS conditions and a significant effect of the real TMS was observed (Welch ANOVA F=291.28, p<0.001).
For all trials for which real TMS was used, a three-level ANOVA with factors ‘participant’, ‘stimulation time’, and ‘feedback’ was then applied to identify which factors had the greatest impact on the observed MEP amplitudes. Significant effects were observed for the factors ‘ partici-pant’ (F(10 820)=7.78, p=0.0095) and ‘stimulation time’
(F(4820)=5.04, p=0.0017).
This indicates that, as with the ERD response, there were inter-participant differences in MEP responses to the real TMS. These were corrected for by z-scoring the peak-to-peak MEP amplitude and latency values measured from each MEP on a per-participant basis.
The relationship between ERD strength and corticospinal excitability (as measured by the MEP peak-to-peak ampl-itudes after z-scoring) was first investigated when no feedback was presented to the participants. Figure 5 illustrates the effect of stimulation time on the amplitude of the recorded MEPs
over all participants when real TMS was used and feedback was not presented.
It may be observed that the magnitude of the MEP varies as a non-linear function of the ERD strength and that the largest MEP occurred when stimulation was delivered at 30% ERD. This suggests that corticospinal excitability within the motor cortex changes as a function of the time course of the ERD and peaks relatively early in the ERD time course.
This is confirmed by applying a Welch’s ANOVA to evaluate the effect of stimulation time on MEP peak-to-peak amplitudes for trials in which real TMS was used and no feed-back was provided. A significant effect of stimulation time was observed F(4)=9.09, p<0.001.
When feedback was provided to the participants a relation-ship was also observed between stimulation time and MEP peak-to-peak amplitude. This is demonstrated via the use of Welch’s ANOVA F(4)=3.93, p=0.0043.
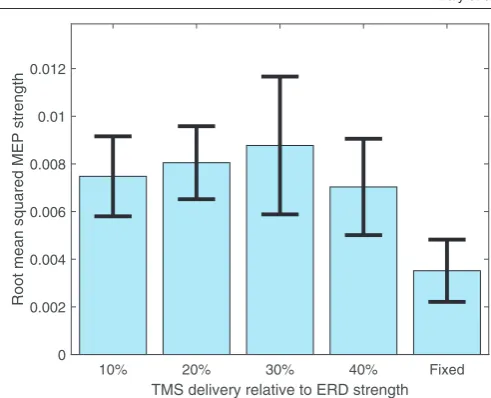
Additionally, when feedback was provided to participants there appeared to be a reduction in the overall amplitude of the MEP strength at each stimulation time (although this reduction in MEP amplitude was not observed to be signifi-cant when the three-factor ANOVA, with factors ‘TMS type’, ‘ERD strength’, and ‘feedback’ was applied). It also appears to cause the time, relative to the time-course of the ERD, at which the corticospinal excitability peaks to shift towards 20% of the ERD strength. This is illustrated in figure 6 and is consistent with the effect of ERD-dependent delivery of TMS (stimulation time) on the total ERD magnitude (as illustrated in figure 4).
Note that, when comparing figures 6 with 5, the MEP amplitudes are lower and the MEP amplitudes observed at 20% of ERD are larger when feedback was presented. Thus, feedback appears to cause a reduction in general corticospinal excitability (although this is not significant) and a possible slightly earlier peaking of corticospinal excitability relative to the timing of the ERD.
10% 20% 30% 40% Fixed
TMS delivery relative to ERD strength 0
0.002 0.004 0.006 0.008 0.01 0.012 0.014 0.016 0.018 0.02
[image:8.595.304.550.53.252.2]Root mean squared MEP strength
Figure 5. Root mean squared MEP magnitudes produced when real TMS was delivered, without feedback, at different percentages of ERD strength and at a fixed time interval (33 ms after cue presentation) within the trial. Error bars indicate the standard error over participants and trials.
TMS delivery relative to ERD strength
10% 20% 30% 40% Fixed
Root mean squared MEP strength
[image:8.595.52.299.59.247.2]0 0.002 0.004 0.006 0.008 0.01 0.012
It is also important to note that the use of feedback does not affect the peak-to-peak amplitudes of the MEPs when TMS was delivered at specific times during the trial, instead of when TMS was delivered as a function of ERD strength (p>0.05). Thus, feedback, by itself, does not appear to change the level of corticospinal excitability throughout the trial. Instead there is a possibility (indicated by the slight shift in the peak of the excitability) that it may act to change the corticospinal excit-ability as a function of the ERD time-course; however, this cannot be confirmed by the current results.
3.4. Participant effects
Similar effects were also observed when the relationship between corticospinal excitability and ERD strength and the effect of feedback was investigated on a per-participant basis. Specifically, the relationships between MEP amplitudes and stimulation times as a function of ERD strength, were inspected for each participant, with and without feedback, in figure 7.
It may be observed that, in general, there is a strong rela-tionship between ERD strength and MEP amplitudes, both with and without feedback provided to participants. This con-firms that the results observed over the group are common across the population and not a result of a single outlying participant.
4. Discussion
The ERD is known to reflect the localised activation of cor-tical neurons in the motor cortex during motor imagination and execution [10]. It is commonly used as a control signal in brain–computer interfaces and is fed back, visually, to stroke patients during BCI-based stroke rehabilitation [22].
Previous work has suggested a link between corticospinal excitability and ERD strength [16], but without the use of appro-priate control conditions, such as sham TMS, it has not been possible to be fully confident in the transferability of this finding. Additionally, it is not known what effect visual feedback of ERD strength, as used during BCI-based neuro-rehabilitation, has on corticospinal excitability. As promoting corticospinal excit-ability is thought to be an important comp onent of successful stroke recovery [14, 24] it is important to investigate the effects of both the time-course of the ERD and BCI-based visual feed-back of the ERD strength on corticospinal excitability.
We observed a relationship between ERD strength and cor-ticospinal excitability. Specifically, corcor-ticospinal excitability was modulated as a function of ERD strength and is at its greatest between 20%–30% of the ERD. This is not an artefact of the participants reacting to the acoustic stimulus associated with the TMS system (as verified via the use of a sham condi-tion) and occurred both with and without visual feedback pre-sented to the participants. This confirms our first hypothesis, that ERD strength relates to corticospinal excitability.
However, the presentation of visual feedback of our par-ticipant’s ERD strengths to our participants while they attempted movement was not observed to significantly affect
corticospinal excitability. Specifically, the mean RMS of the MEP strengths with and without feedback were 0.0041 and 0.0054 (p>0.1, t-test). Thus, we were not able to confirm our second hypothesis, that BCI-based visual feedback of ERD strength modulates corticospinal excitability.
This result appears at odds with previous reports that ERD-based BCIs (the majority of which use visual feedback [8]) are able to promote functional recovery after stroke. Specifically, motor re-learning is commonly thought to be contingent on promoting corticospinal excitability and, therefore, we would expect to observe a relationship between the presentation of visual feedback and corticospinal excitability. One possible explanation for this lack of observation is the fact that the visual feedback is, perhaps, not ecologically relevant to the learning task in this case. For example, in [25] visual feed-back takes the form of a simple picture of a hand opening and closing as the participant attempts the same action. This type of feedback, although not much more involved than the simple bar plot we use, is perhaps more directly intuitive to participants and could be more successful in inducing changes in corticospinal excitability.
A second possible explanation may relate to either sample size or effect size. It is possible that a larger number of par-ticipants may reveal further detail about relationships between feedback and cortical excitability. Additionally, in a number of previous studies evaluating BCI for stroke rehabilitation par-ticipants were provided with a BCI over numerous sessions over a series of different training days [12, 26]. Thus, it is pos-sible that a longer training paradigm with our participants may also have revealed a more subtle effect of visual feedback.
It should be noted that calculation of ERD strength from the previous 2 s of EEG means that, for the first 2 s of the trial an edge effect is observed where there is some overlap between the ERD window and the baseline window. This is consistent with prior work [16] and has a small effect on the estimated ERD strength for a very short time period, but is not thought to alter the results.
Previous work has shown that neuroplasticity (a key fea-ture of stroke rehabilitation) may be induced in a participant if sensory stimulation is delivered, according to Hebbian learning principles, with precise timing [27]. Specifically, if sensory stimulation is delivered at a time such that it arrives at the motor cortex at the same time as the peak motor related cortical potential this has been reported to induce greater neu-roplasticity [28]. However, if the timing of the sensory stimu-lation is such that the arrival of the afferent nerve stimustimu-lation volley at the motor cortex does not coincide with the peak motor-related cortical potential (MRCP) strength this has been reported to suppress neuroplasticity [27].
Overall, this suggests that in order to induce neuroplasti-city in participants sensory stimulation should be delivered at the time of maximum cortical excitability. Cortical excit-ability linearly relates to the ERD time course, which peaks shortly after the peak MRCP. However, further investigations are needed to explore the exact nature of the timings that are needed to optimize this process.
A relationship between the strength of motor impairment following stroke and the ERD has previously been reported [30]. When considered with our observations that ERD strength relates to corticospinal excitability this suggests that corticospinal excitability may be modulated by stroke-related motor strength inhibition.
However, our finding that the provision of our visual feed-back to participants does not act to modulate corticospinal excitability during motor control has potential implications for the field of brain–computer interfacing. Visual feedback of ERD strength is commonly used in BCI applications and is widely regarding as a motivating factor for participants to allow them to train their ERD in order to use it more effec-tively for controlling motor-control based BCIs. Our results suggest that the exact type of feedback used may be important when deploying BCI in a stroke rehabilitation context.
An important consideration to make regarding our study is that the feedback used within the BCI system was relatively simplistic. It is likely that more ecologically relevant feedback (such as visual displays of hands or robotic systems, as used in [26], or functional electrical stimulation, as used in [31]), could lead to clearer results.
Additionally, our measure of the ERD from our participants is not the only way to characterize ERD strength. We used a bi-polar channel montage to record EEG data, an approach that is common to a large amount of ERD-based BCI research and that is considered by many researchers to accurately cap-ture the dynamics of the ERD [25, 32]. However, it is possible that other approaches, such as spatial filtering [33], may out-perform our approach.
Furthermore, our ERD features were extracted from the frequency band 8–20 Hz, which is known to cover the majority of the ERD response range and is commonly used in ERD-based BCI studies [3]. However, the ERD is also known to involve activity in higher frequency bands from 20–30 Hz [3], and it is possible that a wider frequency band could more accurately capture the ERD.
In summary, our results, in part, replicate those reported in [16], in that corticospinal excitability was observed to exhibit a non-linear relationship with the strength of the event-related desynchronization. In addition, we also noted that the timing of the ERD closely relates to the time course of corticospinal excitability. Thus, if one wishes to enhance corticospinal excit-ability via the use of BCI or brain-state dependent brain stimu-lation it is important to ensure that the stimustimu-lation is delivered at the right moment (either at 20% or 30% of the ERD strength) within the ongoing motor imagination or execution related sensorimotor rhythm activity. These cognitive processes are reflected in the ERD and, therefore, brain-state dependent delivery of brain stimulation may be a promising route of research to explore in future stroke rehabilitation systems.
Acknowledgments
This work was supported by the Medical research Council (grant number MR/K014250/1).
ORCID iDs
Ian Daly https://orcid.org/0000-0001-5489-0393
Caroline Blanchard https://orcid.org/0000-0002-3055-1511
Nicholas P Holmes https://orcid.org/0000-0001-9268-4179
References
[1] Wolpaw J R, Birbaumer N, Heetderks W J, McFarland D J, Peckham P H, Schalk G, Donchin E, Quatrano L A, Robinson C J and Vaughan T M 2000 Brain-computer interface technology: a review of the first international meeting IEEE Trans. Rehabil. Eng.8 164–73
[2] Hwang H-J, Kim S, Choi S and Im C-H 2013 EEG-based brain-computer interfaces (BCIs): a thorough literature survey Int. J. Hum.-Comput. Interact.29 814–26
[3] Pfurtscheller G and Lopes da Silva F 1999 Event-related EEG/MEG synchronization and desynchronization: basic principles Clin. Neurophysiol.110 1842–57
[4] Jeannerod M 1995 Mental imagery in the motor cortex Neuropsychologia33 1143–419
[5] Wolpaw J R, Birbaumer N, McFarland D J, Pfurtscheller G and Vaughan T M 2002 Brain-computer interfaces for communication and control Clin. Neurophysiol.113 767–91
[6] Ramos-Murguialday A, Schürholz M, Caggiano V, Wildgruber M, Caria A, Hammer E M, Halder S and Birbaumer N 2012 Proprioceptive feedback and brain computer interface (BCI) based neuroprostheses PloS One 7 e47048
[7] Leeb R, Friedman D, Müller-Putz G R, Scherer R, Slater M and Pfurtscheller G 2007 Self-paced (asynchronous) BCI control of a wheelchair in virtual environments: a case study with a tetraplegic Comput. Intell. Neurosci.2007 8
[8] Ang K K and Guan C 2013 Brain-computer interface in stroke rehabilitation J. Comput. Sci. Eng.7139–46
[9] Daly J J and Wolpaw J R 2008 Brain-computer interfaces in neurological rehabilitation Lancet Neurol.7 1032–43
[10] Pfurtscheller G and Aranibar A 1977 Event-related cortical desynchronization detected by power measurements of scalp EEG Electroencephalogr. Clin. Neurophysiol. 42 817–26
[11] Müller-Putz G R, Zimmermann D, Graimann B, Nestinger K, Korisek G and Pfurtscheller G 2006 Event-related beta EEG-changes during passive and attempted foot movements in paraplegic patients Brain Res.1137 84–91
[12] Pichiorri F et al 2015 Brain-computer interface boosts motor imagery practice during stroke recovery Ann. Neurol. 77 851–65
[13] Pichiorri F, Morone G, Pisotta I, Secci M, Cincotti F, Paolucci S, Molinari M and Mattia D 2013 Randomized controlled trial to evaluate a BCI-supported task-specific training for hand motor recovery after stroke Converging Clin. Eng. Res. Neurorehabilitation Biosyst. Biorob.1 501–5
[14] Clarkson A N and Carmichael S T 2009 Cortical excitability and post-stroke recovery Biochem. Soc. Trans.37 1412–4
[16] Aono K, Miyashita S, Fujiwara Y, Kodama M, Hanayama K, Masakado Y and Ushiba J 2013 Relationship between event-related desynchronization and cortical excitability in healthy subjects and stroke patients Tokai J. Exp. Clin. Med. 38 123–8
[17] O’Malley M K, Ro T and Levin H S 2006 Assessing and inducing neuroplasticity with transcranial magnetic stimulation and robotics for motor function Arch. Phys. Med. Rehabil.87 S59–66
[18] Sergeeva E G, Henrich-Noack P, Bola M and Sabel B A 2014 Brain-state-dependent non-invasive brain stimulation and functional priming: a hypothesis Frontiers Hum. Neurosci. 8 899
[19] Rossi S, Hallett M, Rossini P M and Pascual-Leone A 2009 Safety, ethical considerations, and application guidelines for the use of transcranial magnetic stimulation in clinical practice and research Clin. Neurophysiol.120 2008–39
[20] Rossini P et al 2015 Non-invasive electrical and magnetic stimulation of the brain, spinal cord, roots and peripheral nerves: basic principles and procedures for routine clinical and research application. An updated report from an I.F.C.N. Committee Clin. Neurophysiol.126 1071–107
[21] Pfurtscheller G, Brunner C, Schlögl A and Lopes da Silva F H 2006 Mu rhythm (de)synchronization and EEG single-trial classification of different motor imagery tasks NeuroImage 31 153–9
[22] Pfurtscheller G and Neuper C 2001 Motor imagery and direct brain-computer communication Proc. IEEE89 1123–34
[23] Neuper C, Müller-Putz G R, Scherer R and Pfurtscheller G 2006 Motor imagery and EEG-based control of spelling devices and neuroprostheses Prog. Brain Res.159 393–409
[24] Dobkin B H 2004 Strategies for stroke rehabilitation Lancet Neurol.3 528–36
[25] Ono T et al 2014 Brain-computer interface with somatosensory feedback improves functional recovery from severe hemiplegia due to chronic stroke Frontiers Neuroeng.7 19
[26] Ang K K, Guan C, Chua K S G, Ang B T, Kuah C, Wang C, Phua K S, Chin Z Y and Zhang H 2010 Clinical study of neurorehabilitation in stroke using EEG-based motor imagery brain-computer interface with robotic feedback Conf. Proc. Annual Int. Conf. of the IEEE Engineering in Medicine and Biology Society. pp 5549–52
[27] Mrachacz-Kersting N et al 2016 Efficient neuroplasticity induction in chronic stroke patients by an associative brain-computer interface J. Neurophysiol.115 1410–21
[28] Stefan K, Kunesch E, Benecke R, Cohen L G and Classen J 2002 Mechanisms of enhancement of human motor cortex excitability induced by interventional paired associative stimulation J. Physiol.543 699–708
[29] Toro C, Deuschl G, Thatcher R, Sato S, Kufta C and Hallett M 1994 Event-related desynchronization and movement-related cortical potentials on the ECoG and EEG Electroencephalogr. Clin. Neurophysiol. Evoked Potentials93 380–9
[30] Kaiser V, Daly I, Pichiorri F, Mattia D, Müller-Putz G and Neuper C 2012 Relationship between electrical brain responses to motor imagery and motor impairment in stroke Stroke43 2735–40
[31] Meng F, Tong K-Y, Chan S-T, Wong W-W, Lui K-H, Tang K-W, Gao X and Gao S 2008 BCI-FES training system design and implementation for rehabilitation of stroke patients IEEE Int. Joint Conf. on Neural Networks (IEEE World Congress on Computational Intelligence) pp
4103–6
[32] Vuckovic A, Hasan M A, Osuagwu B, Fraser M, Allan D B, Conway B A and Nasseroleslami B 2015 The influence of central neuropathic pain in paraplegic patients on performance of a motor imagery based brain computer interface Clin. Neurophysiol.126 2170–80