This is a repository copy of Acclimation to low light by C4 maize: implications for bundle
sheath leakiness.
White Rose Research Online URL for this paper: http://eprints.whiterose.ac.uk/89241/
Version: Accepted Version
Article:
Bellasio, C. and Griffiths, H. (2013) Acclimation to low light by C4 maize: implications for bundle sheath leakiness. Plant, Cell and Environment, 37 (5). 1046 - 1058. ISSN
0140-7791
https://doi.org/10.1111/pce.12194
[email protected] https://eprints.whiterose.ac.uk/ Reuse
Unless indicated otherwise, fulltext items are protected by copyright with all rights reserved. The copyright exception in section 29 of the Copyright, Designs and Patents Act 1988 allows the making of a single copy solely for the purpose of non-commercial research or private study within the limits of fair dealing. The publisher or other rights-holder may allow further reproduction and re-use of this version - refer to the White Rose Research Online record for this item. Where records identify the publisher as the copyright holder, users can verify any specific terms of use on the publisher’s website.
Takedown
If you consider content in White Rose Research Online to be in breach of UK law, please notify us by
Plant cell and Environment
Acclimation to Low Light by C4 maize: Implications for
Bundle Sheath Leakiness
Chandra Bellasio and Howard Griffiths
Physiological Ecology Group, Department of Plant Sciences, University of Cambridge, Downing Street, Cambridge, CB2 3EA, UK;
Correspondence: C. Bellasio; E-Mail: [email protected]
Abstract
1
C4 plants have a biochemical carbon concentrating mechanism (CCM) that increases CO2 2
concentration around Rubisco in the bundle sheath (BS). Under limiting light, the activity of the 3
CCM generally decreases, causing an increase in leakiness, ( ), the ratio of CO2 retrodiffusing 4
from the BS relative to C4 carboxylation processes. Maize plants were grown under high and 5
low light regimes (respectively HL, 600 vs LL, 100 E m-2 s-1). Short term acclimation of was 6
compared from isotopic discrimination ( ), gas exchange and photochemistry. Direct 7
measurement of respiration in the light, and ATP production rate (JATP), allowed us use a novel 8
approach to derive , compared to the conventional fitting of measured and predicted . HL 9
grown plants responded to decreasing light intensities with the well-documented increase in . 10
Conversely, LL plants showed a constant which has not been observed previously. We explain 11
the pattern by two contrasting acclimation strategies: HL plants maintained a high CCM activity 12
at LL, resulting in high CO2 overcycling and increased ; LL plants acclimated by 13
downregulating the CCM, effectively optimising scarce ATP supply. This surprising plasticity 14
may limit the impact of -dependent carbon losses in leaves becoming shaded within developing 15
canopies. 16
Keywords
17
Carbon isotope discrimination; C4 photosynthesis; 13C; Zea mays L; efficiency; bundle 18
sheath conductance; gBS. 19
Introduction
20
The C4 metabolic syndrome evolved from C3 photosynthesis under declining ambient CO2 21
and increasing transpiration demand in semi-arid environments (Griffiths et al., 2013, Osborne & 22
Sack, 2012). In these environments, characterized by high irradiances (where energy supply is 23
(Pearcy & Ehleringer, 1984). For this reason many C4 plants are important agricultural crops and 25
weeds: maize, for example, has been the world’s leading grain production cereal (FAO, 2012). 26
Following concerns about climate change, the high productivity of C4 plants in warm climates 27
has drawn additional attention to C4 physiology, also with the goal of introducing ‘beneficial’ 28
C4 traits into C3 crops such as rice (Covshoff & Hibberd, 2012, Kajala et al., 2011, Sheehy, 29
2008). 30
The high productivity of C4 plants derives from an active suppression of the oxygenase 31
activity of Rubisco by means of a biochemical carbon concentrating mechanism (CCM) that 32
concentrates CO2 in the cellular compartment where Rubisco is exclusively expressed (bundle 33
sheath, BS). The CCM has a notable metabolic cost (a theoretical minimum of 2 moles of ATP 34
per mole of CO2 assimilated) (Furbank et al., 1990) and involves complex anatomical and 35
biochemical machinery that decrease efficiency when light is limiting. 36
Although up to 50 % of C4 crop canopy photosynthesis may be carried out by shaded leaves 37
(Baker & Long, 1988), light limitations play an important role in limiting canopy productivity, 38
and severe effects on net canopy photosynthetic uptake have been reported (Kromdijk et al., 39
2008). Most leaves progressively acclimate to shade, since they emerge at the top of the canopy 40
(as high light leaves) and become shaded by newly emerging leaves. This permanent long-term 41
acclimation is accompanied by a transitory short-term acclimation response (e.g. daily shading). 42
Understanding acclimation strategies, i.e. how C4 metabolism copes with light limitations, is 43
therefore relevant to crop production as well as providing insights for C4 energetic efficiency. 44
This paper investigates the influence of long-term acclimation on C4 inefficiencies under low 45
light intensities. Previous studies have associated the inefficiency of the CCM under low light to 46
an increase in leakiness ( ), i.e. the rate of CO2 retrodiffusion out of the BS relative to the rate of 47
PEP carboxylation (VP) [for review (Ubierna et al., 2011)]. is inevitable and an inherent 48
feature of a biochemical CCM because a CO2 concentration gradient is established by 49
overcycling CO2 between cellular compartments connected by plasmodesmata. is considered a 50
wasteful process since the refixation of that escaping CO2 results in an additional ATP cost of the 51
CCM [ times higher than the theoretical minimum of 2 ATP per CO2 (Furbank et al., 1990, 52
Tazoe et al., 2008)]. results in enriched 13CO2 retrodiffusing from BS, thus enabling to be 53
estimated by studying real-time carbon isotope discrimination during photosynthesis, as OBS 54
(Evans et al., 1986). 55
is one of the discrimination processes operating in C4 photosynthesis that were resolved 56
into weighted individual fractionations by the model originally derived by G.D. Farquhar (1983). 57
In the model, diffusion in air, dissolution in water, PEP carboxylation, mitochondrial 58
decarboxylation, Rubisco carboxylation and diffusion through plasmodesmata are assigned 59
individual fractionation values. The magnitude of the component fractionation effects are 60
weighted by the gradient in CO2 concentrations between the different cellular compartments. The 61
concentration in the cuvette, can be measured directly with the gas exchange analyser. Ci, the 63
CO2 concentration in the substomatal cavity, and CM, the CO2 concentration in mesophyll cells, 64
are calculated using the equations for steady-state photosynthesis (Farquhar et al., 1980, von 65
Caemmerer & Farquhar, 1981). CBS, the CO2 concentration in BS, cannot be measured directly 66
and is either assumed or estimated. When a large CBS is assumed [e.g. (Kromdijk et al., 2008, 67
Pengelly et al., 2010, Tazoe et al., 2008)] an evident bias is introduced for high leakiness values 68
(Ubierna et al., 2011). When CBS is estimated through a model for C4 photosynthesis (von 69
Caemmerer, 2000), a parameterization with assimilation (A), total ATP production rate (JATP), 70
respiration in the light (RLIGHT) and bundle sheath conductance (gBS) is needed. 71
Measurement of A, JATP and RLIGHT present some technical issues. Assimilation can be 72
measured directly: good practices allowing measurements with suitable accuracy are well 73
codified from studies on C3 plants (Flexas et al., 2007, Long & Bernacchi, 2003, Pons et al., 74
2009). JATP, RLIGHT and gBS are more difficult to distinguish experimentally and the approach 75
followed by the latest studies leaves room for improvement: i) JATP has been traditionally 76
resolved from a theoretical relationship between quantum yield of photosystem II and ATP 77
production rate. This estimate relies on parameters that are difficult to measure, some of which 78
are still unknown (von Caemmerer, 2000). ii) RLIGHT has often been assumed equal to respiration 79
in the dark, which is relatively simple to measure [e.g. (Ubierna et al., 2013)]. Growing 80
awareness of the mechanisms of regulation of respiration in the light (Tcherkez et al., 2008) 81
reveal the limits of the traditional assumption. iii) gBS has been traditionally resolved by 82
calculating a ‘modelled’ isotopic discrimination during photosynthesis, MOD, and fitting MOD to 83
the observed discrimination during photosynthesis OBS (later referred to as / approach) [for 84
review (Ubierna et al., 2011)]. This approach introduces a certain degree of circularity, since CBS 85
and are both estimated from OBS. 86
In order to develop these technical issues we introduced three major experimental advances: i) 87
RLIGHT was measured through the combined use of fluorescence and gas exchange (Yin et al., 88
2011a); ii) the total ATP production rate, JATP, was measured at low O2 and the value was 89
corrected by the small ATP demand for photorespiration (Yin & Struik, 2009, Yin et al., 2011b); 90
iii) using the precise estimate of JATP, gBS could be estimated by curve fitting based on JATP (J / J 91
approach). Since gBS and were derived from independent datasets, the J / J approach did not 92
suffer the circularity of the / approach; finally, plants were grown under two contrasting 93
light regimes with the lowest (100 E m-2
s-1) well below that used in comparable studies 94
(Kromdijk et al., 2010, Pengelly et al., 2010, Tazoe et al., 2008). 95
Results showed that long-term acclimation influenced the way maize plants responded to 96
decreasing light intensities. When plants grown in high light (HL, 600 E m-2 s-1) were exposed 97
to decreasing light intensities, they responded with an increase in . Conversely and in contrast 98
to the pattern reported in previous studies, plants grown in low light (LL) did not show any 99
processes. HL and LL plants deployed a contrasting strategy at limiting light intensities: while 101
HL plants maintained a high CCM activity, resulting in high CO2 overcycling, LL plants 102
decreased the CCM activity and coped with the resulting decrease of CO2 flow to BS by 103
adjusting carboxylase activity or bundle sheath conductance, effectively optimising scarce ATP 104
supply. 105
Materials and Methods
106
Plants 107
Maize plants were grown at the Plant Growth Facility located at the University of Cambridge 108
Botanic Garden in controlled environment growth rooms (Conviron Ltd, Winnipeg, Canada) set 109
at 16 h day length, temperature of 25 °C / 23 °C (day / night) and 40 % relative humidity. 110
The growth protocol was designed to standardize age and watering conditions throughout the 111
experiment. Every Monday, seeds of Zea mays L. (F1 Hybrid PR31N27, Pioneer Hi-bred, 112
Cremona, Italy) were sown in 1.5 L pots filled with Levington pro M3 pot & bedding compost 113
(Scotts Miracle-Gro, Godalming, UK) and positioned in HL (PAR = 600 E m-2 s-1) or in LL 114
(PAR = 100 E m-2 s-1). LL intensity was obtained through shading to mimic the understory of a 115
canopy. Plants were manually watered daily with particular care to avoid overwatering. At the 116
fully expanded 4th leaf stage (3 weeks, HL; 4 weeks, LL) plants were measured once and then 117
discarded. 118
Gas exchange measurements with concurrent PSI / PSII Yield and carbon isotopic 119
discrimination 120
The experimental setup for measuring JATP and concurrently on the same sample consisted 121
of an infra-red gas analyzer (IRGA), a Dual PAM and a trapping line. The IRGA, a LI6400XT 122
(Li-Cor, Lincoln Nebraska, USA), was fitted with a 6400-06 PAM2000 adapter, holding a fiber 123
probe in the upper leaf cuvette distant enough to avoid shading. Light was provided by a Li-Cor 124
6400-18 RGB light source, positioned to uniformly illuminate the leaf. Measurements with low 125
gas flow, indispensable to measure discrimination at low light intensities, required careful 126
optimization to minimize leaks. Neoprene gaskets were used on both sides of the cuvette and a 127
tiny ridge of vacuum grease was laid on gaskets so as to seal the leaf upon closure. A 2 % O2 / 128
N2 (pre-mixed, BOC, UK) or ambient air was CO2-scrubbed with soda lime and humidified to a 129
dew point of 19 °C upstream of the inlet. Natural abundance CO2 ( = -9.46 ‰) used to reduce 130
artefacts (Gandin & Cousins, 2012, Ubierna et al., 2011) was added from a cylinder (Isi, Wien, 131
A), with use of the CO2 injection unit of the IRGA. 132
To determine the most suitable ‘high CO2’ concentration (used to measure JATP, see below) a 133
because i) further increases in CO2 concentration did not result in higher A; ii) stomatal closure 135
was not strongly induced; iii) it was sufficiently similar to lab CO2concentration (550 mol mol -136
1
) to minimize the problem of CO2 diffusion out of the cuvette (Flexas et al., 2007). Gas flow 137
was set at 150 mol s-1 (PAR = 500 and 250 E m-2 s-1), 100 mol s-1 (PAR = 125 E m-2 s-1), 75 138
E s-1
(PAR = 75 E m-2 s-1) and 50 mol s-1 (PAR ≤ 50 E m-2 s-1). Block temperature was 139
controlled at 26 °C. Stomatal ratio was set to 0.7 (Driscoll et al., 2006). Water pressure deficit 140
was carefully kept below 1 KPa to foster stomatal opening. PSI and PSII yield were measured in 141
reflectance mode with a Dual Pam-F (Heinz Walz GmbH, Effeltrich, D). Pulse intensity was set 142
to 20 mE m-2 s-1, enough to saturate F and P signals (which occurred between 8 and 10 mE m-2 s -143
1
, data not shown). To measure OBS, the IRGA was connected to a cryogenic H2O and CO2 144
trapping-purification line (Griffiths et al., 1990), that concentrated the CO2 in the low IRGA 145
flow rates. The trapping line consisted of a glass coil in which CO2 and water were frozen under 146
liquid N2. 40-50 mol s-1 of gas, taken either from the leaf cuvette or from the reference gas tube, 147
were trapped for 15 min. A minimum surplus was vented to ensure overpressure in the piping. 148
To match IRGAs the sample flow was periodical redirected towards the IRGA reference channel. 149
After trapping, CO2 was purified by differential sublimation in a sealed vial for mass 150
spectrometry. 151
Measurements were performed with a rigid acclimation routine. Before measurements plants 152
were dark-adapted and watered to pot capacity. The distal part of the youngest fully expanded 153
leaf was clamped in the leaf cuvette in the dark. Maximum yield of PSII (Fv / Fm) and Pm, signal 154
were registered (details of PSI measurements are reported in supporting Figure S 2). An initial 155
light response curve (500, 250, 125, 75, 50 and 30) E m-2 s-1 was registered at 2 % O2 and Ca = 156
600 mol / mol. Leaves were acclimated for > 30 min at the beginning and > 15 min between 157
each change in PAR level. At steady state, a saturating pulse was applied and assimilation was 158
recorded every 30 s for 5 min. A second light response curve was registered at 21 % O2 and 159
reference CO2 set at 400 mol / mol, during which exhaust gas was trapped to determine OBS. A 160
rigorous routine, consisting of 20 min acclimation, 15 min trapping, 7 min acclimation and 15 161
min trapping was followed for each PAR level. Assimilation was recorded every 30 s throughout 162
trapping, while pulses were applied twice to minimise photobleaching. 163
This routine yielded a total of 12 CO2 samples collected during trapping and 6 reference gas 164
collected during acclimation for each of 4 LL plants and 3 HL plants. CO2 was analysed directly 165
with a VG SIRA dual inlet isotope ratio mass spectrometer (modified and maintained by Pro-Vac 166
Services Ltd, Crewe, UK). Values were corrected for presence of N2O and 17O. OBS was 167
calculated according to Evans et al. (1986) and reflects an average for 15 minutes continuous 168
photosynthetic discrimination (equations are reported in supporting Text 2). 169
Respiration in the light was estimated independently at 2 % O2 and at 21 % O2 with the 171
chlorophyll fluorescence method proposed by Yin and colleagues (Yin & Struik, 2009, Yin et 172
al., 2011a). Briefly, A was plotted against PAR·Y(II) / 3 (where Y(II) is PSII yield, Eqn 12, Supp. 173
information, the coefficient 3 was maintained to ease comparison with previous work); the y-174
intercept of the linear regression gives an estimation of –RLIGHT (Supporting Fig. 1). 175
Total ATP production rate JATP 176
JATP was derived from gas exchanges at low O2 concentration and corrected under ambient O2. 177
We adopted a gas exchange / fluorescence approach as it did not rely on assumptions or 178
uncertain parameterization. This method was used in previous studies (Yin & Struik, 2009, Yin 179
et al., 2011b) where a linear relationship between JATP and electron transport rate, ETR (Krall & 180
Edwards, 1990, Oberhuber et al., 1993) was assumed. We observed a slight deviation of JATP / 181
ETR from linearity at irradiance 500 E m-2 s-1, consistent with previous data (D'Ambrosio et al., 182
2003). Instead of linearizing the relationship, we scaled JATP to ETR individually at each 183
irradiance (the calculation is identical to the original method when the relationship is linear). 184
JATP Low O2 was calculated from gross assimilation (GA) measured under low O2. Under low 185
O2, and photorespiration are minimal (Kromdijk et al., 2010) and the ATP requirement of GA 186
(3 / 0.59) is similar to the theoretical minimum (Yin & Struik, 2009, Yin et al., 2011b). 187
188
(1)
189
JATP (at ambient O2) was calculated from JATP Low O2 by correcting for photorespiration using 190
ETR as a scaling factor. 191
192
(2)
193
Eqn 2 was calculated at each light intensity, the results are the symbols shown in figure 3 A. 194
Note that, of the components of ETR, only Y(II) shows in Eqn 2 as PAR and compound 195
conversion efficiency (s’) simplify. For the derivation of Eqn 2 see supporting Text 1. In C4 196
plants photorespiration is low, therefore the difference between JATP LOW O2 and JATP was minimal 197
(c. 1 %). Photochemical yield appears both at the numerator and at the denominator of Eqn 2, 198
therefore this robust approach is independent of systematic errors that affect both Y(II) and 199
This procedure to derive JATP was particularly suitable to parameterize and fit the C4 model. 201
Since JATP was measured concurrently to gas exchange and isotopic discrimination, it represented 202
the actual JATP of the portion of the leaf that was subject to isotopic discrimination 203
measurements. Furthermore, JATP was derived under the same assumptions of the C4 model (Eqn 204
4 to 10, see below). Under these assumptions JATP represented the fraction of ATP available for 205
photosynthesis and it was not influenced by the ATP allocation to alternative sinks. 206
Estimated leakiness from isotopic discrimination 207
Leakiness was resolved from carbon isotope discrimination (Farquhar, 1983, Farquhar & 208
Cernusak, 2012, Ubierna et al., 2013): 209
210
(3)
211
Where the subscript ‘id’ reminds that was obtained from isotopic discrimination, Ca, Ci, 212
CBS, CM are the CO2 concentrations in the different compartments; a is the fractionation during 213
CO2 diffusion in air; s is the fractionation during CO2 leakage; b3 is the fractionation of Rubisco 214
CO2 fixation, corrected for respiration and photorespiration; b4 is the combined fractionation of 215
CO2 HCO3- conversion and PEPC fixation, corrected for mitochondrial respiration in the 216
mesophyll; t represents the ternary effects; other quantities were previously defined (Table 1). 217
Ca is measured directly by the IRGA, whilst the estimations of Ci, CM and CBS require 218
modelling. 219
Modelled C4 photosynthesis 220
The C4 model described below estimated the CO2 concentrations in the different 221
compartments (Ci, CM and CBS) that are required to parameterize Eqn 3. Ci was estimated through 222
the equations for steady state photosynthesis (Farquhar et al., 1980, von Caemmerer & Farquhar, 223
1981), directly by the IRGA software. CM was calculated from the supply function of M as (von 224
Caemmerer, 2000): 225
226
(4)
227
Where gM is the mesophyll conductance to CO2. 228
230
(5)
231
Where gBS is BS conductance to CO2 and L, the leakage rate was calculated from M mass 232
balance: 233
234
(6)
235
Where RM, M respiration rate in the light was assumed half the RLIGHT. VP, the PEP 236
carboxylation rate is limited by PEP regeneration and ATP supply. It was calculated by 237
partitioning JATP between C4 activity (VP) and C3 activity (reductive pentose phosphate pathway 238
+ photorespiratory cycle) by means of a partitioning factor (x, Table 1): 239
240
(7)
241
Eqn 5, 6 and 7 can be combined to give: 242
243
(8)
244
Eqn 8 describes the dependency of CBS on the measured quantities A, RLIGHT and JATP, as a 245
function of gBS. gBS cannot be estimated directly or be derived from previous studies (it varies 246
between individuals), so it was estimated by curve fitting. To do so, the C4 model was 247
rearranged to express a measured quantity. 248
In a first approach (referred to as J / J method) the model was rearranged to express a 249
modelled ATP production rate JMOD (Ubierna et al., 2013): 250
251
(9)
Where ; ; 253
; is the fraction of 254
PSII activity in BS cells; * is a parameter related to Rubisco O2 / CO2 specificity; OM is the O2 255
concentration in M; other variables were previously defined (Table 1). 256
JMOD was iteratively calculated at varying gBS until the JMOD matched JATP. The gBS value that 257
yielded the best fit was assumed as gBS of that individual plant. This operation can be visualized 258
in Figure 3 A: the solid lines represent Eqn 9 calculated for HL (thick solid line) and LL (thin 259
solid line), with gBS varied until the modelled values (solid lines in Figure 3A) matched JATP 260
(symbols in Figure 3 A). Notably, with the J / J approach gBS was obtained independently of OBS 261
(see discussion). 262
A different approach (referred to as / method) involved rearranging the C4 model to 263
express a modelled isotopic discrimination (Kromdijk et al., 2010): 264
265
(10)
266
Where (a, ad, b3, b4, es, s) are the individual contribution to discrimination and other variables 267
were previously defined (Table 1). 268
MOD was iteratively calculated at different gBS, and the value of gBS that fitted MOD to OBS 269
was assumed as gBS for that individual. This operation can be visualized in Figure 3 B. The 270
dotted lines represent Eqn 10 calculated for HL (thick dotted lines) and LL (thin dotted lines), 271
with gBS varied until MOD (dotted lines in Figure 3 B) matched OBS (symbols in Figure 3 B). 272
The values obtained for CBS and gBS, with the two fitting approaches described, were used to 273
derive id from isotopic discrimination data OBS as described above. 274
Modelled leakiness was calculated to compare results of different modelling approaches: 275
276
(11)
277
Results
278
Maize plants were grown under two different light regimes and their photosynthetic response 279
was studied under decreasing light intensities. Carbon isotope discrimination, PSI / PSII 280
and bundle sheath conductance (gBS) were estimated by implementing a C4 photosynthesis 282
model. The C4 model was constrained with two different datasets: the ATP production rate JATP 283
(J / J approach) and the real-time isotope discrimination data OBS ( / approach). In this way 284
two different sets of values for CBS and gBS were estimated and were used, in turn, to resolve 285
leakiness ( id) from OBS by Eqn 3. 286
Physiological response to decreasing light intensities 287
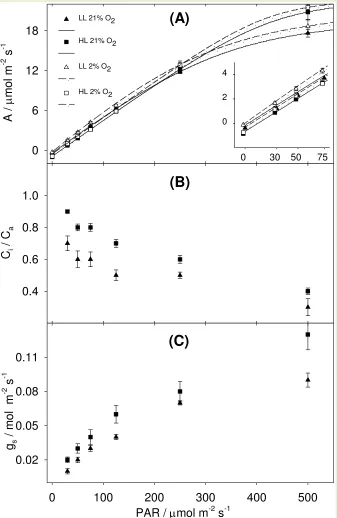
Assimilation (A) differentiated LL plant and HL plant responses (Figure 1 A). LL plants had 288
lower A at high PAR, but relatively higher A at lower PAR. Consistently, the compensation point 289
( ) and respiration in the light (RLIGHT) of LL plants were lower (Table 2). When low O2 was 290
supplied, A of LL plants increased on average by 0.3 mol m-2 s-1, while A of HL plants 291
increased by an average of 0.2 mol m-2 s-1. 292
Figure 1 B shows that Ci / Ca was higher than 0.6 at PAR < 125 E m-2 s-1 (LL plants) or PAR 293
< 500 E m-2
s-1 (HL plants). This was a remarkable result considering maize typical stomatal 294
responses e.g. (Ubierna et al., 2013) and reflected efforts made during the measurements to 295
induce stomatal opening (see methods for details). A high Ci / Ca was important to maximise the 296
contribution of biochemical processes to total isotopic discrimination, and it was a prerequisite 297
for resolution of the isotopic discrimination model. Compared to HL plants, LL plants showed 298
slightly reduced Ci / Ca, as a consequence of lower stomatal conductance (Figure 1 C). 299
The photochemical yield of PSII Y(II) decreased linearly at increasing PAR in both HL plants 300
(Figure 2 A) and LL plants (Figure 2 B). Consistently, the quantum yield for CO2 assimilation 301
decreased, and a linear relationship between quantum yield of CO2 assimilation and Y(II) was 302
observed in all samples (Supplementary Figure S 3). In LL plants, Y(II) was unaffected by O2 303
concentration whereas HL plants displayed a tendency to have lower Y(II) under low O2 (Figure 304
2 A). The photochemical yield of PSI Y(I) decreased at decreasing PAR (Supplementary Figure 305
S 2). To the best of our knowledge this is the first study where maize Y(I) is measured together a 306
complex physiological characterization. 307
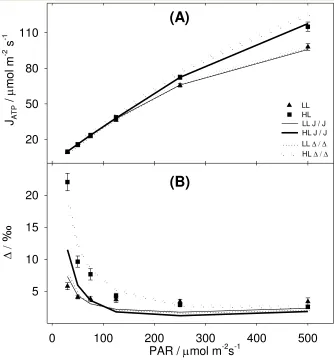
The total ATP production rate (JATP) is shown by symbols in Figure 3A. JATP was derived 308
from gross assimilation under low O2 (Eqn 1) and then corrected for photorespiration at ambient 309
O2 using the ratio of photochemical yield (Eqn 2). At high PAR, JATP of LL plants was lower 310
than JATP of HL plants because of the lower ATP demand for lower A (Figure 1). At low PAR, 311
JATP of LL plants matched JATP of HL plants, suggesting that the higher A of LL plants at limiting 312
PAR (inset in Figure 1) was achieved through a higher conversion efficiency and lower 313
respiration rate (Table 2). 314
Isotopic discrimination during photosynthesis ( OBS) is shown by symbols in Figure 3 B. In 315
OBS increased from 2.6 ‰ at 500 E m-2 s-1 to 22.1 ‰ at 30 E m-2 s-1. These responses were 317
confirmed by measurements on an independent batch of plants (Supplementary Figure S 4). 318
Modelled C4 photosynthesis: model fitting and estimation of gBS and CBS 319
An estimate of BS conductance to CO2, gBS, was obtained for each individual plant. Table 3 320
shows that gBS was lower when obtained through the J / J approach. Table 3 also shows that LL 321
plants had lower gBS than HL plants. These gBS values were used in Eqn 8, the supply function of 322
BS, to calculate CBS. CBS differentiated between fitting approaches. With the J / J approach, CBS 323
of HL and LL plants were similar, decreasing from (2400 to 1000) mol / mol at decreasing 324
PAR. With the / approach, CBS was substantially lower than calculated using the J / J 325
approach and differed between the two growth regimes. In LL plants CBS ranged from (1700 to 326
700) mol / mol, while in HL plants CBS ranged from (970 to 570) mol / mol. 327
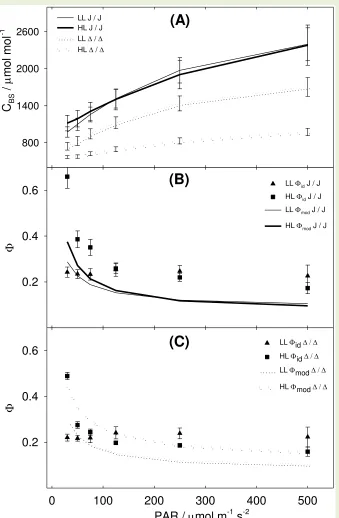
Response of id to light intensity 328
Symbols in Figure 4 B and C show that in LL plants leakiness, id, derived from real-time 329
carbon isotope discrimination data, OBS, was constant at decreasing PAR, while in HL plants id 330
increased hyperbolically at decreasing PAR. To derive id from OBS, Eqn 3 was parameterized 331
with the output of the C4 model, fitted with the J / J approach or / approach (compare 332
symbols in Figure 4 B and C). With the J / J approach (symbols in Figure 4 B), LL plants id 333
(triangles) was close to 0.24 and HL plants id (squares) ranged from 0.17 to 0.67. With the / 334
approach (Figure 4 C, symbols) LL plants id was close to 0.22 (triangles), and HL plants id 335
(squares) ranged from 0.16 to 0.49. 336
Modelled leakiness MOD 337
Figure 4 B shows that with the J / J approach, MOD underestimated id both in LL and HL 338
plants. With the / approach (Figure 4 C dotted lines) MOD and id were not independent 339
estimates of (see discussion). 340
Interestingly, with both approaches MOD did not describe the constant id observed in LL 341
plants. In fact, fitting varied MOD magnitude, but did not change the shape of the function, with 342
MOD hyperbolically increasing at decreasing PAR (compare lines in Figure 4 B and C). As a 343
consequence, the linear id trend observed was not predicted by the conventional fitting but 344
required a more complex procedure. 345
Model refitting 346
Figure 5 A shows the values of x (the ATP partitioning between PEPC activity and C3 347
the two different treatments: in LL plants there was a tendency of fitted x to decrease at 349
decreasing light intensities while in HL plants there was no clear trend. Figure 5 B shows the gBS 350
values that refitted MOD to id. gBS differentiated between LL and HL plants: in LL plants there 351
was a clear decrease of refitted gBS at decreasing light intensities (Figure 5 B) while in HL plants 352
refitted gBS did not show a pattern. 353
Discussion
354
Technical optimization: RLIGH, JATP and J / J fitting approach 355
By measuring JATP directly, we parameterized the isotopic discrimination model with a 356
suitable novel approach, independent of OBS. Plants were subject to gas exchange and 357
photochemical investigations at low O2 and to gas exchange, isotopic discrimination and 358
photochemical investigation at ambient O2. This complex setup allowed estimation of RLIGHT and 359
derivation of JATP for the portion of the leaf clamped in the cuvette at the very moment that gas 360
exchange and isotopic discrimination were being measured. The availability of precise 361
independently estimated values for JATP, offered a valid dataset for fitting the C4 model. This ‘J / 362
J approach’ was used together with isotope discrimination data for the first time in the present 363
work. In fact in studies where JATP was modelled, and therefore not independently obtained, the J 364
/ J fitting was not possible e.g. (Ubierna et al., 2013)]. Nor was it possible when JATP was 365
calculated using parameters derived from leaves differing from those subject to gas exchange, 366
because, in this case, JATP did not strictly represent the portion of the leaf subject to isotopic 367
discrimination and gas exchange investigations e.g. (Kromdijk et al., 2010). 368
The J / J approach suited the C4 model parameterization. Firstly, JATP was derived from gas 369
exchange measurements under the same assumptions of the C4 model. Under these assumptions 370
JATP represented the fraction of ATP available for photosynthesis and was not influenced by the 371
ATP allocation to alternative sinks. Secondly, the J / J approach did not suffer the circularity of 372
the / approach, where CBS and gBS are not independent, being both derived from OBS 373
(Kromdijk et al., 2010, Ubierna et al., 2013). Thirdly, with the J / J approach, the estimate of CBS 374
and gBS, relied uniquely on gas exchange and fluorescence data, without requiring isotopic 375
discrimination data. This had major benefits: i) since there was no amplification of error 376
dependent on (supporting Text 2 and Supporting Table 1), JATP could be measured at any light 377
intensity, even below the compensation point; ii) the equipment was relatively cheap and easy to 378
maintain; iii) data had low noise / signal ratio. 379
J / J compared to / 380
To show these differences and the similarities between the two approaches, model parameters 381
(Table 1). The different approaches yielded different gBS and CBS values, but this resulted in 383
different id only in HL plants. Bundle sheath conductance (gBS) derived with the J / J approach 384
was one third of the value of gBS derived with the / approach. The overall range (8.2·10-4 to 385
46·10-4) mol m-2 s-1 was within the range previously reported: 15·10-4 mol m-2 s-1 (Ubierna et al., 386
2013); (8·10-4 to 103·10-4) mol m-2 s-1 (Yin et al., 2011b); (3.7·10-4 to 23.5·10-4) mol m-2 s-1 387
(Kromdijk et al., 2010). The corresponding CBS values estimated with the J / J approach were on 388
average 70 % higher than those estimated with the / approach. The range we reported (500 389
to 2500) mol mol-1
, was consistent with values reported for maize [for review (von Caemmerer 390
& Furbank, 2003)]. In spite of these CBS differences, in LL plants the two approaches yielded 391
identical id, indicating that id is fairly insensitive to variations of CBS when OBS is low. 392
Conversely, in HL plants the two approaches yielded different id, because of the big difference 393
in CBS and the higher values of OBS. 394
Modelled leakiness, MOD, is one of the outputs of the C4 model and carries different 395
information, depending on the C4 model parameterization. With the J / J approach (Figure 4 B 396
solid lines), MOD was calculated with gas exchange and photochemical data only, therefore 397
MOD (Figure 4 B lines, Eqn 7) and id (Figure 4 B symbols, Eqn 3) represented two 398
independent estimates of . The discrepancy between MOD and id is dependent on the 399
different assumptions made in the calculations. One could decrease this discrepancy by 400
progressively increasing gBS until the distance between MOD and id is minimized. Now, MOD 401
and id are not independent estimates of because fitted on one another. This situation 402
corresponds to the / fitting (fitting over corresponds to fitting MOD over id as the same 403
model is used to interconvert and ). Note that the better fit between MOD and id not only is 404
reached at expense of arising circularity, but also it distances JMOD from JATP. When the distance 405
between MOD and id is lowest (Figure 4 C), the distance between JMOD and JATP is highest 406
(Figure 3 A dotted lines). When the distance between MOD and id is highest (Figure 4 B), the 407
distance between JMOD and JATP is lowest (Figure 3 A solid lines). 408
Leakiness responses at decreasing PAR 409
While the id response for HL plants was expected, LL plants displayed a particular response 410
that could not be simulated under conventional constraining of the C4 model. In HL plants, 411
grown under PAR = 600 E m-2 s-1, id ranged from 0.17 to 0.66, in agreement with previous 412
findings, and showed the conventional hyperbolic increase at decreasing PAR (Kromdijk et al., 413
2010, Ubierna et al., 2011, Ubierna et al., 2013, von Caemmerer & Furbank, 2003). However, in 414
LL plants, grown under 100 E m-2 s-1, id was constant under decreasing PAR, a response that 415
has not been shown before. In comparable studies, maize HL grown plants [500 E m-2 s-1 416
(Ubierna et al., 2013)] or maize plants grown under intermediate irradiance [250 E m-2 s-1 417
other C4 species (Pengelly et al., 2010, Tazoe et al., 2008). In our experiment the gas exchange 419
measurement routine may have contributed to showing the traits acquired during growth. The 420
experiment included a strict 20 min short-term-acclimation after each change in PAR. During 421
this time, LL plant metabolisms tuned and reach a status of low id. 422
Interestingly, the id trend observed in LL plants could not be simulated by the C4 model 423
with the first fitting procedure, as the model described a hyperbolic increase of MOD at 424
decreasing PAR, similar to the id response observed in HL plants. The hyperbolic increase is 425
due to the effect constant x (the ATP partitioning between PEPC activity and C3 activity) and 426
RLIGHT. In the C4 model, two contributions to CO2 flux to BS are considered: i) the contribution 427
of malate decarboxylation (equals PEPC activity at steady state); ii) the CO2 respired in BS. 428
When PAR decreases, while PEPC and Rubisco activities proportionally decrease, the BS 429
respiration stays constant. In these conditions, BS-respired CO2 is not fixed by the reduced 430
Rubisco activity and is free to diffuse out of BS. As BS respiration progressively outweighs VP, 431
the ratio of retrodiffusing CO2 over PEP carboxylation rate ( = L / VP) becomes progressively 432
higher, hence the characteristic hyperbolic increase at limiting PAR. For these reasons the flat 433
id response at decreasing PAR cannot be explained under the conventional model constraints: 434
to explain the response we explored two scenarios involving unusual regulation of metabolism. 435
Acclimation scenarios 436
By refitting the C4 model, we associated the flat id pattern observed in LL plants with 437
variable physiological traits. BS conductance to CO2 (gBS) and the C4 / C3 ATP partitioning 438
factor (x) were chosen as their values were not derived from direct measurements and could be 439
varied without changing the model assumptions or overriding data. Refitting differed from the 440
fitting described above. Fitting assigned a value of gBS to each individual plant, constant at all 441
light intensities, and a value of x, constant for all plants in all conditions. In refitting, either x or 442
gBS were varied between light intensities, while all other parameters were maintained as 443
constants from the previous step. Refitting resulted in a tight match between MOD and id and, 444
according to the parameter varied, described two alternative scenarios. 445
A first scenario explaining the flat id pattern observed in LL plants involved variable 446
partitioning between C4 and C3 activity (x) as a function of light intensity. Under LL intensities 447
x was downregulated (Fig 5 A). This meant that the fraction of ATP consumed by PEPC over the 448
total ATP consumed by assimilation became progressively lower. In other words, when PAR 449
decreased, PEPC was downregulated more than the C3 activity and there was a shift from a 450
PEPC-driven CCM to a respiration-driven CCM, effectively cutting the ATP cost of the CCM 451
when light was limiting. This particular type of respiration-driven CCM resembles forms of 452
CCM at the early stage of evolution of C4 photosynthesis (also known as C2 photosynthesis), 453
(Griffiths et al., 2013). As a consequence of the decreased CO2 flux to BS, CBS would decrease. 455
To maintain a physiological assimilation rate (Fig 1 A) an increased activity of Rubisco would 456
have to compensate for the lower CBS. We could not quantify the differential Rubisco activity 457
with the equations used here, because of the way the model is designed: Rubisco is assumed 458
fully activated, saturated by RuBP and uniquely limited by JATP. The influence of differential 459
relative Rubisco / PEPC activity on was shown in a modelling study, where the enzyme 460
activation state was taken into account (Peisker & Henderson, 1992). A 10 % reduction in 461
Rubisco activity relative to PEPC activity resulted in increasing by 14 %. A similar result was 462
obtained experimentally in sugarcane where a 50 % higher relative Rubisco / PEPC activity 463
measured in vitro corresponded to a 16 % lower estimated from isotopic discrimination of 464
total leaf dry matter (Saliendra et al., 1996). 465
The second scenario formulated to explain the flat id pattern observed in LL plants, involved 466
varying gBS between light intensities. Under decreasing PAR, LL plants showed a differential 467
capacity to retain CO2 in BS. When, under limiting light, PEPC was downregulated, and CO2 468
flux to BS was reduced, the CO2 available in BS was trapped more effectively. In other words 469
BS had the capacity to maintain high CBS even under decreased PEPC activity. This relatively 470
higher CO2 concentration would maintain a physiological Rubisco carboxylation rate without 471
any relative change in activity. Although counterintuitive, the idea of tuneable gBS is supported 472
by some theoretical considerations. Sowinsky and colleagues (2008) showed that the dimensions 473
of plasmodesmata in maize are insufficient to account for a passive flow of solutes from BS to M 474
at physiological rate, and they postulated the existence of active transport (mass flow or vesicle 475
transport). If active transport is involved in metabolite trafficking, the cell could easily regulate 476
the transport rate between M and BS, thus gBS. 477
Wider implications 478
The long-term and short-term acclimation to LL has implications at field level. In crop 479
canopies leaves emerge fully exposed (equivalent to HL plants) and then undergo a low-light 480
acclimation when progressively shaded by newly emerging leaves. We showed that maize leaves 481
grown under HL did not short-term acclimate [in agreement with (Ubierna et al., 2013)], nor 482
did plants grown under intermediate light (Kromdijk et al., 2010). However, plants grown under 483
diffuse LL did display the capacity to short-term acclimate (flat response). We hypothesised 484
two scenarios, both involving the capacity of optimising limiting ATP resources under low PAR. 485
If plants were deploying similar strategies in the field, the impact of leakiness-dependent carbon 486
losses at canopy scale may be much smaller than previously thought (Kromdijk et al., 2008). 487
Future work will be oriented towards studying whether the ‘low leakiness state’ is also 488
light state’ can be induced in HL plants upon exposure to LL for a suitable acclimation period, 490
thus mimicking the temporal transition that leaves undergo in the canopy. 491
Conclusion
492
The phenomenon of leakiness, , the amount of CO2 diffusing out of the bundle sheath, 493
expressed as relative to PEP carboxylation rate, was studied in maize by isotopic discrimination, 494
gas exchange and photochemistry measurements. Respiration in the light and ATP production 495
rate were measured directly. Data were interpreted using the established approach of fitting to 496
and using a novel approach of fitting J to J that removes the circularity of the / approach. 497
Plants grown in LL showed constant at decreasing light intensities, a response not reported 498
in previous findings. This particular response was not predicted by the C4 model under common 499
constraints but, by releasing the constraint of equal C4 / C3 energy partitioning (x) or equal 500
bundle sheath conductance between light intensities, it was possible to formulate hypotheses to 501
describe the two different acclimation strategies. HL plants operated efficiently at HL but 502
maintained a high PEPC activity at low light, resulting in high CO2 overcycling. At limiting light 503
intensities LL plants downregulated PEPC more than proportionally to the C3 activity and there 504
was a shift from a PEPC-driven CCM to a respiration-driven CCM, effectively cutting the ATP 505
cost of the CCM when light was limiting. Physiological assimilation rates were maintained either 506
by increasing Rubisco activity or by tuning gBS, effectively trapping the CO2 resulting from 507
decarboxylation of malate and pyruvate. In both cases the plant could optimise scarce ATP 508
resources. The actual impact of leakiness on canopy net photosynthetic uptake may need to be 509
revised in light of this surprising acclimation plasticity. 510
Acknowledgments
511
We are deeply grateful to Asaph Cousins, Johannes Kromdijk, Jeremy Harbinson and Xinyou 512
Yin for the kind hospitality in their labs and the fruitful and stimulating exchange of ideas, to 513
Johannes Kromdijk for contribution to the manuscript and review, Madeline Mitchell and Jessica 514
Royles for review, to Davide Gusberti for seeds, to Bayer Crop Science and Syngenta for the 515
material provided. Funding: EU FP7 Marie curie ITN Harvest, grant n° 238017. 516
References
Baker N.R. & Long S.P. (1988) Photosynthesis and temperature, with particular reference to effects on quantum yield. Paper presented at the Plants and temperature: Society for Experimental Biology Symposium No XXXXII.
Barbour M.M., McDowell N.G., Tcherkez G., Bickford C.P. & Hanson D.T. (2007) A new measurement technique reveals rapid post-illumination changes in the carbon isotope composition of leaf-respired CO2. Plant Cell and Environment, 30, 469-482.
Covshoff S. & Hibberd J.M. (2012) Integrating C-4 photosynthesis into C-3 crops to increase yield potential. Current Opinion in Biotechnology, 23, 209-214. Craig H. (1953) The Geochemistry of the Stable Carbon Isotopes. Geochimica Et Cosmochimica Acta, 3, 53-92.
D'Ambrosio N., Arena C. & Virzo de Santo A. (2003) Different Relationship Between Electron Transport and CO2 Assimilation in two Zea mays cultivars as Influenced by Increasing Irradiance. Photosynthetica, 41, 489-495.
Dougherty R.L., Bradford J.A., Coyne P.I. & Sims P.L. (1994) Applying an empirical model of stomatal conductance to three C4 grasses. Agricultural and Forest Meteorology, 67, 269-290.
Driscoll S.P., Prins A., Olmos E., Kunert K.J. & Foyer C.H. (2006) Specification of adaxial and abaxial stomata, epidermal structure and photosynthesis to CO2 enrichment in maize leaves. Journal of Experimental Botany, 57, 381-390.
Edwards G.E. & Baker N.R. (1993) Can CO2 assimilation in maize leaves be predicted accurately from chlorophyll fluorescence analysis. Photosynthesis Research, 37, 89-102.
Evans J.R., Sharkey T.D., Berry J.A. & Farquhar G.D. (1986) Carbon Isotope Discrimination Measured Concurrently with Gas-Exchange to Investigate CO2 Diffusion in Leaves of Higher-Plants. Australian Journal of Plant Physiology, 13, 281-292.
FAO (2012) Fao Statistical division web page, Rome.
Farquhar G.D. (1983) On the Nature of Carbon Isotope Discrimination in C4 Species. Australian Journal of Plant Physiology, 10, 205-226.
Farquhar G.D. & Cernusak L.A. (2012) Ternary effects on the gas exchange of isotopologues of carbon dioxide. Plant Cell and Environment, 35, 1221-1231. Farquhar G.D., von Caemmerer S. & Berry J.A. (1980) A biochemical-model of photosynthetic CO2 assimilation in leaves of C3 species. Planta, 149, 78-90.
Flexas J., Diaz-Espejo A., Berry J.A., Cifre J., Galmes J., Kaidenhoff R., Medrano H. & Ribas-Carbo M. (2007) Analysis of leakage in IRGA's leaf chambers of open gas exchange systems: quantification and its effects in photosynthesis parameterization. Journal of Experimental Botany, 58, 1533-1543.
Furbank R., Jenkins C. & Hatch M. (1990) C4 Photosynthesis: Quantum Requirement, C4 and Overcycling and Q-Cycle Involvement. Functional Plant Biology, 17, 1-7. Gandin A. & Cousins A.B. (2012) The contribution of respiratory fractionation to leaf CO2 isotope exchange in the C3 plant Nicotina tabacum. Paper presented at the
21st Western Photosynthesis Conference, Asilomar Conference Grounds Pacific Grove, California, USA.
Genty B., Briantais J.M. & Baker N.R. (1989) The relationship between the quantum yield of photosynthetic electron-transport and quenching of chlorophyll fluorescence. Biochimica Et Biophysica Acta, 990, 87-92.
G J D M B F W C G A M T D E C CO C ites: comparison between Nicotiana sylvestris and Helianthus annuus under drought. Plant Cell and Environment, 24, 505-515.
Gillon J.S. & Griffiths H. (1997) The influence of (photo)respiration on carbon isotope discrimination in plants. Plant Cell and Environment, 20, 1217-1230.
Griffiths H., Broadmeadow M.S.J., Borland A.M. & Hetherington C.S. (1990) Short-Term Changes in Carbon-Isotope Discrimination Identify Transitions between C3 and C4 Carboxylation during Crassulacean Acid Metabolism. Planta, 181, 604-610.
Griffiths H., Weller G., Toy L.F.M. & Dennis R.J. (2013) You're so vein: bundle sheath physiology, phylogeny and evolution in C3 and C4 plants. Plant, Cell & Environment, 36, 249-261.
Henderson S.A., Von Caemmerer S. & Farquhar G.D. (1992) Short-Term Measurements of Carbon Isotope Discrimination in Several C4 Species. Australian Journal of Plant Physiology, 19, 263-285.
Hymus G.J., Maseyk K., Valentini R. & Yakir D. (2005) Large daily variation in C-13-enrichment of leaf-respired CO2 in two Quercus forest canopies. New Phytologist, 167, 377-384.
Igamberdiev A.U., Mikkelsen T.N., Ambus P., Bauwe H., Lea P.J. & Gardestrom P. (2004) Photorespiration contributes to stomatal regulation and carbon isotope fractionation: a study with barley, potato and Arabidopsis plants deficient in glycine decarboxylase. Photosynthesis Research, 81, 139-152.
Kajala K., Covshoff S., Karki S., Woodfield H., Tolley B.J., Dionora M.J.A., Mogul R.T., Mabilangan A.E., Danila F.R., Hibberd J.M. & Quick W.P. (2011) Strategies for engineering a two-celled C4 photosynthetic pathway into rice. Journal of Experimental Botany, 62, 3001-3010.
Krall J.P. & Edwards G.E. (1990) Quantum yields of photosystem-ii electron-transport and carbon-dioxide fixation in c4-plants. Australian Journal of Plant Physiology, 17, 579-588.
Kromdijk J., Griffiths H. & Schepers H.E. (2010) Can the progressive increase of C4 bundle sheath leakiness at low PFD be explained by incomplete suppression of photorespiration? Plant Cell and Environment, 33, 1935-1948.
Kromdijk J., Schepers H.E., Albanito F., Fitton N., Carroll F., Jones M.B., Finnan J., Lanigan G.J. & Griffiths H. (2008) Bundle Sheath Leakiness and Light Limitation during C4 Leaf and Canopy CO2 Uptake. Plant Physiology, 148, 2144-2155.
Lanigan G.J., Betson N., Griffiths H. & Seibt U. (2008) Carbon Isotope Fractionation during Photorespiration and Carboxylation in Senecio. Plant Physiology, 148, 2013-2020.
Long S.P. & Bernacchi C.J. (2003) Gas exchange measurements, what can they tell us about the underlying limitations to photosynthesis? Procedures and sources of error. Journal of Experimental Botany, 54, 2393-2401.
Mook W.G., Bommerso.Jc & Staverma.Wh (1974) Carbon Isotope Fractionation between Dissolved Bicarbonate and Gaseous Carbon-Dioxide. Earth and Planetary Science Letters, 22, 169-176.
O'Leary M.H. (1984) Measurement of the isotope fractionation associated with diffusion of carbon dioxide in aqueous solution. The Journal of Physical Chemistry, 88, 823-825.
Oberhuber W., Dai Z.Y. & Edwards G.E. (1993) Light dependence of quantum yields of photosystem-ii and CO2 fixation in C3 and C4 plants. Photosynthesis Research, 35, 265-274.
Osborne C.P. & Sack L. (2012) Evolution of C4 plants: a new hypothesis for an interaction of CO2 and water relations mediated by plant hydraulics. Philosophical Transactions of the Royal Society B-Biological Sciences, 367, 583-600.
Pearcy R.W. & Ehleringer J. (1984) Comparative ecophysiology of C3 and C4 plants. Plant, Cell & Environment, 7, 1-13. Peisker M. & Henderson S.A. (1992) Carbon - terrestrial c4 plants. Plant Cell and Environment, 15, 987-1004.
Pengelly J.J.L., Sirault X.R.R., Tazoe Y., Evans J.R., Furbank R.T. & von Caemmerer S. (2010) Growth of the C4 dicot Flaveria bidentis: photosynthetic acclimation to low light through shifts in leaf anatomy and biochemistry. Journal of Experimental Botany, 61, 4109-4122.
Pons T.L., Flexas J., von Caemmerer S., Evans J.R., Genty B., Ribas-Carbo M. & Brugnoli E. (2009) Estimating mesophyll conductance to CO2: methodology, potential errors, and recommendations. Journal of Experimental Botany, 60, 2217-2234.
Prioul J.L. & Chartier P. (1977) Partitioning of Transfer and Carboxylation Components of Intracellular Resistance to Photosynthetic CO2 Fixation: A Critical Analysis of the Methods Used. Annals of Botany, 41, 789-800.
Saliendra N.Z., Meinzer F.C., Perry M. & Thom M. (1996) Associations between partitioning of carboxylase activity and bundle sheath leakiness to CO2, carbon isotope discrimination, photosynthesis, and growth in sugarcane. Journal of Experimental Botany, 47, 907-914.
Sheehy J.E., ed (2008) Charting New Pathways to C4 Rice. World Scientific Publishing, Singapore.
Sowinski P., Szczepanik J. & Minchin P.E.H. (2008) On the mechanism of C4 photosynthesis intermediate exchange between Kranz mesophyll and bundle sheath cells in grasses. Journal of Experimental Botany, 59, 1137-1147.
Sun W.E.I., Ubierna N., Ma J.-Y. & Cousins A.B. (2012) The influence of light quality on C4 photosynthesis under steady-state conditions in Zea mays and Miscanthus × giganteus: changes in rates of photosynthesis but not the efficiency of the CO2 concentrating mechanism. Plant, Cell & Environment, 35, 982-993.
Tazoe Y., Hanba Y.T., Furumoto T., Noguchi K. & Terashima I. (2008) Relationships between quantum yield for CO2 assimilation, activity of key enzymes and CO2 leakiness in Amaranthus cruentus, a C4 dicot, grown in high or low light. Plant and Cell Physiology, 49, 19-29.
Tcherkez G., Bligny R., Gout E., Mahé A., Hodges M. & Cornic G. (2008) Respiratory metabolism of illuminated leaves depends on CO2 and O2 conditions. Proceedings of the National Academy of Sciences, 105, 797-802.
Ubierna N., Sun W. & Cousins A.B. (2011) The efficiency of C4 photosynthesis under low light conditions: assumptions and calculations with CO2 isotope discrimination. Journal of Experimental Botany, 62, 3119-3134.
Ubierna N., Sun W., Kramer D.M. & Cousins A.B. (2013) The Efficiency Of C4 Photosynthesis Under Low Light Conditions In Zea Mays, Miscanthus X Giganteus And Flaveria Bidentis. Plant, Cell & Environment, 36, 365-381.
Vogel J.C. (1980) Fractionation of the carbon isotopes during photosynthesis. Springer, Berlin and New york.
Vogel J.C., Grootes P.M. & Mook W.G. (1970) Isotopic Fractionation between Gaseous and Dissolved Carbon Dioxide. Zeitschrift Fur Physik, 230, 225-238. von Caemmerer S. (2000) Biochemical models of leaf Photosynthesis. Csiro.
von Caemmerer S. & Farquhar G.D. (1981) Some Relationships between the Biochemistry of Photosynthesis and the Gas-Exchange of Leaves. Planta, 153, 376-387. von Caemmerer S. & Furbank R.T. (2003) The C4 pathway: an efficient CO2 pump. Photosynthesis Research, 77, 191-207.
Wingate L., Seibt U., Moncrieff J.B., Jarvis P.G. & Lloyd J. (2007) Variations in 13C discrimination during CO2 exchange by Picea sitchensis branches in the field. Plant Cell and Environment, 30, 600-616.
Yin X. & Struik P.C. (2009) C3 and C4 photosynthesis models: An overview from the perspective of crop modelling. Njas-Wageningen Journal of Life Sciences, 57, 27-38.
Yin X., Sun Z., Struik P.C. & Gu J. (2011a) Evaluating a new method to estimate the rate of leaf respiration in the light by analysis of combined gas exchange and chlorophyll fluorescence measurements. Journal of Experimental Botany, 62, 3489-3499.
Tables.
Table 1. Abbreviations, definitions and units for variables and acronyms described in the text.
Symbol Definition Values/Units
Isotopic composition relative to Pee dee belemnite ‰ a 13C fractionation due to diffusion of CO
2 in air. Because of vigorous ventilation we neglected the fractionation of
the boundary layer (Kromdijk et al., 2010).
4.4 ‰ (Craig, 1953)
A Net assimilation mol m-2 s-1
ad 13C fractionation due to diffusion of CO2 in water 0.7 ‰ (O'Leary, 1984)
ATP Adenosine triphosphate
b3 13C fractionation during carboxylation by Rubisco including respiration and photorespiration fractionation
(Farquhar, 1983).
‰
b3’ 13C fractionation during carboxylation by Rubisco 30 ‰ (Roeske & Oleary, 1984)
b4 Net fractionation by CO2 dissolution, hydration and PEPC carboxylation including respiratory fractionation
(Farquhar, 1983, Henderson et al., 1992).
‰
b4’ Net fractionation by CO2 dissolution, hydration and PEPC carboxylation. -5.7 ‰ at 25 °C but variable with temperature (Farquhar, 1983,
Henderson et al., 1992, Kromdijk et al., 2010). BS Bundle sheath
Ca CO2 concentration in the cuvette as measured by IRGA mol mol-1
CBS CO2 concentration in the bundle sheath mol mol-1
Ci CO2 concentration in the intercellular spaces as calculated by the IRGA (Li-cor manual Eqn 1-18). mol mol-1
CM CO2 concentration in the mesophyll Eqn 8 mol mol-1
e 13C fractionation during decarboxylation 0 ‰ to -10 ‰ (Barbour et al., 2007, Ghashghaie et al., 2001, Gillon &
Griffiths, 1997, Hymus et al., 2005, Igamberdiev et al., 2004, Sun et al., 2012), -6 ‰ in this studystudy (Kromdijk et al., 2010).
e’ 13C fractionation during decarboxylation, including the correction for measurement artefacts: e e
In this study 13C
measurements = -9.46 ‰; 13Cgrowth chamber = -8 ‰ (Wingate et al., 2007)
‰
es 13C fractionation during internal CO2 dissolution 1.1 ‰ (Mook et al., 1974, Vogel, 1980, Vogel et al., 1970).
f 13C fractionation during photorespiration. -11.6 ‰ (Lanigan et al., 2008).
Fs Steady state fluorescence signal Volts, arbitrary
Fm Maximum fluorescence signal of dark adapted leaves Volts, arbitrary
Fm’ Saturating pulse induced F signal during steady state photosynthesis Volts, arbitrary
GA Gross assimilation mol m-2 s-1
gBS Bundle sheath conductance to CO2, calculated by curve fitting mol m2 s-1
gM Mesophyll conductance to CO2 1 mol m2 s-1 bar-1 (Kromdijk et al., 2010)
gs Stomata conductance to CO2 mol m2 s-1
HL High light IRGA Infra red gas analyzer
JMOD Modelled ATP production rate Eqn 9 E m-2 s-1
JATP ATP production rate mol m-2 s-1
JATP Low
O2
ATP production rate at low O2 and high CO2 Eqn 1 mol m-2 s-1
L Rate of CO2 Leakage from BS to M Eqn 6 mol m-2 s-1
LL Low light M Mesophyll
OM O2 mol fraction in the mesophyll cells (in air at equilibrium) 210000 mol mol-1
OBS O2 mol fraction in the bundle sheath cells (in air at equilibrium)
(von Caemmerer, 2000)
mol mol-1
PAR Photosynthetically active radiation E m-2 s-1
PEP Phosphoenolpyruvate
PEPC Phosphoenolpyruvate carboxylase
RLIGHT Total non photorespiratory CO2 production in the light mol m-2 s-1
RM Mesophyll non photorespiratory CO2 production in the light RM = 0.5 RLIGHT (Kromdijk et al., 2010, Ubierna et al.,
2011, von Caemmerer, 2000)
mol m-2 s-1
Rubisco Ribulose bisphosphate carboxylase oxygenase
s Fractionation during leakage of CO2 out of the bundle sheath cells 1.8 ‰ (Henderson et al., 1992). s’ Lumped conversion efficiency. Includes leaf absorptance, the partitioning of light to photosystem II and the
conversion of energy into ATP (Yin & Struik, 2009, Yin et al., 2011b)
Dimensionless t Ternary effects t where E / mmol m-2 s-1 is the transpiration rate (calculated by the IRGA software,
parameter Trmmol), gac / mol m-2 s-1 is the conductance to diffusion of CO2 in air (calculated by the IRGA
software, parameter CndCO2), a is the isotopic fractionation during diffusion in air.
‰ (Farquhar & Cernusak, 2012)<
VC Rubisco carboxylation rate (Ubierna et al., 2011) mol m-2 s-1
VO Rubisco oxygenation rate (Ubierna et al., 2011) mol m-2 s-1
VP PEP carboxylation rate Eqn 7 mol m-2 s-1
x Partitioning factor of JATP between C4 activity VP (PEP regeneration and PEP carboxylation, Eqn 7) and C3
activity VC+VO (reductive pentose phosphate pathway and photerespiratory cycle)
0.4 (Kromdijk et al., 2010, Ubierna et al., 2011, Ubierna et al., 2013, von Caemmerer, 2000)
Fraction of PSII active in BS cells 0.15 (Edwards & Baker, 1993, Kromdijk et al., 2010, von Caemmerer, 2000).
* Half of the reciprocal of the Rubisco specificity 0.000193 (von Caemmerer, 2000). Carbon Isotope discrimination against 13C ‰
OBS Observed carbon Isotope discrimination against 13C, Eqn 16 supporting text 1 ‰
Leakiness = L/Vp dimentionless
id Leakiness estimated with the isotope method including respiratory and photorespiratory fractionation and
calculating CBS Eqn 3 (Ubierna et al., 2011)
dimentionless
MOD Leakiness estimated with the C4 light limited photosynthesis equations Eqn 11 dimentionless
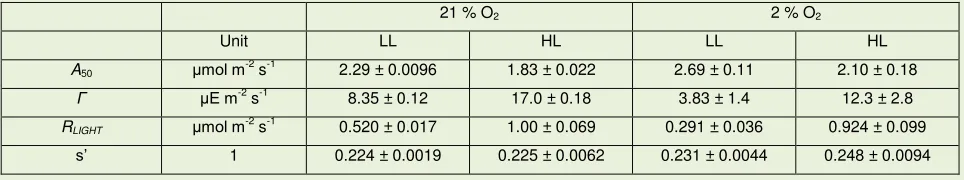
Table 2. Response of HL plants and LL plants to different O2 concentrations. Assimilation at 50 E m-2 s-1 (A50) is shown to exemplify limiting light conditions. The compensation point was determined fitting a quadratic
equation with the use of dedicated software (Photosyn assistant 1.2, Dundee Scientific, Dundee, UK) (Dougherty et al., 1994, Prioul & Chartier, 1977). Respiration in the light RLIGHT was determined by linear regression of A against PAR·Y(II) / 3 (see supporting Text 1). s’ was the slope of the linear regression of A against PAR·Y(II) / 3 and represented the lumped conversion efficiency of PAR into ATP. Values were not
significantly different in a t-test for P < 0.05. n = 7
21 % O2 2 % O2
Unit LL HL LL HL
A50 mol m
-2
s-1 2.29 ± 0.0096 1.83 ± 0.022 2.69 ± 0.11 2.10 ± 0.18
E m-2
s-1
8.35 ± 0.12 17.0 ± 0.18 3.83 ± 1.4 12.3 ± 2.8
RLIGHT mol m-2 s-1 0.520 ± 0.017 1.00 ± 0.069 0.291 ± 0.036 0.924 ± 0.099
s’ 1 0.224 ± 0.0019 0.225 ± 0.0062 0.231 ± 0.0044 0.248 ± 0.0094
Table 3 Bundle sheath conductance estimated by curve fitting. J / J fitted a modelled ATP production ratio
(JMOD), on a measured JATP (determined with the chlorophyll fluorescence – low O2 method). / fitted a modelled isotopic discrimination MOD, to the measured isotopic discrimination OBS. Different letters were deemed significant for P < 0.05 in a Tukey multiple comparison test (Genstat). Average values ± S.D. LL n = 4;
HL n = 3.
gBS
Fitting approach Unit LL HL
J / J mol m-2 s-1 8.20·10-4 ± 1.4·10-4 a 10.3·10-4 ± 1.8·10-4 a
/ mol m-2
s-1
12.7·10-4
± 1.5·10-4
a 46.4·10-4
± 8.5·10-4
[image:21.612.33.336.424.483.2]Figures
Figure 1. Gas exchange responses of HL and LL plants. LL plants (triangles) and HL plants (squares) under
low O2 (open symbols) or ambient air (filled symbols) were exposed to decreasing light intensity. (A): net assimilation, A. The curves were fitted in order to calculate the compensation point with the use of dedicated software (Photosyn assistant 1.2, Dundee Scientific, Dundee, UK) (Dougherty et al., 1994, Prioul & Chartier, 1977). The inset shows a magnification in the vicinity of the compensation point. (B): Ci / Ca. (C): stomatal conductance, gs. Error bars represent standard error. HL n = 3; LL n = 4.
A /
m
ol m
-2 s
-1
0 6 12 18
LL 21% O2
HL 21% O2
LL 2% O2
HL 2% O2
0 30 50 75
0 2 4
(A)
Ci
/ C
a
0.4 0.6 0.8 1.0
(B)
PAR / mol m-2 s-1
0 100 200 300 400 500
gs
/ m
ol m
-2 s
-1
0.02 0.05 0.08 0.11
Figure 2. Yield of photosystem II, Y(II) at decreasing light intensity. Response of Y(II) of HL plants (A) and
LL plants (B) measured in low O2 (open symbols) or ambient air (filled symbols) to decreasing light intensities. Error bars represent standard error. n = 4.
Y
(I
I)
0.60 0.65 0.70 0.75
HL 2% O2
HL 21% O2
(A)
PAR / mol m-2 s-1
0 100 200 300 400 500
Y
(I
I)
0.60 0.65 0.70 0.75
LL 2% O2
LL 21% O2
Figure 3. Datasets and model fitting.
1) Total ATP production rate, JATP, and isotopic discrimination during photosynthesis OBS. Symbols in panel
(A) show JATP for LL plants (triangles) and HL plants (squares). Symbols in panel (B) show OBS for LL plants (triangles) and for HL plants (squares).
2) Model fitting with J / J and / approaches. In order to estimate gBS, the C4 photosynthesis model (lines) was fitted to the two different datasets alternatively. In the J / J approach the C4 model (solid lines) was
expressed as JMOD and fitted to JATP measured on LL plants (Panel (A), thin solid line) and to JATP measured on HL plants [Panel (A), thick solid line]. In the / approach the C4 model (dotted lines) was expressed as MOD and fitted to OBS measured on LL plants [Panel (B), thin dotted line] and on OBS measured on HL plants (Panel
(B), thick dotted line).
3) Note the trade-off between fitting approaches. As the C4 model is the same, by fitting JMOD to JATP, MOD is distanced from OBS [see solid lines in panel (B)]. Similarly, by fitting MOD to OBS, JMOD is distanced from JATP [see dotted lines in panel (A)]. Error bars represent standard error. HL n = 3; LL n = 4.
PAR mol m-2 s-1
0 100 200 300 400 500
JA
T
P
/
m
o
l
m
-2 s
-1
20 50 80 110
(A)
PAR / mol m-2s-1
0 100 200 300 400 500
‰
5 10 15 20
(B)
Figure 4. Output of the C4 model and the isotopic discrimination model.
(A): response of CBS, calculated either with J / J approach (solid lines), or with the / approach (dotted lines), of LL plants (thin lines) and HL plants (thick lines) to decreasing light intensities.
(B): J / J approach. Symbols represent leakiness based on isotopic discrimination data id (Eqn 3) for LL plants (triangles) and for HL plants (squares); lines represent modelled leakiness MOD (Eqn 11) for LL plants (thin solid line) and for HL plants (thick solid line).
(C): / approach. Symbols represent leakiness based on isotopic discrimination data id (Eqn 3) for LL plants (triangles) and for HL plants (squares); lines represent modelled leakiness MOD (Eqn 11) for LL plants (thin dotted lines) and for HL plants (thick dotted line).
Error bars represent standard error. HL n = 3; LL n = 4.
C BS
/
m
o
l
m
o
l
-1
800 1400 2000 2600
LL J / J HL J / J LL / HL /
PAR / mol m-1 s-2
0 100 200 300 400 500
0.2 0.4
0.6 LL HL id
id LL mod
HL mod
0.2 0.4
0.6 LL id J / J
HL id J / J
LL mod J / J
HL mod J / J
(B)
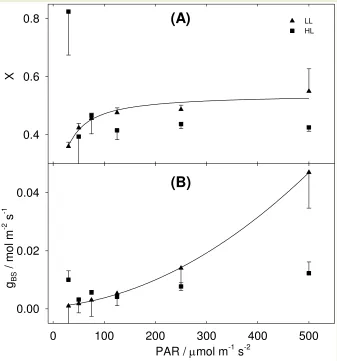
Figure 5. Model refitting. In panel (A) MOD was fitted to id varying x between light intensities. x is the factor partitioning JATP between C4 activity (PEPC carboxylation) and the C3 activity (RPP cycle + glyoxylate recycling). The line displayed is an inverse quadratic regression fitted to LL data. In panel (B) MOD was fitted to id varying bundle sheath conductance gBS between light intensities. The line displayed is a quadratic
regression fitted to LL data. All the other parameters were unvaried from the previous fitting step. Error bars represent standard error. HL n = 3; LL n = 4.
PAR / mol m-1 s-2
0 100 200 300 400 500
gBS
/ m
ol m
-2 s
-1
0.00 0.02 0.04
X
0.4 0.6
0.8