This is a repository copy of Direct visualisation of collateral ventilation in COPD with hyperpolarised gas MRI.
White Rose Research Online URL for this paper: http://eprints.whiterose.ac.uk/119984/
Version: Accepted Version
Article:
Marshall, H., Deppe, M.H., Parra-Robles, J. et al. (10 more authors) (2012) Direct
visualisation of collateral ventilation in COPD with hyperpolarised gas MRI. Thorax , 67 (7). pp. 613-617. ISSN 0040-6376
https://doi.org/10.1136/thoraxjnl-2011-200864
[email protected] https://eprints.whiterose.ac.uk/ Reuse
Unless indicated otherwise, fulltext items are protected by copyright with all rights reserved. The copyright exception in section 29 of the Copyright, Designs and Patents Act 1988 allows the making of a single copy solely for the purpose of non-commercial research or private study within the limits of fair dealing. The publisher or other rights-holder may allow further reproduction and re-use of this version - refer to the White Rose Research Online record for this item. Where records identify the publisher as the copyright holder, users can verify any specific terms of use on the publisher’s website.
Takedown
If you consider content in White Rose Research Online to be in breach of UK law, please notify us by
1
Direct Visualisation of Collateral Ventilation in COPD with Hyperpolarised Gas MRI
Helen Marshall1, Martin H. Deppe1, Juan Parra-Robles1, Susan Hillis2, Catherine Billings2, Smitha Rajaram1, Andrew J. Swift1, Sam R. Miller3, Joanna H. Watson3, Jan Wolber4, David A. Lipson5, Rod Lawson2 and Jim M. Wild1
1
Academic Radiology, University of Sheffield, Sheffield, South Yorkshire, UK 2
Respiratory Medicine, Sheffield Teaching Hospitals NHS Trust, South Yorkshire, UK 3
GlaxoSmithKline, Stockley Park, UK 4
GE Healthcare, Amersham, UK 5
GlaxoSmithKline, King of Prussia, PA, USA
Corresponding Author: Jim M. Wild
Department of Academic Radiology C Floor, Royal Hallamshire Hospital Glossop Road
Sheffield, S10 2JF
tel: +44 (0)114 226 5389, fax: +44 (0)114 271 1714
Key words: collateral ventilation, COPD, MRI, patho-physiology
2
What is the key question? Is it possible to visualise collateral ventilation in COPD during a
single breathold using a non-invasive, non-ionising imaging technique?
What is the bottom line? We demonstrate direct imaging of delayed gas filling in what we
believe to be collateral ventilation in COPD patients, using hyperpolarised gas MRI.
Why read on? The ability to image and quantify collateral ventilation pathways directly may
3 ABSTRACT
Background Collateral ventilation has been proposed as a mechanism of compensation of respiratory function in obstructive lung diseases but limited observations of it in vivo have been demonstrated. The assessment of collateral ventilation with an imaging technique could help gain insight into lung physiology and aid with the planning of new bronchoscopic techniques for treating emphysema.
Objective To image delayed ventilation that may be related to collateral ventilation over the period of a single breath-hold in patients with Chronic Obstructive Pulmonary Disease (COPD).
Methods Time-resolved hyperpolarised 3He Magnetic Resonance Imaging was used to image the progressive influx of polarised gas into initially non-ventilated defects.
Results A time-series of images showed 3He moving into lung regions which were initially non-ventilated. Ventilation defects with delayed-filling were observed in eight of the ten patients scanned.
4 INTRODUCTION
Collateral ventilation pathways have been proposed as a mechanism of increased tolerance to obstructive lung diseases by enabling alternative respiratory pathways to carry out gas exchange (1,2), see the schematic in figure 1. In addition to gaining insight into lung physiology, the assessment of collateral ventilation with an imaging technique could help with the planning of new bronchoscopic techniques for treating emphysema (2,3). In bronchoscopic lung volume reduction, collateral ventilation from adjacent lobes prevents the target atelectasis (4), whereas in airway bypass treatment the presence of collateral ventilation can be advantageous (5).
Catheter-based techniques (6) have been used to measure collateral ventilation but a non-invasive method is desirable. Radiological Computed Tomography (CT) scores of
5
Here we present direct visual evidence of delayed gas ventilation at breath-hold in what we believe to be collateral ventilation in Chronic Obstructive Pulmonary Disease (COPD). Images were acquired over the period of a single breath-hold using a invasive and non-ionising imaging modality. Delayed-filling of peripheral regions was also observed in some patients, which is thought to be due to increased resistance in the small airways. Time-resolved hyperpolarised 3He MRI was used to image delayed ventilation in COPD patients with whole lung coverage.
METHODS
Ten COPD patients were scanned using a 1.5T whole body MRI system (GE HDx, Milwaukee, WI) equipped for hyperpolarised 3He imaging. The inclusion criteria were: COPD without other significant respiratory disease as diagnosed by a respiratory physician,
post-bronchodilator ratio of Forced Expiratory Volume in 1 second (FEV1) to Forced Vital Capacity (FVC) < 0.7, post-bronchodilator FEV1 > 30% and < 80% of predicted, cigarette smoking history of > 10 pack years, and resting pulse oximeter oxygen saturation (SpO2) of > 90% on room air.
3
He was polarised on site to 25% using rubidium spin-exchange (15) apparatus (GE
6
images were acquired during the breath-hold. A 3D coronal spoiled gradient echo sequence (16) with full lung coverage was used for imaging with parameters: field of view = 35cm2, in-plane matrix = 64 x 32, 16 x 20mm slices, flip angle = = 62kHz, echo time (TE) = 0.8ms, and repetition time (TR) = 2.5ms. This 3D volume was acquired at six time-points during the single breathold; at 0, 1.3, 5.8, 10.3, 14.8 and 19.3 seconds.
The course images were analysed for any ventilation defects present in the first time-point image which subsequently filled with gas during the breathold. A pattern of gas filling with gas moving gradually from the edges of the defect towards the centre was identified as being suggestive of collateral ventilation.
RESULTS
The COPD patients scanned (5 male, 5 female) had a mean age of 60.6 years, a mean smoking history of 39.5 pack years and a mean FEV1 % predicted of 49.6%. Ventilation defects with delayed-filling were observed in eight of the ten COPD patients scanned (table 1). These examples varied in defect size, number and fill-rate from the most visibly striking case shown in figure 2 to much more subtle effects such as those seen in patient 3 in figure 3. Fifteen slow-filling ventilation defects were identified, 8 of these were seen to fill from the edge(s) of the defect and 7 were too small to determine the gas fill pattern.
7
time-course of the breath-hold are highlighted with arrows. The largest defect is magnified in the top row. The images are all displayed with the same colour scale, the magnitude of which is proportional to the density of 3He in that pixel. Hyperpolarised 3He MR signal is non-renewable and diminishes over time due to both the imaging procedure and natural T1 relaxation processes due to the presence of oxygen (16). In normally ventilated regions of the lung this expected signal decay over time is observed and has been used to infer lung oxygen partial pressure (17). However, in the regions indicated the signal increases over time, with a progressive influx of polarised gas from the edge of the defects towards the centre. Sagittal reformats through the right lung at time-points t=0s (g) and t=19.3s (h) illustrate the 3D nature of the upper lobe ventilation defect and the related wash-in of gas. The delay to signal onset map (figure 2i) shows the time taken in seconds from the start of the data acquisition until gas arrived at each pixel. The gas-filling pattern from both of the defect edges towards the centre is not consistent with the defects being ventilated via their feeding bronchi. This suggests that gas is entering the defects via collateral pathways at the defect edges.
8
Figure 3 shows examples of slow-filling ventilation defects in two other patients. In one patient (top row) several wedge-shaped defects along the peripheral edge of the right lung are filled over the course of the breathold. In another patient (bottom row) delayed ventilation of a wedge defect on the outside edge of the left lung is seen.
An example of delayed-filling of a peripheral ventilation defect is shown in figure 4. The slow-filling of the defect at the lower left lung edge, with a front of gas progressing slowly towards the lung edge, may be due to increased resistance to air-flow in the peripheral airways.
DISCUSSION
Ventilation defects with delayed filling in a pattern consistent with collateral ventilation were observed in 40% of the patients scanned. Delayed-filling ventilation defects were present in 80% of the patients but some were too small to imply which mechanism might cause the delayed ventilation.
9
could represent sensitivity to peripheral airways flow resistance in the 'quiet zone' (18) of the lungs.
Collaterally-ventilated defects may arise from centrilobular emphysema (19), where centrilobular spaces form in lobules with obliterated terminal bronchioles (20) and may become ventilated via collateral pathways (thanks to Professor Jim Hogg at the University of British Columbia for useful comments on this possible mechanism in the review process). The larger collaterally-ventilated defects might be networks of lobules with inter-connecting centrilobular spaces.
High-resolution 3He ventilation images, which were acquired as a single time frame snapshot during the same scanning sessions (figures 2(k), 3(d, h) and 4(h)) show no information about the collateral wash-in of gas. A whole breathold is needed for a single acquisition of the lung volume with high-resolution multi-slice imaging, meaning that there is no time-resolved aspect to the data and changes over time cannot be detected. The slice acquisition timing of a high-resolution ventilation dataset will change the appearance of defects with delayed-ventilation. For example, if a slow-filling defect is imaged near the start of a breathold it will appear as a signal void (e.g. figure 2(k)) but if the same defect is imaged later in the multi-slice acquisition, after gas has entered it, the ventilation defect will contain some signal (e.g. figure 3(h)).
10
By virtue of its low atomic mass 3He in air is more diffusive than xenon in air or pure air alone, so it is likely to show a faster and potentially amplified effect, allowing
delayed/collateral ventilation to be visualised directly over the period of a single breath-hold (within 20 seconds). The use of this technique with hyperpolarised 129Xe MRI may also allow visualisation of delayed/collateral ventilation, although the lower diffusivity of 129Xe may slow the process to beyond a realistic single breath-hold time in patients.
The imaging sequence used is simple and available on all MRI systems equipped for hyperpolarised gas lung imaging. The sequence is readily adaptable, and from this initial data a breathold of 15 seconds with 4 evenly spaced data acquisition time-points should be sufficient to capture delayed ventilation effects similar to those seen here, with the
potential for an associated increased spatial resolution in the images.
In conclusion, a method is demonstrated for direct imaging of delayed ventilation within a single breath-hold, which is able to visualise what we believe to be collateral ventilation in COPD. The technique gives 3D full lung coverage allowing global assessment of delayed and collateral ventilation pathways with regional sensitivity.
ACKNOWLEDGEMENTS
Funded by GlaxoSmithKline (RES111175) and UK EPSRC (EP/D070252/1). Polariser support from GE Healthcare. Steven Parnell and Peggy Xu for help with hyperpolarised gas
11 REFERENCES
1. Hogg JC, Macklem PT, Thurlbeck WM. The resistance of collateral channels in excised human
lungs. J Clin Invest 1969;48(3):421-431.
2. Cetti EJ, Moore AJ, Geddes DM. Collateral ventilation. Thorax 2006;61(5):371-373.
3. Voshaar TH. [Collateral ventilation]. Pneumologie 2008;62(6):355-360.
4. Toma TP, Hopkinson NS, Hillier J, et al. Bronchoscopic volume reduction with valve implants
in patients with severe emphysema. Lancet 2003;361(9361):931-933.
5. Lausberg HF, Chino K, Patterson GA, et al. Bronchial fenestration improves expiratory flow in
emphysematous human lungs. Ann Thorac Surg 2003;75(2):393-398.
6. Aljuri N, Freitag L. Validation and pilot clinical study of a new bronchoscopic method to
measure collateral ventilation before endobronchial lung volume reduction. J Appl Physiol
2009;106(3):774-783.
7. Higuchi T, Reed A, Oto T, et al. Relation of interlobar collaterals to radiological heterogeneity
in severe emphysema. Thorax 2006;61(5):409-413.
8. Salanitri J, Kalff V, Kelly M, et al. 133Xenon ventilation scintigraphy applied to bronchoscopic
lung volume reduction techniques for emphysema: relevance of interlobar collaterals. Intern
Med J 2005;35(2):97-103.
9. Chae EJ, Seo JB, Kim N, et al. Collateral Ventilation in a Canine Model with Bronchial
Obstruction: Assessment with Xenon-enhanced Dual-Energy CT. Radiology
2010;255(3):790-798.
10. Goo HW, Yang DH, Kim N, et al. Collateral ventilation to congenital hyperlucent lung lesions
assessed on xenon-enhanced dynamic dual-energy CT: an initial experience. Korean J Radiol
12
11. Goo HW, Chae EJ, Seo JB, et al. Xenon ventilation CT using a dual-source dual-energy
technique: dynamic ventilation abnormality in a child with bronchial atresia. Pediatr Radiol
2008;38(10):1113-1116.
12. Owers-Bradley JR, Fichele S, Bennattayalah A, McGloin CJ, Bowtell RW, Morgan PS, Moody
AR. MR tagging of human lungs using hyperpolarized 3He gas. J Magn Reson Imaging
2003;17(1):142-146.
13. Woods JC, Yablonskiy DA, Chino K, et al. Magnetization tagging decay to measure
long-range (3)He diffusion in healthy and emphysematous canine lungs. Magn Reson Med
2004;51(5):1002-1008.
14. Wang C, Altes TA, Mugler JP, 3rd, Miller GW, Ruppert K, Mata JF, Cates GD, Jr., Borish L, de
Lange EE. Assessment of the lung microstructure in patients with asthma using
hyperpolarized 3He diffusion MRI at two time scales: comparison with healthy subjects and
patients with COPD. J Magn Reson Imaging 2008;28(1):80-88.
15. Bouchiat M, Carver T, C. V. Nuclear polarization in 3He gas induced by optical pumping and
dipolar exchange. Phys Rev Lett 1960;5:373-375.
16. Wild JM, Fichele S, Woodhouse N, et al. 3D volume-localized pO2 measurement in the
human lung with 3He MRI. Magn Reson Med 2005;53(5):1055-1064.
17. Deninger AJ, Eberle B, Ebert M, et al. Quantification of regional intrapulmonary oxygen
partial pressure evolution during apnea by (3)He MRI. J Magn Reson 1999;141(2):207-216.
18. Mead J. The lung's "quiet zone". N Engl J Med 1970;282(23):1318-1319.
19. Leopold JG, Gough J. The centrilobular form of hypertrophic emphysema and its relation to
chronic bronchitis. Thorax 1957;12(3):219-235.
20. McDonough JE, Yuan R, Suzuki M, Seyednejad N, Elliott WM, Sanchez PG, Wright AC, Gefter
WB, Litzky L, Coxson HO, Pare PD, Sin DD, Pierce RA, Woods JC, McWilliams AM, Mayo JR,
Lam SC, Cooper JD, Hogg JC. Small-airway obstruction and emphysema in chronic obstructive
13
21. Park EA, Goo JM, Park SJ, et al. Chronic obstructive pulmonary disease: quantitative and
visual ventilation pattern analysis at xenon ventilation CT performed by using a dual-energy
14 FIGURE LEGENDS
Figure 1
A graphical representation of collateral ventilation, adapted from Hogg et al (1).
Figure 2
Images tracking collateral ventilation in a COPD patient. Images (a) to (f) show the same coronal slice at six different time points during a single breath-hold. The colour scale is the same for all images (a) to (f). The arrows indicate two collaterally-ventilated defects, and the top row shows magnifications of the largest defect. (g) is a sagittal reformat of the first time-point data and (h) is a sagittal reformat of the last time-point data with the coronal slice position indicated with a dashed white line. (i) shows a delay to signal onset map for the coronal slice with timescale in seconds. (j) is a HRCT image of a similar slice, and (k) is a high-resolution 3He MRI ventilation image of the same coronal slice acquired in the same scanning session.
Figure 3
15 Figure 4
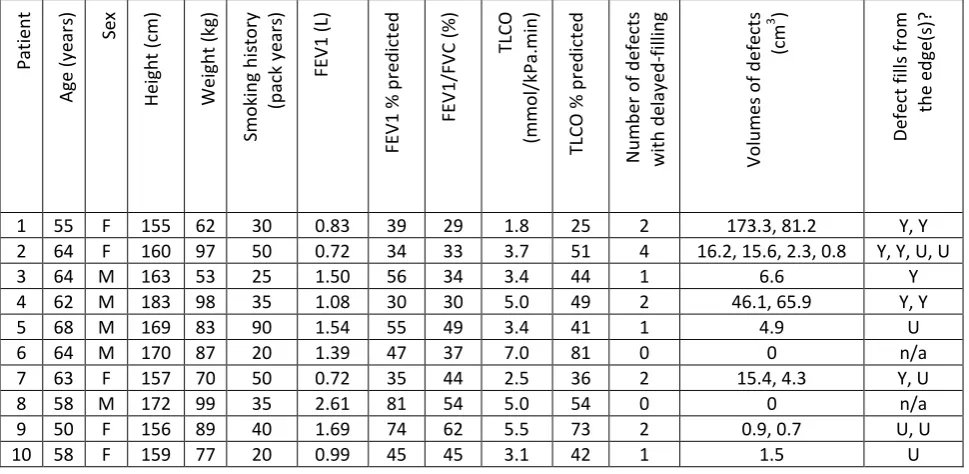
16 TABLE 1
Patient demographics, lung function and delayed-filling ventilation defect information.
P a ti e n t A g e ( y e ar s) S e x H e ig h t (c m ) W e ig h t (k g ) S m o k in g h is to ry (p ac k y e ar s) F E V 1 ( L) F E V 1 % p re d ic te d F E V 1 /F V C ( % ) T LC O (m m o l/ k P a .m in ) T LC O % p re d ic te d N u m b e r o f d e fe cts w ith d e lay e d -f il li n g V o lu m e s o f d e fe ct s ( cm 3 ) D e fe ct fi ll s fr o m th e e d g e (s )?
1 55 F 155 62 30 0.83 39 29 1.8 25 2 173.3, 81.2 Y, Y
2 64 F 160 97 50 0.72 34 33 3.7 51 4 16.2, 15.6, 2.3, 0.8 Y, Y, U, U
3 64 M 163 53 25 1.50 56 34 3.4 44 1 6.6 Y
4 62 M 183 98 35 1.08 30 30 5.0 49 2 46.1, 65.9 Y, Y
5 68 M 169 83 90 1.54 55 49 3.4 41 1 4.9 U
6 64 M 170 87 20 1.39 47 37 7.0 81 0 0 n/a
7 63 F 157 70 50 0.72 35 44 2.5 36 2 15.4, 4.3 Y, U
8 58 M 172 99 35 2.61 81 54 5.0 54 0 0 n/a
9 50 F 156 89 40 1.69 74 62 5.5 73 2 0.9, 0.7 U, U
10 58 F 159 77 20 0.99 45 45 3.1 42 1 1.5 U
17 The Corresponding Author has the right to grant on behalf of all authors and does grant on behalf of all authors, an exclusive licence (or non exclusive for government employees) on a worldwide basis to the BMJ Publishing Group Ltd and its Licensees to permit this article (if accepted) to be published in Thorax editions and any other BMJPGL products to exploit all subsidiary rights, as set out in our
licence(http://group.bmj.com/products/journals/instructions-for-authors/licence-forms/).