http://eprints.whiterose.ac.uk/79208/
Version: Published Version
Article:
Parry, LE, West, LJ, Holden, J et al. (1 more author) (2014) Evaluating approaches for
estimating peat depth. Journal of Geophysical Research: Biogeosciences, 119 (4). 567 -
576. ISSN 2169-8953
https://doi.org/10.1002/2013JG002411
[email protected]
https://eprints.whiterose.ac.uk/
Reuse
Unless indicated otherwise, fulltext items are protected by copyright with all rights reserved. The copyright
exception in section 29 of the Copyright, Designs and Patents Act 1988 allows the making of a single copy
solely for the purpose of non-commercial research or private study within the limits of fair dealing. The
publisher or other rights-holder may allow further reproduction and re-use of this version - refer to the White
Rose Research Online record for this item. Where records identify the publisher as the copyright holder,
users can verify any specific terms of use on the publisher’s website.
Takedown
If you consider content in White Rose Research Online to be in breach of UK law, please notify us by
Evaluating approaches for estimating peat depth
L. E. Parry1, L. J. West2, J. Holden1, and P. J. Chapman1
1School of Geography, University of Leeds, Leeds, UK,2Institute of Applied Geology, School of Earth and the Environment,
University of Leeds, Leeds, UK
Abstract
Estimates of peat depth are required to inform understanding of peatland development, functioning, and ecosystem services such as carbon storage. However, there is a considerable lack of peat depth data at local, national, and global scales. Recent studies have attempted to address this knowledge deficit by using manual probing and ground-penetrating radar (GPR) to estimate depth. Despite increasing application, little consideration has been given to the accuracy of either of these techniques. This study examines the accuracy of probing and GPR for measuring peat depth. Corresponding GPR and probing surveys were carried out at a catchment scale in a blanket peatland. GPR depth estimations, calibrated using common midpoint (CMP) surveys, were found to be on average 35% greater than probe measurements. The source of disagreement was found to be predominantly caused by depth probes becoming obstructed by artifacts within the peat body, although occasionally probing rods also penetrated sediments underlying the peat. Using the Complex Refractive Index Model, it was found that applying a single velocity of 0.036 m ns 1 across a single site may also result in 8 to +17% error in estimation of peat depth due to spatial variability in water content and porosity. It is suggested that GPR calibrated at each site using CMP surveys may provide a more accurate method for measuring peat depth.1. Introduction
Many of the ecosystem services provided by peatlands are delivered due to processes which occur beneath the surface and extend throughout the whole peat profile [Parry et al., 2012]. Peat depth can be considerably variable both within and between individual peatlands, and information on peat depth and morphology is regularly required to inform our understanding of peatland development and functioning. For example, peatlands globally form a considerable carbon stock and have an important role to play in the global carbon cycle [Yu, 2012]. Peat depth data sets are an essential component of carbon accumulation calculations [Gorham, 1991;Loisel et al., 2013;van Bellen et al., 2011] and also in developing carbon inventories and maps of carbon distribution [Beilman et al., 2008;Sheng et al., 2004;Parry and Charman, 2013]. These data are subsequently used in global climate change models [Charman et al., 2012] and to justify land management decisions [Frogbrook et al., 2009]. As a result, accurate representation of peat depth is essential in informing our understanding of peatland development and functioning. Despite this, there is often considerable lack of peat depth data at local, national, and global scales [Parry et al., 2012;Yu, 2012]. At present, two techniques are commonly applied to measure the depth of peat: (1) manual probing with metal rods, which records depth at intervals across a peatland, and (2) ground-penetrating radar (GPR), a geophysical technique which can semicontinuously image the base of peat.
Manual probing involves pushing an extendable metal pole (~ 1 cm in diameter) into the ground until the point of resistance and recording the depth and position with a global positioning system (GPS). This technique is cheap and technically very simple and consequently is favored by a number of studies. Probing has been used for many years to map peatland resources and carbon stocks in the United States and Canada [Bjelm, 1980;Worsfold et al., 1986;Buffam et al., 2010;Beilman et al., 2008] and Europe [Charman,1995;Valpola et al., 2012;Parry et al., 2012; Holden and Connolly, 2011]. Recently, probing has also been used in the exploration of tropical peatlands [Householder et al., 2012]. Moreover, manual probing is commonly used by government agencies, land owners, and nongovernmental organizations to inform management, development, and environmental designations on peatlands. For example, in Scotland, probing is a recommended technique for informing the design layout during the construction of wind farms [SEPA and Scottish Renewables, 2012]. Despite the common application of manual probing, there has been little investigation into its accuracy and it is assumed that probes consistently meet the base of peat. However,Sass et al.[2010] carried out a number of manual probe measurements in terrestrialized
PUBLICATIONS
Journal of Geophysical Research: Biogeosciences
RESEARCH ARTICLE
10.1002/2013JG002411
Key Points:
•Peat depths measured concurrently using GPR and manual probing disagree
•Error caused by probes being obstructed or extending into underlying sediments
•GPR surveys calibrated using CMP are most reliable for measuring depth
Correspondence to:
L. E. Parry, [email protected]
Citation:
Parry, L. E., L. J. West, J. Holden, and P. J. Chapman (2014), Evaluating approaches for estimating peat depth,J. Geophys. Res. Biogeosci.,119, doi:10.1002/2013JG002411.
Received 7 JUN 2013 Accepted 11 MAR 2014
Accepted article online 19 MAR 2014
mires in Austria and suggested some probes may either have become obstructed by artifacts within the peat or were extended into soft subpeat layers, such as clay. Peat profiles from different mire types can vary considerably in the vegetation they are composed of, the degree to which they are decomposed and the rate of transition to the peat mineral interface. For example, in the UK, many blanket peatlands formed by paludification and often have birch remains within the peat profile [Tallis and Switser, 1983], while peatlands in boreal regions formed by terrestrialisation may have soft lake sediments (gyttja) occurring beneath them. These features may cause peat probes to fail to meet the true peat-mineral interface or to intrude into it, thus introducing error in peat depth measurements.
GPR is a well-established geophysical technique which can be used to semicontinuously map the interface between a peat deposit and the mineral subsurface [Bjelm, 1980;Worsfold et al., 1986;Warner et al.,1990; Rosa et al.,2009;Holden et al., 2002]. GPR is a noninvasive technique and is capable of recording thousands of closely spaced data points, and consequently, GPR has been used in many studies requiring a detailed understanding of peatland morphology. For example, depth data sets derived by GPR have been used to imply processes of peat development [Comas et al., 2004, 2005b;Loisel et al., 2013] and quantify temporal change in peatland carbon accumulation [van Bellen et al., 2011]. A GPR consists of transmitting antenna which emits an electromagnetic wave (EMW) into the ground surface and a receiving antenna which detects the reflections of the EMW. Reflections are caused when dielectric permittivity (εr), which is primarily determined by moisture content, changes abruptly within the peat profile [Theimer et al., 1994]. The typically sharp contrast in moisture content at the peat to mineral interface means a strong and continuous reflection is recorded by the GPR, providing a profile of peat depth [Bjelm,1980;Warner et al., 1990;Rosa et al.,2009]. The time period between the EMW being emitted from the transmitting antenna, reflected as a result of a change inεr, and detected by the receiving antennae is known as the two way travel time (TWTT) [Neal, 2004]. The TWTT of the peat mineral interface reflection can then be converted to peat depth with the EMW velocity. A simplified form of the EMW velocity can be defined as
v¼ C0 ffiffiffiffi εr
p ; (1)
wherev= velocity (m ns 1) andC0is electromagnetic wave velocity in a vacuum (0.3 m ns 1) [Neal, 2004]. Using an accurate EMW velocity is essential if peat depth is to be recorded correctly. The EMW velocity is primarily determined byεrof the peat (see equation (1)). Saturated peat typically hasεrvalues of between 57 and 80 [Neal, 2004;Theimer et al., 1994;Slater and Reeve, 2002], and geological materials do not haveεrabove that of fresh water (82 at 5°C). Moisture content, bulk density, and degree of humification determineεrand consequently EMW velocity within peat [Comas et al., 2004;Theimer et al., 1994;Warner et al., 1990]. These physical properties have been shown spatially to be highly variable both between and within individual peatlands [Baird et al., 2008;Morris et al., 2011;Lewis et al., 2012]. Some temporal variability in velocity has also been demonstrated byComas et al.[2005a] in EMW velocity, as a result of a change in levels of free phase gas within the peat. Consequently, it is often suggested that multiple velocity calibrations are necessary tofind an accurate average GPR velocity for an individual peatland [Theimer et al., 1994;Lowry et al., 2009;Rosa et al., 2009;Parsekian et al., 2012].
Two techniques can be used to calibrate EMW velocity: (1) manual peat depth probes, where velocities are derived empirically from a probe-measured depth and EMW TWTT [Theimer et al., 1994], and (2) common midpoint (CMP) surveys, where the transmitting and receiving antennae are moved apart at set intervals and increases in TWTT are used to calculate velocity [Neal, 2004].Rosa et al.[2009] identified statistically that at least 30 manual probe measurements are needed in order to accurately account for variability found in EMW velocity for each discrete area of peatland but do not critically analyze either technique. CMP surveys are favored by some studies, includingStrack and Mierau[2010],Jol and Smith[1995], andKettridge et al.[2008], as the peat to mineral interface can be identified with a greater amount of certainty. However, typically fewer CMPs are gathered per survey than manual probe calibrations (see Table 1).
Probing is a commonly applied technique for measuring peat depth, but little consideration has been given to the accuracy of these depth measurements. As manual probing is used for both independent
probing to measure peat depths, and (3) to discuss the implications that inaccurate depth measurements may have upon the calibration of GPR surveys.
2. Study Site
Surveying for this study was carried out on a 25 ha area of Keasdon Moor, a blanket peatland in Lancashire, United Kingdom (54°02′N, 2°24′W and 340 to 400 m above mean annual sea level) in November 2011. The site is underlain by Millstone Grit, where poor drainage as a result of glacial till clay has resulted in the accumulation of blanket peat of up to seven meters in depth. This area is classified by the National Soil Research Institute as Winter Hill, a poorly humified andEriophorumsp. rich peat [Avery, 1980]. The vegetation consists predominantly of cotton grassEriophorumsp. and heatherCalluna vulgaris, with isolated areas ofSphagnumsp. Surface conditions are variable, with active artificial drainage ditches and natural gullies in the north and intact blanket peatland in the south of the site.
3. Methodology
3.1. GPR Surveying
Eight kilometers of common offset GPR data were gathered using Mala 100 MHz and 250 MHz shielded antennae. Each antenna was mounted on a wooden sled and towed at walking pace behind a low ground pressure tracked vehicle. A real-time kinematic (RTK) differential GPS (dGPS) was connected to each GPR system and used to trigger and log the position of each GPR trace at 0.25 s intervals. These data were subsequently post processed to give centimeter level accuracy. The GPR unit was set to record at a 600 ns time window, with data stacking at 16 measurements. A gridded survey design was originally planned. However, due to the rough nature of the terrain, it was not always possible to keep to the specified tracks (Figure 1). Three independent common midpoint (CMP) surveys were also carried out using a Pulse Ekko Pro system with 500 MHz antennas, each in an area of differing moisture conditions. Two antennas were moved separately out from a midpoint at 0.04m intervals; this allowed the collection of data from a reflector at an increasing offset [Jol and Smith, 1995]. Velocity can then be obtained from the basal reflector hyperbola with a least squares routine [Neal, 2004].
[image:4.612.172.576.105.322.2]GPR data were postprocessed and analyzed in REFLEX W version 6.0.5 (K. J. Sandmeier, Karlsruhe, Germany). The following processing steps were applied to the common offset survey data: a“dewow”filter to remove low frequency noise, a time-zero correction, and an automatic gain control (AGC) gain function, to ensure the peat to mineral interface was distinctly visible. The continuous picking function was used to manually select the peat mineral interface in REFLEX W. The peat to mineral interface reflector was picked at the point where
Table 1. An Overview of Published EMW Velocities Calculated for Peat and the Methodology Used to Gather Thema
Reference Mean Velocity (m ns 1) εr Number of Samples (n) Type
Rosa et al.[2009] Site one 0.040 56 110 Probes
Rosa et al.[2009] Site two 0.039 59 65 Probes
Sass et al.[2010] 0.038 62 10 CMP
Strack and Mierau[2010] 0.036 69 6 CMP
Theimer et al.[1994] 0.037 66 13 Probes
Jol and Smith[1995] 0.040 56 1 CMP
Kettridge et al.[2008] 0.035 73 3 CMP
Comas et al.[2005a] 0.041 54 3 CMP
Comas et al.[2004] 0.038 62 — CMP
Comas et al.[2005b] 0.035 73 — CMP
Comas et al.[2005c] 0.035 73 — CMP
Parsekian et al.[2012] 0.036 69 3 CMP
Kettridge et al.[2012] 0.036 69 — CMP
Loisel et al.[2013] 0.037 66 — Probes
van Bellen et al.[2011] 0.040 56 — CMP and Probes
0.046 43 —
Mean value 0.038 63
Standard deviation 0.003 8
a
A dash line indicates value not stated within the source reference.
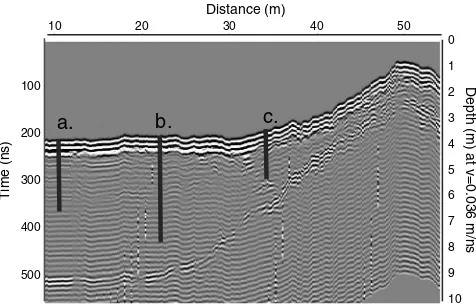
strong deviations in the waveform occurred. These points were only picked where they were supported by adjacent traces with similarly strong reflections at approximately the same TWTT (these types of reflection are evident in Figure 5). The TWTT and coordinates for these picks were then exported intoarcGIS version 10 using the RTK dGPS coordinates in WGS 1984.
3.2. Manual Probing and Coring
While the GPR survey was being carried out, 162 points were marked on the ground using surveyflags. The location of eachflag and the corresponding label were recorded using the RTK dGPS. Following the GPR survey, peat depth was measured manually at each of these points. An extendable steel probe was pushed into the peat until the point of resistance and the depth recorded. In order to account for local depth variability, three replicate depths measurements were recorded at each point, within 0.5 m of each other. Eight full profile Russian cores of differing depth were sampled in line with the GPR tracks. Each Russian core extracted took considerable effort to sample and was struck with a large mallet in order for retrieval of the full peat depth. The position of each core was logged using a Trimble GEOXH dGPS, which has a postprocessed accuracy of<10 cm. Each core was analyzed at a 5 cm resolution for loss on ignition (LOI), bulk density, and Von Post classification [Von Post, 1924].
4. Results and Discussion
4.1. Comparison of Manual Probe and GPR Depths
Each CMP survey carried out returned a hyperbolic reflection at the peat to mineral interface (Figure 2). Velocities of 0.0348, 0.0360, and 0.0372 m ns 1were returned. The mean velocity resulting from the CMPs (0.036 m ns 1,εr= 69.4) was used to calculate the corresponding GPR depth at each of the 162 manually probed depth points. A strong positive correlation was found between the GPR and manually probed depths (Figure 3), with anr2value of 0.85 significant toP<0.05. Despite this, the GPR and probed depths are not in 1:1 agreement (Figure 3). The manually probed values are on average 35% shallower than GPR derived depths. In 9% of the sampling points, the depth obtained from using a probe was over 1 m shallower than the depth derived from using the GPR (Figure 3).
Clearly, either the GPR or manual probing methodology is resulting in inaccurate depth measurements. The following sections of this paper aim to investigate the source of this error, which could result from three causes: (1) inconsistency in GPR radar picks, (2) natural variability in EMW velocity caused by varying dielectric permittivity, or (3) manual probes not consistently meeting the peat to mineral interface.
4.2. Consistency of GPR Radar Picks
In order to quantify the consistency of TWTT peat to mineral interface picks, 100 points at which the GPR tracks intersects itself (Figure 1) were identified and converted to depth using a velocity of 0.036 m ns 1. Intersecting GPR traces had a mean difference in depth of 0.11 m with a standard deviation of 0.09 m. The vertical resolution of 100 MHz GPR survey in peat is close to this value at approximately 0.1 m [seeSlater and
0 75 150 300Meters
Cores Depth probes GPR track
Elevation (m)
430
248
[image:5.612.175.401.92.393.2]N
Reeve, 2002;Theimer et al.,1994]. Consequently, much of the difference observed at the
intersecting GPR tracks is likely to be as a result of the GPR vertical resolution.
4.3. Natural Variability in Dielectric Permittivity
To calculate the error associated with using a single EMW velocity across a whole site, we applied a volumetric mixing model for soil known as the Complex Refractive Index Model (CRIM) (equation (2)) to estimate theεrfor a matrix of typical porosity and water contents:
εr bð Þ¼ θε α
r;wþð1 nÞε α
r;sþðn θÞε α r;a
1α
(2)
whereθ= volumetric soil water content,n= porosity, εr,w= dielectric permittivity of water (82 at 5°C
fromNeal[2004]),εr,s= dielectric permittivity value of dry peat (2) [value fromComas et al., 2005a], andεr,a= dielectric permittivity value of air (1). A curvefitting factor (α) accounts for the geometric arrangement of minerals and the orientation of the electricalfield [West et al., 2003].Kellner and Lundin[2001] have calibrated peatfinding a curvefitting factor (α) of 0.35, which has commonly been used in subsequent studies such asParsekian et al.[2010],Comas et al.[2005a] andStrack and Mierau[2010].
Peat has high water content and high porosity [Hobbs, 1986], typically with water contents of more than 80% [Shotbolt et al.,1998;Theimer et al.,1994], porosities of greater than 80% [e.g.Comas and Slater, 2007;Lewis et al., 2012;Theimer et al., 1994] and gas contents of less than 20% [Rosenberry et al., 2006] and these values were used to form the CRIM matrix in this study. The resultingεrwere then converted to velocity (m ns 1) using equation (1) and the percent difference from 0.036 m ns 1found (Figure 4). We found that the error introduced as a result of using a single velocity across an entire peatland may cause an underestimation in peat depth of
8% and an over estimation of 17%.
4.4. Error in Measurement Techniques
At each sampling point, it was investigated whether there was any correspondence between the quantifiable error range of manual probe and GPR depth measurements. Error associated with spatial variability in velocity (see section 4.3) and resolution and picking consistency (sections 4.2) were used as the GPR error range. In addition, sampling points with manual probing depths of less than 0.8 m were discounted in order to remove uncertainty in picking as a result of ground wave interference. The range of replicates at each sampling point was used for manual probing error. At 25% of sampling points
0.0 1.0 2.0
0
10
20
30
40
50
60
70
80
90
100
Distance (m)
Time (ns)
a.
b.
a.Air wave (0.3 m ns-1)
[image:6.612.176.374.94.359.2]b.Basal reflector (0.036 m ns-1)
Figure 2.A CMP gather demonstrating NMO basal reflector used to calculate velocity.
Figure 3.A comparison of manual probed depth and GPR
depth using a velocity of 0.036 m ns 1. Line represents 1:1
agreement. Manual probing error bars are maximum, and minimum probe depths and GPR depth error bars represent error caused by variability in GPR velocity.
[image:6.612.178.377.480.682.2]the manual probe and GPR depths did not correspond despite full consideration of quantifiable error. Consequently, a large proportion of the disagreement discussed in section 4.1 cannot be associated with known sources of GPR error or
inconsistencies in manual probing.
4.5. Velocities Calculated Using Manual Probing
If the 162 probe measurements and their corresponding TWTT are used to calculate an EMW velocity, a mean value of 0.0301 m ns 1is returned (standard deviation 0.0085 m ns 1). This mean velocity is considerably slower than velocities recorded on the same site using CMP surveys (see section 4.1) and other peatland EMW velocities reported in the literature (see Table 1).
When velocity values calculated by probes are converted toεrusing equation (1), a mean value of 99 is returned. Only 31% ofεrrecorded fall within the range typical for peats of 57–82 (see section 1). Furthermore, when only the 25% of sampling points where depth disagreement cannot be explained by error are considered (section 4.4), aεr of 114 is calculated. In addition, none of the calculatedεrvalues are typical of peat, with 10% falling below 57 (range 24–40) and 90% greater than 82 (range 92–585). Physical properties that giveεrvalues of above 82 are not possible [Neal, 2004]. Consequently, many of the velocities calculated using probes in this study cannot be caused by natural physical properties in peatlands. Conversely, when CMP velocities are converted toεrthey fall within the typicalεrrange for peat (74, 69, and 65).
4.6. Explanation for the Difference in Peat Depth Obtained by the Two Methods
The GPR survey almost continuously had a notably sharp reflection throughout each profile (for example, Figure 5). In all eight peat cores extracted, LOI values, which are representative of organic matter, were high (>85%) until the peat to mineral interface (Table 2). It is very unlikely there would be anything else within the organic blanket peat deposits which would cause a sufficient contrast in physiochemical properties across the site to result in such a strong reflection other than the peat to mineral interface. Indeed the cores did not indicate any such physical layer other than then peat to mineral interface. Consequently, it is reasonable to assume that the peat to mineral interface has not been misinterpreted.
When the GPR tracks intersected, corresponding peat to mineral interface picks from differing GPR profiles were found to be in reasonable in agreement and close to the vertical resolution of the GPR survey (Section 4.2). As a result, inconsistent radar picks can be rejected as a source of the broader disagreement between the manual probes and GPR survey. In addition, at 25% of the sampling points, spatial variability in physical properties could not explain the disagreement in depth measurements observed (see section 4.5). Hence, for these locations, natural variability in peat physical properties can also be dismissed -1
-5 to -8 -5 to 0 0 to 5 5 to 10 10 to 15 15 to 17 % difference from v= 0.036 m ns
line of 0% difference
Water content %
[image:7.612.173.406.92.258.2]Porosity %
Figure 4.Contour plot demonstrating the error in velocity (%), and consequently depth, calculated when using a standard peat velocity
of 0.036 m ns 1under varying possible water content and porosities
in peat. Dielectric permittivity was calculated using CRIM and con-verted to velocity using equation (1).
a. b. c.
Depth (m) at v=0.036 m/ns
1
2
3
4
5
6
7
8
9
10 0
Time (ns)
200
300
400
500 100
Distance (m)
[image:7.612.175.413.558.711.2]10 20 30 40 50
as a cause of disagreement. In cases such as these, where depth disagreement cannot be accounted for by quantifiable error (section 4.4), inaccurate probing remains the only explanation for disagreement. EMW velocities calculated using manual probe data and GPR TWTT are slower than would be expected in a typical peatland (see Table 1) and in many cases return nonphysicalεrvalues (section 4.5). This suggests that probes were failing to meet the mineral layer and becoming obstructed within the peat. In some cases, it is possible to identify the feature impeding the manual probe within the GPR profile (for example, Figure 5, probe c). However, the 100 MHz GPR data have a vertical resolution of ~10 cm and decreasing horizontal resolution with depth (approximately 0.23 m, 0.48 meters and 0.61 meters at depths of 1, 3 and 4 meters respectively, assuming a central frequency of 91 MHz andεrof 69 [seeNeal, 2004]).Therefore, if the diameter of features obstructing manual probes is below these resolutions, it may not be possible to identify them within the GPR radargram.
Evidence of the features obstructing manual probes was found within the Russian cores extracted from the site. Within a number of the cores, substantial pieces of wood greater than 3 cm in length were identified (Figure 6c and Table 2). These pieces of wood may have been large enough to impede a manual peat probe being inserted by hand but would not be visible on the radargram as they fell below the GPR resolution (see above). At each location where a peat core was extracted, peat depth was also measured using the manual probe (Figure 1). On 80% of occasions, the manual probe recorded was closer to thefirst occurrence of wood than the depth identified by the GPR trace (Figure 6).
A peat mass movement occurred in July 2012 on Keasden Moor which revealed a considerable amount of preserved birch within the peat mass (Figures 6a and 6b). Also, a large number of birch remains have become exposed as a result of erosion less than 500 m from the edge of the GPR survey. From this evidence, it is reasonable to assume that the large quantities of birch within the peat mass are the most likely cause of probes not achieving contact with the mineral layer. In many UK peatlands, remnants of former birch forests can be found within a peat profile [Tallis and Switser, 1983]. Moreover, many tropical peatlands are formed of woody peat [Wüst et al., 2003] which may prevent probes from meeting the peat to mineral interface. Consequently, the problem of manual probes becoming obstructed before they meet the peat to mineral interface may not be isolated to Keasden Moor.
It may also be possible that at some sites, probes can extend into the sediment beyond the peat mineral interface. For example,Rosa et al.[2009] calculated mean EMW velocities of 0.040 m ns 1and 0.039 m ns 1, with standard deviations of 0.013 m ns 1and 0.008 m ns 1, using 175 manually probed depth measurements in two boreal peatlands. When converted toεr, these values fall within the range typical for peats (Table 3). However, the large standard deviations observed indicate a number values fall outside of the typical range (Table 3). High velocities andεrvalues lower than 57 were also identified in 6% of EMW velocities calculated using manual probes and TWTT at Keasden Moor. These values may result from probes extending into the mineral sediment, rather than the unusual physical properties of the peat. Probing into sediments below the peat seems a plausible explanation considering the process of terrestrialization and resultant soft gyttja layer found under many boreal peatlands [Comas et al., 2004, 2005b;Sass et al., 2010] and the thin clay layer formed in many Millstone Grit environments [Holden et al., 2002]. The problem of determining the peat-mineral interface by probing when the sediments below the peat are soft has previously been noted byJol and Smith[1995] andSass et al.[2010].
5. Recommendations for Measuring Peat Depth
[image:8.612.40.576.103.195.2]Two major implications of our research have been identified: (1) Manual probes do not always meet the peat to mineral interface, because probes have either become obstructed by artifacts within the peat body, such Table 2. Loss on Ignition (LOI) Values for Cores Extracted in Line With the GPR Transects (see Figure 1), Demonstrating the High Organic Content of the Site
Core Mean LOI (%) LOI Standard Deviation (%) Bulk Density (g cm 3) Median Von Post Class Depth at Which Wood Is First Present (cm)
1 97 5 0.073 7.5 None
2 94 13 0.071 7.5 248
3 97 8 0.068 7.25 293
5 96 7 0.062 7.5 308
6 98 1 0.082 7.75 None
7 85 24 0.081 7.75 208
8 94 8 0.063 7.5 293
as wood, or have extended beyond the peat into the substrate, and (2) calibration of EMW velocity for GPR using manual probe depths can cause inaccuracy in the measurement of peat depth from GPR surveys. These
findings have implications for the accuracy of peatland carbon inventories, global long-term carbon accumulation estimates, and surveys of peatland resources. Consequently, it is important to discuss best practice in measuring peat depth and the circumstances in which each technique should be applied.
5.1. Manual Probing
Some surveys of peat depth and structure are extensive and occur at a landscape (greater than 10,000 ha) to national scale. In situations such as these, it is not practicable to carry out GPR surveys. As a result, manual probing must be relied upon to generate inventories of peat depth. Where manual probing is adopted, there are two protocols which could be adhered to in order to ensure that the peat to mineral interface is met. First, peat depth probes could be adapted to sample a small amount of soil at the bottom of the probe, which then could be assessed to identify the transition from peat to mineral soil. This could be rapidly carried out in thefield using methodologies such as Troel-Smith [Troel-Smith, 1955]. Second, replicate probing could be carried out at each sample point. It is suggested that probes are located at least 2–3 m apart in order to avoid large artifacts or clusters of wood (such as inParry et al.[2012]). If these protocols are carried out, it would be reasonable to assume that the depth measurements are accurate and can still be reliably used as part of peatland resource estimates.
5.2. CMPs to Determine EMW Velocity
[image:9.612.178.417.89.368.2]CMPs are considered the most accurate method for calibrating EMW velocity, as they provide a direct estimation using normal move-out hyperbola reflections from the GPR itself. However, the factors which determine EMW velocity, water content, and porosity are variable throughout individual peatlands, and as a result, the low number of CMPs typically carried out in peatland studies (Table 1) may not accurately represent the true average EMW velocity. At present, very little is understood about the degree of variability in porosity and water content both within and between peatlands [Lewis et al., 2012], and consequently, it is not possible to quantify the extent to which this is an issue. However, in order to take account of any potential variability inεracross a peatland, CMPs must be carried out across areas of varying moisture content (such as inKettridge et al.[2008]). Further work considering the number of CMPs required to accurately represent EMW
Table 3. Dielectric Permittivity Values Calculated Using Probed Velocity Values for Both This Study andRosa et al.[2009]
εr(Using Mean
Velocity)
εr(Using Lower
SD Velocity)
εr(Using Upper
SD Velocity)
Number of Probes
Rosa et al.[2009] Site 1 56 123 32 110
Rosa et al.[2009] Site 2 59 94 40 65
This study 99 192 60 162
0
100
200
300
400
500
600
Core 2 Core 3 Core 6 Core 8 Core 9
GPR peat depth Manual
probe depth First substantial
wood piece
[image:9.612.172.576.680.742.2]Depth (cm)
Figure 6.The depth of the manual probe and the measured GPR depth for
each core containing wood (see Table 2), relative to thefirst occurrence of
wood within each core. With examples of birch found with the peat at Keasden Moor: (a) large piece of birch washed out after the mass
move-ment, (b) birch root within peat profile revealed in the mass movement, and
(c) small lumps of birch within core profiles (note these took considerable
velocity variability would considerably improve understanding of GPR depth survey accuracy. This is particularly important because recent development of integrated multioffset systems may enable greater numbers of CMPs to be gathered [Gerhards et al., 2008]. In some cases, CMPs are not possible due to equipment-specific limitations, such as inseparable transmitting and receiving antennae. As a result, peat depth derived from manual probing are required for EMW calibration, and therefore, the manual probing protocols outlined above must be applied.
5.3. Problems of Single EMW Velocity Values
This study showed that using a standard velocity of 0.036 m ns 1when carrying out GPR surveys resulted in between 8 and +17% error in depth measurement (see section 4.3). At present, most GPR studies on peatlands apply a single unvarying velocity across an entire study area [for example,Warner et al.,1990;Rosa et al., 2009;Loisel et al.,2013]. Our study presents the broadest possible range of error associated with varying physical properties in peatlands. Although in a typical peatland, variability may not be as great as suggested by the modelling undertaken in our study, the water content and porosity will still be variable and will always introduce error, even if velocity has had site specific calibration. If advances are made in mapping water content and porosity, it may be possible to account for this error by applying CRIM to mapped values. This would substantially increase confidence when using GPR to map peat depth.
6. Conclusions
A number of methodologies exist for the estimation of peat depth and the calibration of GPR EMW velocity. Each methodology has strengths, such as the simplicity and low cost of manual probing and the high resolution afforded by GPR, and can be used for estimation of peatland resources, carbon storage, and rates of carbon accumulation. However, this paper has identified that an element of caution must be applied when estimating peat depth for both manual probing and GPR depth estimates. Manual peat probes may not successfully meet the peat to mineral interface and methodologies for the calibration of EMW velocity when using GPR can introduce error. We recommend that as standard practice, manual probing should be replicated and regular checks made to ensure that probing samples the peat to mineral interface, to confirm that the true peat depth has been recorded. Manual probing and/or CMP determinations are used to calculate EMW velocity in GPR surveys of peat depth. If manual probing methods are improved, as described in section 5.1, this will improve the more continuous GPR depth data collection. For CMP measurements, these should be carried out across varying moisture contents across the peatland being surveyed and the potential causes of error should be thoroughly reviewed for each individual peatland surveyed to eliminate a considerable amount of error when estimating peat depth.
References
Avery, B. W. (1980),Soil Classification for England and Wales (Higher Categories)—Technical Monograph No. 14, Soil Survey of England and
Wales, Harpenden.
Baird, A. J., P. A. Eades, and B. W. J. Surridge (2008), The hydraulic structure of a raised bog and its implications for ecohydrological modelling of bog development,Ecohydrology,1(4), 289–298.
Beilman, D. W., D. H. Vitt, J. S. Bhatti, and S. Forest (2008), Peat carbon stocks in the southern Mackenzie River Basin: Uncertainties revealed in a high-resolution case study,Global Change Biol.,14(6), 1221–1232.
Bjelm, L. (1980), Geological interpretation with subsurface interface radar in peat lands, inProceedings 6th International Peat Congress, Duluth, Minnesota, edited International Peat Society, Helsinki, pp. 7–8.
Buffam, I., S. R. Carpenter, W. Yeck, P. C. Hanson, and M. G. Turner (2010), Filling holes in regional carbon budgets: Predicting peat depth in a north temperate lake district,J. Geophys. Res.,115, G01005, doi:10.1029/2009JG001034.
Charman, D. J. (1995), Patterned fen development in northern Scotland: Hypothesis testing and comparison with ombrotrophic blanket peats,J. Quat. Sci.,10(4), 327–342.
Charman, D. J., et al. (2012), Climate-related changes in peatland carbon accumulation during the last millennium,Biogeosci. Discuss.,9(10), 14,327–14,364.
Comas, X., and L. Slater (2007), Evolution of biogenic gases in peat blocks inferred from noninvasive dielectric permittivity measurements, Water Resour. Res.,43, W05424, doi:10.1029/2006WR005562.
Comas, X., L. Slater, and A. Reeve (2004), Geophysical evidence for peat basin morphology and stratigraphic controls on vegetation observed in a Northern Peatland,J. Hydrol.,295(1–4), 173–184.
Comas, X., L. Slater, and A. Reeve (2005a), Spatial variability in biogenic gas accumulations in peat soils is revealed by ground penetrating radar (GPR),Geophys. Res. Lett.,32, L08401, doi:10.1029/2004GL022297.
Comas, X., L. Slater, and A. Reeve (2005b), Stratigraphic controls on pool formation in a domed bog inferred from ground penetrating radar (GPR),J. Hydrol.,315(1–4), 40–51.
Comas, X., L. Slater, and A. Reeve (2005c), Geophysical and hydrological evaluation of two bog complexes in a northern peatland: Implications for the distribution of biogenic gases at the basin scale,Global Biogeochem. Cycles,19, GB4023, doi:10.1029/2005GB002582. Frogbrook, Z. L., J. Bell, R. I. Bradley, C. Evans, R. M. Lark, B. Reynolds, P. Smith, and W. Towers (2009), Quantifying terrestrial carbon stocks: Examining the spatial variation in two upland areas in the UK and a comparison to mapped estimates of soil carbon,Soil Use Manage., 25(3), 320–332.
Journal of Geophysical Research: Biogeosciences
10.1002/2013JG002411
Acknowledgments
Gerhards, H., U. Wollschläger, Q. Yu, P. Schiwek, X. Pan, and K. Roth (2008), Continuous and simultaneous measurement of reflector depth and average soil-water content with multichannel ground-penetrating radar,Geophysics,73(4), J15–J23.
Gorham, E. (1991), Northern peatlands: Role in the carbon cycle and probable responses to climatic warming,Ecol. Appl.,1(2), 182–195. Hobbs, N. B. (1986), Mire morphology and the properties and behaviour of some British and foreign peats,Q. J. Eng. Geol.,19, 7–80. Holden, J., T. P. Burt, and M. Vilas (2002), Application of ground-penetrating radar to the identification of subsurface piping in blanket peat,
Earth Surf. Processes Landforms,27(3), 235–249.
Holden, N. M., and J. Connolly (2011), Estimating the carbon stock of a blanket peat region using a peat depth inference model,Catena,86(2), 75–85. Householder, J. E., J. Janovec, M. Tobler, S. Page, and O. Lähteenoja (2012), Peatlands of the Madre de Dios River of Peru: Distribution,
geomorphology, and habitat diversity,Wetlands,32(2), 359–368.
Jol, H. M., and D. G. Smith (1995), Ground penetrating radar surveys of peatlands for oilfield pipelines in Canada,J. Appl. Geophys.,34(2), 109–123.
Kellner, E., and L. Lundin (2001), Calibration of time domain reflectrometry for water content in peat soil,Nord. Hydrol.,32(4), 315–332. Kettridge, N., X. Comas, A. Baird, L. Slater, M. Strack, D. Thompson, H. Jol, and A. Binley (2008), Ecohydrologically important subsurface
structures in peatlands revealed by ground-penetrating radar and complex conductivity surveys,J. Geophys. Res.,113,G04030, doi:10.1029/2008JG000787.
Kettridge, N., A. Binley, X. Comas, N. J. Cassidy, A. J. Baird, A. Harris, J. van der Kruk, M. Strack, A. M. Milner, and J. M. Waddington (2012), Do peatland microforms move through time? Examining the developmental history of a patterned peatland using ground-penetrating radar, J. Geophys. Res.,117, G03030, doi:10.1029/2011JG001876.
Lewis, C., J. Albertson, X. Xu, and G. Kiely (2012), Spatial variability of hydraulic conductivity and bulk density along a blanket peatland hillslope,Hydrol. Processes,26, 1527–1537.
Loisel, J., Z. Yu, A. Parsekian, J. Nolan, and L. Slater (2013), Quantifying landscape morphology influence on peatland lateral expansion using ground penetrating radar (GPR) and peat core analysis,J. Geophys. Res. Biogeosci.,118, 373–384, doi:10.1002/jgrg.20029.
Lowry, C. S., D. Fratta, and M. P. Anderson (2009), Ground penetrating radar and spring formation in a groundwater dominated peat wetland, J. Hydrol.,373(1–2), 68–79.
Morris, P. J., J. M. Waddington, B. W. Benscoter, and M. R. Turetsky (2011), Conceptual frameworks in peatland ecohydrology: Looking beyond the two-layered (acrotelm–catotelm) model,Ecohydrology,4(1), 1–11.
Neal, A. (2004), Ground-penetrating radar and its use in sedimentology: Principles, problems and progress,Earth Sci. Rev.,66(3–4), 261. Parry, L. E., and D. J. Charman (2013), Modelling soil organic carbon distribution in blanket peatlands at a landscape scale,Geoderma,211–212, 75–84.
Parry, L. E., D. J. Charman, and J. P. W. Noades (2012), A method for modelling peat depth in blanket peatlands,Soil Use Manage.,28(4), 614–624.
Parsekian, A., L. Slater, X. Comas, and P. H. Glaser (2010), Variations in free-phase gases in peat landforms determined by ground-penetrating radar,J. Geophys. Res.,115, G02002, doi:10.1029/2009JG001086.
Parsekian, A., L. Slater, D. Ntarlagiannis, J. Nolan, S. D. Sebesteyen, R. K. Kolka, and P. J. Hanson (2012), Uncertainty in peat volume and soil carbon estimated using ground-penetrating radar and probing,Soil Sci. Soc. Am. J.,76, 1911–1918.
Rosa, E., M. Larocque, S. Pellerin, S. Gagne, and R. Fournier (2009), Determining the number of manual measurements required to improve peat thickness estimations by ground penetrating radar,Earth Surf. Processes Landforms,34(3), 377–383.
Rosenberry, D. O., P. H. Glaser, and D. I. Siegel (2006), The hydrology of northern peatlands as affected by biogenic gas: Current developments and research needs,Hydrol. Processes,20(17), 3601–3610.
Sass, O., A. Friedmann, G. Haselwanter, and K. F. Wetzel (2010), Investigating thickness and internal structure of alpine mires using conventional and geophysical techniques,Catena,80(3), 195–203.
SEPA, and Scottish Renewables (2012),Developments of Peatland: Guidance on the Assesment of Peat Volumes, Reuse of Excavated Peat and the Minimisation of Waste, edited by S. E. P. Agency, 23 pp., Scottish Government, Edinburgh, U. K.
Sheng, Y., L. C. Smith, G. M. MacDonald, K. V. Kremenetski, K. E. Frey, A. A. Velichko, M. Lee, D. W. Beilman, and P. Dubinin (2004), A high-resolution GIS-based inventory of the west Siberian peat carbon pool,Global Biogeochem. Cycles,18, GB3004, doi:10.1029/2003GB002190. Shotbolt, L., A. R. Anderson, and J. Townend (1998), Changes to blanket bog adjoining forest plots at Bad a′Cheo, Rumster Forest, Caithness,
Forestry,71, 311–324.
Slater, L. D., and A. Reeve (2002), Investigating peatland stratigraphy and hydrogeology using integrated electrical geophysics,Geophysics, 67(2), 365–378.
Strack, M., and T. Mierau (2010), Evaluating spatial variability of free-phase gas in peat using ground-penetrating radar and direct measurement, J. Geophys. Res.,115, G02010, doi:10.1029/2009JG001045.
Tallis, J. H., and V. R. Switser (1983), Forest and moorland in the South Pennine Uplands in the mid-Flandrian period: I. Macrofossil evidence of the former forest cover,J. Ecol.,71(2), 585–600.
Theimer, B. D., D. C. Nobes, and B. G. Warner (1994), A study of the geoelectrical properties of peatlands and their influence on ground-penetrating radar surveying,Geophys. Prospect.,42(3), 179–209.
Troel-Smith, J. (1955),Karakterisering af løse jordarter, Danmarks Geologiske Undersøgelse Series IV,3(10), 73 pp.
Valpola, S., A. Harju, T. Herranen, T. Toivonen, O. Valo, and T. Vahakuopus (2012), The peat investigations in the Geological Survey of Finland, paper presented at The 14th International Congress of the International Peat Society, Peatlands in Balence, International Peat Society, Stockholm, Sweden.
van Bellen, S., P.-L. Dallaire, M. Garneau, and Y. Bergeron (2011), Quantifying spatial and temporal Holocene carbon accumulation in ombrotrophic peatlands of the Eastmain region, Quebec, Canada,Global Biogeochem. Cycles,25, GB2016, doi:10.1029/2010GB003877. Von Post, L. (1924), Das Genetische System der Organogenen Bildugen Shwedens, inMemoires sur la nomentwe et lView the MathML source
Classification des sols, International Committe Soil Science, pp. 287–304.
Warner, B. G., D. C. Nobes, and B. D. Theimer (1990), An application of ground penetrating radar to peat stratigraphy of ellice swamp, southwestern ontario,Can. J. Earth Sci.,27(7), 932–938.
West, L. J., K. Handley, Y. Huang, and M. Pokar (2003), Radar frequency dielectric dispersion in sandstone: Implications for determination of moisture and clay content,Water Resour. Res.,39(2), 1026, doi:10.1029/2001WR000923.
Worsfold, R. D., S. K. Parashar, and T. Perrott (1986), Depth profiling of peat deposits with impulse radar,Can. Geotech. J.,23(2), 142–154. Wüst, R. A. J., R. M. Bustin, and L. M. Lavkulich (2003), New classification systems for tropical organic-rich deposits based on studies of the
Tasek Bera Basin, Malaysia,Catena,53(2), 133–163.