This is a repository copy of
Generalised Predictive Control of a 12-bus Network Using
Neutral-Point Clamped Voltage Source Converter UPFC
.
White Rose Research Online URL for this paper:
http://eprints.whiterose.ac.uk/86213/
Version: Accepted Version
Proceedings Paper:
Zhang, L, Kokkinakis, M and Chong, BVP (2014) Generalised Predictive Control of a
12-bus Network Using Neutral-Point Clamped Voltage Source Converter UPFC. In: 7th IET
International Conference on Power Electronics, Machines and Drives. PEMD 2014, 08-10
Apr 2014, Manchester, UK. IET . ISBN 978-1-84919-815-8
https://doi.org/10.1049/cp.2014.0365
[email protected] https://eprints.whiterose.ac.uk/
Reuse
Unless indicated otherwise, fulltext items are protected by copyright with all rights reserved. The copyright exception in section 29 of the Copyright, Designs and Patents Act 1988 allows the making of a single copy solely for the purpose of non-commercial research or private study within the limits of fair dealing. The publisher or other rights-holder may allow further reproduction and re-use of this version - refer to the White Rose Research Online record for this item. Where records identify the publisher as the copyright holder, users can verify any specific terms of use on the publisher’s website.
Takedown
If you consider content in White Rose Research Online to be in breach of UK law, please notify us by
Generalised Predictive Control for A 12-bus Network using A
Neutral-Point Clamped Voltage-Source-Converter UPFC
L Zhang, M Kokkinakis
,B V P Chong,
School of Electronic & Electrical Engineering, University of Leeds, Leeds LS2 9JT, UK
Keywords: Neutral-Point Clamped, Unified Power Flow
Controller (UPFC), Predictive Controller.
Abstract
The paper presents the application of a UPFC to a case study of a 12-bus high power network. The UPFC shunt converter employs 8 3-level Neutral Point Clamped (NPC) voltage source converters (VSC) and 12 single-phase three-winding phase shifting transformers (PST), generating a 48-pulse output voltage. The 3-phase H-bridge series converter shares the same dc-link with the shunt one. The novel feature of this work lies in the use of a model-based generalised predictive current control law to the shunt converter for voltage and power flow control which has shown superior performance without additional filters compared to a P+I control scheme. In addition with the phase shift and switching angle control of each NPC-VSC output voltage, the topology offers improved harmonic performance and a zero-sequence blocking transformer is used for total triplen harmonics elimination.
1 Introduction
Interconnection of electrical power networks enables efficient distribution of power generated by renewable energy sourced generators; hence is a key strategy for achieving low carbon power systems. This leads to the de-regulation of electricity markets, competition of vendors and requirements for flexible network operation with minimum losses and cost. Since the construction of new transmission lines is very expensive, a cost-effective policy would be to use the existing lines to their maximum thermal limit. Controllable network elements can be used in critical parts of a power system to control and partially reconfigure it, enhancing the dynamic stability. The key technology to maintain stable operation of interconnected systems is a class of devices known as Flexible AC Transmission Systems (FACTS). The Unified Power Flow Controller (UPFC) is such a device and is being investigated by researchers worldwide, as it is considered effective for simultaneous power flow and bus voltage control [1,2].
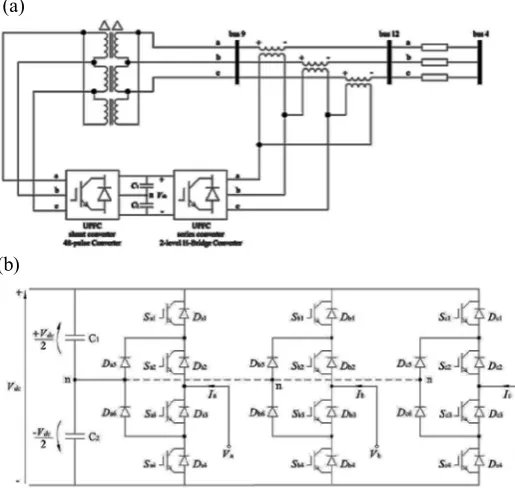
[image:2.595.306.550.208.399.2]This paper presents a 48-Pulse Multilevel VSC-based UPFC for power flow control of a 12-bus 138 kV, 100 MVA transmission network as shown in Figure 1. Figure 2(a) shows the UPFC principle structure and its installed positions in the network. The device comprises two voltage source converters connected back-to-back through a common dc-link. The series converter is inserted between buses 4 to 9
Figure 1: One-line diagram of 12-bus networkwith UPFC
(b)
Figure 2: (a) UPFC principle circuit diagram and (b) a three-phase three-level NPC-VSC Circuit.
with bus 12 in between via a transformer. The shunt converter is connected to Bus 9 of the network through a high voltage shunt transformer. Apart from providing reactive power compensation and voltage regulation, the shunt converter also
[image:2.595.305.563.428.672.2]supplies the active power to the series converter required for its power flow control as well as compensating converter conduction and switching losses.
2 The UPFC Topology
The two major aspects of a UPFC are the high power converter topology and the control schemes [3]. The key challenges for the converters are to withstand high voltage stress, with low losses and good waveform performance. In this work the shunt converter is based on the three-phase three-level neutral point clamped voltage source converters (NPC-VSC), as shown in Figure 2(b). This is constructed by extending the simple bridge inverter circuit to multiple voltage levels, with diodes constraining the maximum voltage across the power switches to safe operating levels. The switches can be controlled in a simple manner to synthesise an approximate sinusoid from the available voltage level states. For the converters to give low total harmonic distortion (THD) at reduced switching frequency, the shunt converter consists of 8 3-level NPC-VSCs using a common dc-link and 12 single-phase three-winding phase-shift transformers (PST). The PST primary windings of each phase are connected in series, summing to the corresponding voltages. With appropriate design of the phase shift introduced by the PSTs and the phase switching angle of each VSC output voltage [4,5,6], the output voltages V~a,V~b,V~c are stepped up to the grid
voltage level, and odd harmonics up to 45th order are eliminated or significantly reduced. Each NPC converter voltage contains only odd harmonics and the triplen harmonics can be eliminated from I~a,I~b,I~c by using an
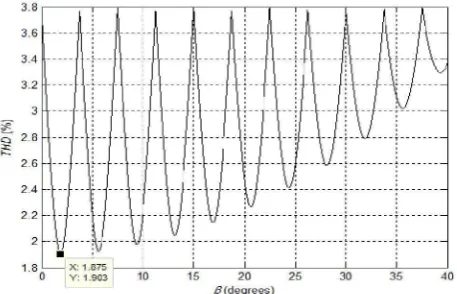
extra Δ-Δ transformer for interfacing V~a,V~b,V~c to the grid [6]. Fourier series analysis is performed and the THD of the output voltage ranges within 1.9-3.8% for variable converter switching angle β in 0o-40o (Figure 3). The power
[image:3.595.47.276.561.708.2]requirement for the series converter is in the order of tens of MVA, so a switching frequency in the low kHz range is suitable and a 2-level H-bridge converter with a sine-triangle PWM scheme is used.
Figure 3: THD of 48-pulse converter output voltage for NPC-VSC switching angle β (0o-40o).
3 The UPFC Control Principles
The twofold objectives of UPFC control in this system are to maintain bus 9 voltage at its rated value, regardless of load real and reactive power variations, and to ensure the amount of power flowing between lines 4-9 is in the correct range to avoid overloading neighbouring lines. For the system shown in Figure 1, power flow analysis [6,7] performed without the UPFC present shows that the system operation is not desirable; the bus voltage magnitudes at buses 8 and 9 voltage are less than 0.9 pu. The other bus voltage magnitudes are also reduced. There is an unbalance of real power flow between lines 8-9 (57 MW) and 4-9 (44 MW), overloading line 8-9. The use of the UPFC can control the bus 9 voltage at 1 pu while in line 4-9 power flows at 50 MW and 5MVAr, and that on line 8-9 is 50 MW and 1.146MVAr. Power flow analysis with the UPFC included shows that the shunt converter should be able to generate an output voltage of
Vsh=1.14473 pu with a capacity of Ssh=±83 MVA, and the
series converter Vse=0.18164 pu, Sse=±9.3 MVA.
3.1. The Model of UPFC
The above power values and bus voltage are then taken as the references for the current control scheme for both the series and shunt converters respectively. For the series converter, its AC three-phase voltage and current in d-q synchronous rotating reference frame (SRRF) form [6,8] are synchronised with bus 9 voltage, yielding V9d=V9m, V9q=0, hence we have real and reactive powers delivered to Bus 9 through the line expressed as
d line d line V I
P 23 9 , (1)
q line d line V I
Q 23 9 , (2)
These enable calculations of reference line currents Iline,dand
[image:3.595.300.532.566.706.2]Iline,q which will be used by the model-based current controller for series converter. The model of the transmission line between bus 9 and bus 4 according Figure 4(a) is given as
Figure 4: Series Converter
(a) One-line equivalent circuit of UPFC referred to the line voltage level
(b) Block diagrams of series converter current control
Plant ISeries,dq q
d Series I* ,
q d series
V ,
GPC
9 4
R I V
I dt d L V I R I dt d L V line series line series series line line line line (3)
Letting RRlineRseries,LLlineLseriesand writing in d-q SRRF form we have
d , 9 4 q , 9 4 , , , , 1 / / series d d series q q d line q line d line q line V V V V V V L I I L R L R I I dt d (4)
Clearly a coupling effect between d and q currents times ω is introduced. A decoupling controller can be designed if the state equation (4) is expressed as:
Bu Ax x dt
d (5)
where d , 9 4 q , 9 4 , , , / 1 0 0 / 1 , / / , series d d series q q d line q line V V V V V V u L L B L R L R A I I x
Vector u consists of both bus 9 and 4 voltages which are assumed maintained constant, Vseriesis the control variable for series current flow adjustment. In this work, we use Generalised Predictive Control (GPS) technique to estimate the d-q elements of Vseries, the only requirement for this approach is the detailed information of the elements in A and B of Equation (5).
The above principle applies equally to the controller for shunt converter. The model in this part is mainly according to the shunt transformer impedance Rshuntand Lshuntand is given as
d , 9 q , 9 , , , q , 1 / / shunt d shunt q shunt d shunt q shunt shunt shunt shunt shunt d shunt shunt V V V V L I I L R L R I I
dtd
(6)
so shunt converter voltage d-q values are
d shunt shunt q shunt shunt d shunt d q shunt shunt d shunt shunt q shunt q shunt shunt I R I L c L V I R I L c L V V V , , 9 , , 9 d , q , (7) where d shunt d shunt q shunt shunt d shunt shunt d q I I I I I I dt d c c , , * . q , * , q ,
Reference current
I
*shunt,qandI
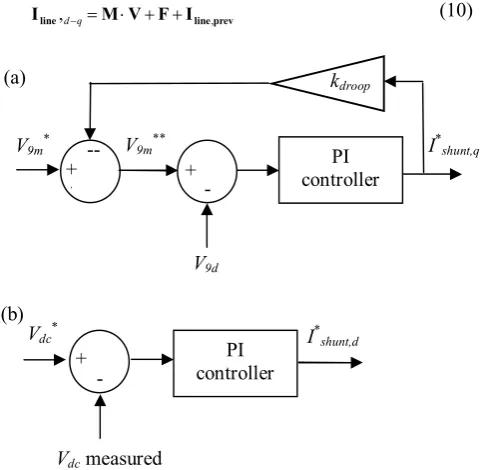
*shunt,dare determinedaccording to measured bus 9 voltage and DC-bus voltage respectively, the latter is to maintain dc-bus voltage constant. Block diagrams for their calculations are given in Figure 5 (a) and (b).
3.2. Principle of Generalised Predictive Control (GPC) Scheme
Use GPC technique for current controls of both shunt and series converters, Equation (5) can be used to predictVseries,qand Vseries,d over a number of samples steps, hence Iline,dq(t+1) can be predicted by
) ( ) ( ) ( ) ( ) 1 ( 1 ,
, t A I t B z u t t
Ilinedq linedq dq (8)
where (t) represent disturbance. This prediction can be
extended to N future current samples.
The control objective is to evaluate the optimal ud-q at time instant t, GPC minimises a quadratic cost function defined as
ˆ ( 1) ()
( 1)
) , ( 1 1 2 2
I V N j N j q d q d qd t E I t I t u t j
V
J (9)
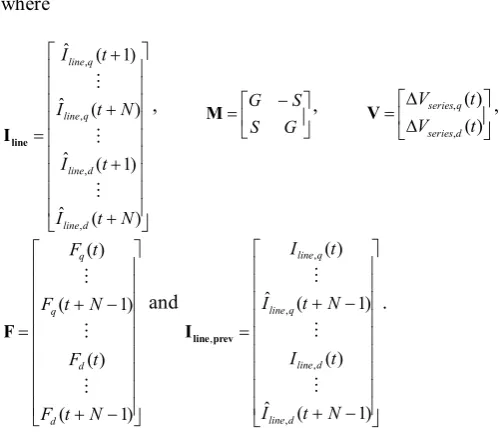
where NI and NV are respectively the current and voltage prediction horizons and we now set NI as N and NVto be1, λ is the weight factor. Thus at every sample instant t GPC predicts the currents Iline,d-q over the next NI sample intervals, using the measured current and voltage values as
prev line
line M V F I
I ,dq , (10)
Figure 5: Generation of reference signals for current controller of shunt UPFC VSC.
(a) AC bus voltage magnitude controller. (b) DC bus voltage controller.
PI controller PI kdroop (a) + + --
V9m*
Ι* shunt,d
Vdc* +
Vdcmeasured - (b)
- +
V9d
V9m**
PI controller
[image:4.595.303.544.467.702.2]where ) ( ˆ ) 1 ( ˆ ) ( ˆ ) 1 ( ˆ , , , , N t I t I N t I t I d line d line q line q line line I , G S S G
M ,
) ( ) ( , , t V t V d series q series V , ) 1 ( ) ( ) 1 ( ) ( N t F t F N t F t F d d q q F and ) 1 ( ˆ ) ( ) 1 ( ˆ ) ( , , , , , N t I t I N t I t I d line d line q line q line prev line I .
ΔV4q(t), ΔV4d(t), ΔV9q(t) and ΔV9d(t) are zero as bus 9 and 4 voltages have been considered constant. G is a parameter vector whose elements are derived from the step responses of the model while S is another vector combining G and the cross-coupling factor, ωL. The terms Fq(t) and Fd(t) account for the past responses of the line currents while
) ( ˆ and ),... 1 ( ˆ ),...., ( ˆ , ),... 1 (
ˆ , t I , t N I , t I , t N
Ilineq lineq lined lined are the
predicted current responses for the next N intervals. The setting of N depends on the length of sample interval and delay of the current response to the voltage change which is small in this example. N cannot be too large which may leads to tedious computation and unstable control whereas too small N causes GPC to have little effect on the current adjustment. ΔVseries,q(t) and ΔVseries,ed(t) are from the previously adjusted GPC control outputs and their initial values are set to zero. When all predictions of line current over the next N intervals are calculated, the optimal incremental voltage values can be estimated by applying the cost function written as
IlineIline
IlineIline
V IDV T T
J * * (11)
using formula
M M ID
M
Iline * F Iline,prev
1 , , ) ( ) (
T T
d series q series t V t
V (12)
where ID is the identity matrix. GPC then adds Equation (12) to the existing values to obtain the new control voltages.
4 Simulation Results
A MATLAB/Simulink model is developed to simulate the steady-state and dynamic responses of the power transmission system described above under UPFC control. The specification of UPFC is given in the Appendix of this paper. Only a part of results are shown in this paper. Figures 6(a) and (b) show the power flow control along bus 12 to bus 9.
The system operates under full load, when at t=0.5 sec the controlled line power references Pref and Qref ramp from 0.25
pu and 0.3 pu, respectively, to 0.5 pu and 0.1 pu at t=1 sec. Then from t=1.25 sec to t=1.5 sec, Pref and Qref ramp back to
their initial values. The reference values are taken from the
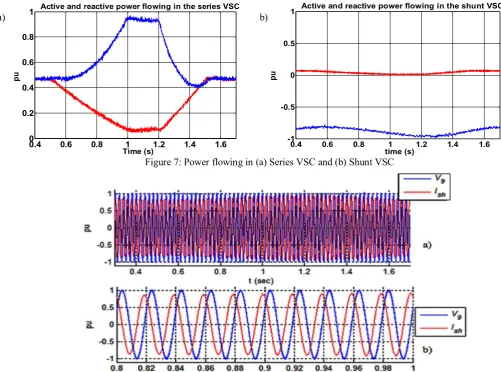
PQ controllable region of the power flow analysis. As shown in the figure, decoupled PQ line control has been achieved, with the line powers following the ramp references satisfactorily. The results from P+I control scheme show a lagging response in reactive power control [6]. Figure 7(a) show power flow in series converter. The positive reactive power generated by the series converter means that it behaves as a capacitor, reducing the effective impedance of the line. The positive real power indicate that the dc-capacitors supplies real power and is recovered from the grid by the shunt converter (P9→sh>0) as shown in Figure 7(b). In this
case the shunt converter absorbs positive real power from the grid to compensate for the power injected by the series converter to the grid and negative reactive power (capacitive mode) due to the inductive bus 9 load. The magnitudes also do not exceed 1 pu during transients. Figures 8(a) and (b) show shunt converter Phase A current variation.
0.4 0.6 0.8 1 1.2 1.4 1.6
0.2 0.3 0.4 0.5
time (s)
Active Power Flowing from Bus 12 to 9
pu
0.4 0.6 0.8 1 1.2 1.4 1.6
0 0.1 0.2 0.3 0.4 pu
Reactive power flowing from bus 12 to bus 9
[image:5.595.42.294.86.302.2]time (s)
Figure 6: Power flowing from bus 12 to bus 9 (a) Active power flow
(b) Reactive power flow (a)
0.4 0.6 0.8 1 1.2 1.4 1.6 0
0.2 0.4 0.6 0.8 1
pu
Active and reactive power flowing in the series VSC
Time (s)
4 Conclusions
The GPC control scheme has been applied to control the shunt and series converters of a UPFC for a 12-bus high power network. The results are satisfactory in that the responses of real and reactive power flows between lines 9 and 12 follow accurately according to reference values. The converter topology of NPC-VSC plus PST offers improved harmonic performance and a zero-sequence blocking transformer is used for total triplen harmonics elimination. THD of the output voltage ranges within 1.9-3.8% for switching angle β from 0o-40o.
References
[1]Acha E., Fuerte-Esquivel C.R., Ambriz-Perez H.,
Angeles-Camacho C., “FACTS, Modelling and Simulation in Power Networks”, John Wiley & Sons, 2004.
[2] Chang C.-T., Hsu Y.-Y., “Design of UPFC controllers and supplementary damping controller for power transmission control and stability enhancement of a longitudinal power system”, IEE Proceedings on Generation, Transmission
0.4 0.6 0.8 1 1.2 1.4 1.6
-1 -0.5 0 0.5 1
pu
Active and reactive power flowing in the shunt VSC
time (s)
and Distribution, Vol. 149, Iss. 4, pp. 463-471, 2002. [3] Round S.D., Yu Q., Norum L.E., Undeland T.M.,
“Performance of a Unified Power Flow Controller using a D-Q Control System”, 6th International Conference on AC and DC Power Transmission (Conf. Publ. No. 423), pp. 357-362, 1996.
[4] El-Moursi M.S., Sharaf A.M.: “Novel controllers for the 48-pulse VSC STATCOM and SSSC for voltage regulation and reactive power compensation”, IEEE Transactions on Power Systems, Vol. 20, Iss. 4, pp. 1985-1997, 2005.
[5] Saha R., Singh B.: “Improved 48-pulse static synchronous compensator for high-voltage applications”, IET Power Electronics, Vol. 3, Iss. 3, pp. 355-368, 2010.
[6]Kokkinakis M.: “Hybrid Active power controller for grid impedance variation”, Main Project, MSc in Electrical Engineering and Renewable Energy Systems, University of Leeds, 2011.
[7] Saadat H., “Power System Analysis (2nd edition)”
McGraw Hill, 2004.
[8] Schauder C., Mehta H., “Vector analysis and control of advanced static VAr compensators”, IEE Proceedings on Generation, Transmission and Distribution, Vol. 140, Iss. 4, pp. 299-306, 1993.
Figure 7: Power flowing in (a) Series VSC and (b) Shunt VSC
[image:6.595.41.543.82.454.2](a) b)
Appendix
Specifications of UPFC power circuit and control system
dc-link C1=C2=2x2500 μF, VC1=VC2=5 kV, Vdc=10 kV
Series Converter 2-level H-bridge converter, ±10 MVA, 6 kV (ac), 10 kV (dc), 2.5 kHz SPWM controlled 3 single-phase transformers: 50 Hz, 10/3 MVA, 14.5 kV (grid side) / 6 kV (converter side, in Δ),
R=0.1%, X=8%, extra series inductance of X=27.35% on 138 kV, 100 MVA base
Shunt Converter 48-pulse converter topology, ±85 MVA
8 3-level NPC converters: 7.8 kV (ac), 10 kV (dc)
4x3 single-phase three-winding PSTs: 50 Hz, 85/(4x3) MVA, R=0.1%, X=7%,
±6x3.75o: winding 1: 40/ kV, winding 2: 2x7.8x0.7014/ kV, winding 3: 2x7.8x0.4409/ kV
±2x3.75o: winding 1: 40/ kV, winding 2: 2x7.8x0.9141/ kV, winding 3: 2x7.8x0.1504/ kV
3-phase transformer: Δ-Δ, 50 Hz, 85 MVA, 157 kV/157 kV, R=0.1%, X=6%