City, University of London Institutional Repository
Citation
:
Tapper, K. (2014). Development and Preliminary Evaluation of an Internet-Based Healthy Eating Program: Randomized Controlled Trial. Journal of Medical Internet Research, 16(10), e231 - ?. doi: 10.2196/jmir.3534This is the accepted version of the paper.
This version of the publication may differ from the final published
version.
Permanent repository link:
http://openaccess.city.ac.uk/4176/Link to published version
:
http://dx.doi.org/10.2196/jmir.3534Copyright and reuse:
City Research Online aims to make research
outputs of City, University of London available to a wider audience.
Copyright and Moral Rights remain with the author(s) and/or copyright
holders. URLs from City Research Online may be freely distributed and
linked to.
City Research Online: http://openaccess.city.ac.uk/ [email protected]
Original Paper
Development and preliminary evaluation of an internet-based healthy
eating programme: A randomised controlled trial.
Katy Tapper1, Gabriela Jiga-‐Boy2, Gregory R. Maio3 Geoffrey Haddock3, Michael
Lewis4
1Department of Psychology, City University London, United Kingdom 2Department of Psychology, Swansea University, United Kingdom
3School of Psychology, Cardiff University, United Kingdom 4College of Engineering, Swansea University, United Kingdom
Corresponding Author: Katy Tapper, Department of Psychology, Social Sciences Building, City University London, Whiskin Street, London, EC1R 0JD, UK, (tel: +44 20 7040 8500; fax: +44 20 7040 8887; email: [email protected]).
Keywords: social values; diet; fruit; vegetables; saturated fat; added sugar; motivation; internet; health promotion; psychology.
Development and preliminary evaluation of an internet-based
healthy eating programme: A randomised controlled trial.
Abstract
Background: The HealthValues Healthy Eating Programme is a stand-‐alone, internet-‐based intervention that employs a novel strategy for promoting behaviour change (analysing one’s reasons for endorsing health values)
alongside other psychological principles that have been shown to influence behaviour. The programme consists of phases targeting motivation (dietary feedback and advice, analysing reasons for health values, thinking about health-‐ related desires and concerns), volition (implementation intentions with mental contrasting) and maintenance (reviewing tasks, weekly ‘tips’).
Objective: To examine the effects of the programme on consumption of fruit and vegetables, saturated fat and added sugar over a 6-‐month period.
Methods: A total of 82 females and 18 males were recruited using both online and print advertisements in the local community. They were allocated to an
intervention or control group using a stratified block randomisation protocol. The programme was designed such that participants logged onto a website every week for 24 weeks and completed health-‐related measures. Those allocated to the intervention group also completed the intervention tasks at these sessions. Additionally, all participants attended laboratory sessions at baseline, 3 months
the UK), and researchers (blind to group allocation) measured their body mass index (BMI), waist-‐to-‐hip ratio (WHR) and heart rate variability (HRV).
Results: Data were analysed using a series of ANOVA models. Per protocol
analysis (n = 92) showed a significant interaction for fruit and vegetable
consumption (P = .048); the intervention group increased their intake between baseline and 6 months (3.7 cups to 4.1 cups) relative to the control group (3.6 cups to 3.4 cups). Results also showed overall reductions in saturated fat intake, (P < .001), and added sugar intake, (P < .001), during this period (saturated fat = 20.2g to 15.6g; sugar = 44.6g to 33.9g), but there were no interactions with
group. Similarly, there were overall reductions in BMI (P = .001; BMI = 27.7 to 27.3), and WHR (P = .009; WHR = 0.82 to 0.81), but no interactions with group. The intervention did not affect alcohol consumption, physical activity, smoking or HRV. Data collected during the online sessions suggested that the changes in fruit and vegetable consumption were driven by the motivational and
maintenance phases of the programme.
Conclusions: Results suggest that the programme helped individuals to increase their consumption of fruit and vegetables and to sustain this over a 6-‐month period. The observed reduction in fat and sugar intake suggests that monitoring behaviours over time is effective, though further research would be needed to
confirm this conclusion. The web-‐based nature of the programme makes it a potentially cost-‐effective way of promoting healthy eating.
Introduction
A diet that is high in saturated fat and added sugars and low in fruit and vegetables is associated with a range of chronic diseases, including
cardiovascular disease, cancer and diabetes.[1-‐5] However, such a diet is typical for a large proportion of European and North American adults,[3,6-‐8] and
lifestyle-‐related diseases are now the leading cause of death globally.[9] Therefore dietary improvement has become a priority for many Western governments.[10]
One way of promoting a more healthy diet is via internet-‐based intervention.
This has a range of potential advantages,[11] including the ability to incorporate interactive and tailored features into a programme that is fully automated. This makes it a potentially very cost-‐effective approach. Indeed, a number of fully automated internet-‐interventions have shown positive effects on diet. For example, compared to control groups, four studies have found significant
reductions in fat intake at up to 8 months from baseline,[12-‐15] three studies have found significant increases in fruit and vegetable consumption at up to 15 months[15-‐17] and one study has found a significant reduction in added sugar intake at 4 months, though not 8 months.[15]
Social Cognitive Theory, the Theory of Reasoned Action / Planned Behaviour, and the Transtheoretical Model are frequently utilised.[18] Whilst theory is a powerful tool for effective interventions,[18] these models sometimes lack
empirical support as well as specific details about how to actually change behaviour.[19-‐21] Additionally, they do not always encompass latest research findings.
This paper describes the initial evaluation of a new, fully automated internet-‐ based healthy eating intervention: the ‘HealthValues Healthy Eating Programme’.
This programme differs from previous web interventions in its use of novel behaviour change techniques. In developing the HealthValues Programme we used a more ‘bottom up’ approach, employing a selection of distinct, brief interventions that have been shown to influence behaviour. There are a wide range of such techniques in the research literature, but these often fail to get
translated into practice. As such, the strategies we selected can be viewed as a starting point rather than a comprehensive selection.
The first strategy involved asking individuals to spend five minutes thinking about why the value of health is important or unimportant to them. There is
evidence that social values (e.g., equality, helpfulness) often lack cognitive support. In other words, although individuals believe them to be important, they have not necessarily thought about why they are important.[22] This means that they tend to behave in accordance with the value only when it is relatively easy to do so. However, asking individuals to think about the reasons underpinning
promote more value consistent behaviour.[23] Recent research has suggested that health values also lack cognitive support, to the extent that thinking about reasons for health can have a positive influence on eating behaviours.[24] Given
that this lack of cognitive support was evident across a range of social groupings, and regardless of whether individuals lead healthy or unhealthy lifestyles, it suggests that this very simple strategy may be beneficial for a large number of individuals.
The second and third strategies asked individuals to spend five minutes
considering (a) their desires and aspirations in relation to their health together with how achieving these would make them feel and (b) their concerns in relation to their health alongside how failing to avoid these would make them feel. These strategies map onto techniques commonly employed in Motivational Interviewing (MI).[25] MI aligns with the principles of Self-‐Determination
Theory (SDT)[26] and has been shown to be effective in promoting dietary change.[27] These two strategies also draw on suggestions that affective messages may result in greater behavioural change than cognitive-‐based messages[28, 29] but, consistent with MI and SDT, these strategies take a non-‐ directive approach.
The fourth strategy consists of implementation intentions with mental
contrasting. Implementation intentions are specific plans of when, where and how someone will change their behaviour. They are believed to work by (a) increasing the accessibility of the situational cue that is relevant to the target
behaviour in the presence of the situational cue.[30] There is considerable evidence that implementation intentions can help promote behaviour
change.[31,32] In the present study implementation intentions were employed
in combination with mental contrasting. Mental contrasting involves thinking about both positive outcomes following successful behaviour change as well as obstacles that might stand in the way of behaviour change.[33] Mental
contrasting with implementation intentions has been shown to reduce unhealthy snacking to a greater degree than either strategy in isolation[33] and has also been shown to increase fruit and vegetable consumption over a two year
period.[34]
In order to enhance the efficacy of the implementation intentions we also utilised evidence about moderators by including a number of other features. These were the use of an ‘If…then…’ format,[35] use of self-‐formulated, rather than assigned,
implementation intentions,[36] visualisation of the implementation
intention,[33] the formation of just one implementation intention at a time,[37, 38] emailed reminders of the implementation intention,[18] the opportunity to review and modify the implementation intention in subsequent weeks,[39,34] and a limited amount of tailored feedback aimed at promoting self-‐efficacy and
autonomy.[40]
The fifth strategy was the use of tailored dietary feedback in conjunction with standard health promotion advice.[41,42] Participants were provided with estimates of their intake of saturated fat, added sugar and fruit and vegetables,
consequences of high or low intake, and some simple strategies for adjusting one’s diet. Whilst this component of the intervention was similar to what might be contained in an intervention with a more educational approach, an awareness
of one’s own diet and how it might be improved was deemed to be a prerequisite for subsequent change.[43]
Finally, the programme also incorporated weekly ‘tips’ during the last phase. These were primarily aimed at maintaining user engagement[44] rather than promoting behaviour change per se. They were designed to be light-‐hearted and
engaging but were also evidence-‐based.
Drawing on the Model of Action Phases,[45] these strategies were divided into a motivational phase (dietary feedback, reasons for health values, health-‐related desires and aspirations, health-‐related concerns) and a volitional phase
(implementation intentions). This was followed by a maintenance phase during which participants could repeat or review previous tasks and information and could also access the ‘Tip of the Week’. We evaluated the programme over a 6-‐ month period through the use of lab-‐based measures taken at baseline, 3 months and 6 months, and via weekly online measures. The intervention group was
were also interested in examining ‘spill-‐over’ effects to other health-‐related behaviours (physical activity, alcohol consumption, smoking).[46]
Method
Sample size
Given that this study serves as an initial test of the programme, there were no comparable studies on which to base sample size calculations. That said, our
sample size was informed by our previous research that examined the effects of one of the intervention components (thinking about reasons for values) on eating behaviour over a 7-‐day period.[24] The eating behaviour measure showed a mean difference between groups of 0.92 and a standard deviation of 1.51,
meaning that at 80% power, 44 participants per group would be needed to detect a significant difference (two-‐tailed, P <.05). Assuming an attrition rate of no more than 15%,[47] we concluded that a sample size of 100 would be appropriate for this trial.
Participants
Participants were recruited using both online and print advertisements in the local community. These included posters and flyers in local shops and
community facilities, and advertisements on social media sites, email networks and in local newspapers. The advertisements stated that the study team were
address (which included a full participant information sheet) was included in the advertisement. (See Appendices 1 and 2 for study homepage and information sheet.)
As inclusion criteria, we stipulated that participants were aged 18 or over and able to comply with the study procedures (i.e., attend the laboratory
appointments and complete the weekly online sessions). Other exclusion criteria were pregnancy, being out of the country for more than 3 weeks during the study period, another household member already participating, and
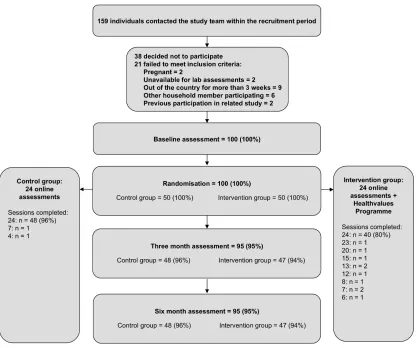
participation in a previous related study. A total of 159 individuals contacted the study team during the recruitment period. Of these, 38 decided not to take part or failed to respond to subsequent communications and 21 did not meet
inclusion criteria. Figure 1 shows the flow of participants through the study. Of the 100 participants recruited, 82 were females and 18 were males. Mean age
was 39 years and mean BMI was 27.68 kg·m-‐2. Twenty-‐three participants were
Figure 1. Flow of participants through the study.
Study design and procedure
The study received ethics approval from Swansea University Psychology
Department Ethics Committee. Informed consent was collected by researchers at the first laboratory assessment (see below). Although the study was a
randomised controlled trial design, given its exploratory nature the trial was not
[image:12.595.93.513.124.472.2]Laboratory measures were taken at baseline (February to April), 3 months (May to July) and 6 months (August to October) by GJB and a second research
assistant, both of whom were blind to group allocation. Following baseline
assessment GJB emailed KT details of each participant’s dieting status and fruit and vegetable consumption. KT then allocated participants to an intervention or control (‘monitoring’) group using a stratified block randomisation protocol on the basis of dieting status (dieting versus non-‐dieting) and fruit and vegetable consumption (5 or more portions a day versus less than 5 a day). Block size was 2 and random numbers were generated in Excel. KT then emailed the participant
details of their user ID and password and they were informed of their group allocation the first time they logged on. Although participants were not blind to group allocation they were informed that both the ‘experimental’ group and the ‘monitoring’ group would monitor eating behaviours and that this had been shown to be useful for reaching health goals. Participants in the control group
were offered the opportunity to complete the programme tasks at the end of the study.
All participants were asked, by automated email, to log onto the study website every week on 24 separate occasions to complete measures (intervention and
control group) and programme tasks (intervention group only). Each session could be accessed 6 days after completion of the previous session. Once the session became available the participant was sent an email asking them to log in to complete it. Up to three automated reminders were emailed two, four and six days later to participants who had failed to complete the session. After
thanking them and reminding them to log in again the following week. Where participants failed to login for 3 weeks GJB attempted to contact them by phone and then email to establish whether they still wanted to participate in the online
sessions and, if not, to assure them that we would still be keen for them to attend the laboratory assessments.
Each participant received £10 (approximately $17 USD) for attending the first laboratory session, £25 ($42 USD) for the second and £50 ($84 USD) for the third. Additionally they received £2 ($3 USD) per session for completing the first
ten online sessions, £2.50 ($4 USD) per session for completing the next ten online sessions and £5 ($8 USD) per session for completing the last four online sessions. Thus, participants could receive up to £150 ($253 USD) for completing all laboratory and online sessions. Money for completing the online sessions was given at the final laboratory assessment and amounts allocated were indicated in
emails sent to prompt, remind and thank participants. In a further effort to limit attrition participants received small gifts (a fabric bag and a mousemat pad) at the first and second laboratory assessments. These were branded with the ‘HealthValues’ logo.
Measures
Outcome measures
Primary outcome measures were intake of (a) saturated fat, (b) added sugar and (c) fruit and vegetables. These were assessed in a laboratory using the Block
(FFQ) adapted from a longer version that has been shown to have good
reliability and validity.[48,49] The FFQ included questions about both frequency and quantity of intake. It was developed in North America and for our purposes
adapted for use in the UK. Since the questionnaire often referred to quantities in terms of ‘cups’, participants were also given four UK measuring cups (1 cup, ½ cup, ¼ cup, 1/8 cup) to assist them with their portion estimates when
completing the questionnaire.
Secondary outcome measures were body mass index (BMI), waist-‐to-‐hip ratio
(WHR), heart rate variability (HRV), smoking status, smoking frequency, quantity of alcohol consumed, binge drinking, physical activity, dietary
behaviours and additional online assessments of saturated fat, added sugar and fruit and vegetable intake. BMI, WHR and HRV were assessed in the laboratory by trained researchers. These physiological measures provide an objective
assessment of health status.[50] For example, HRV is a surrogate measure of cardiac control via the autonomic nervous system and can be considered to be a measure of cardiac ‘fitness’. Less favourable HRV profiles are associated with hypertension, cardiovascular disease and ageing[51] whilst physical activity has a positive effect on HRV profile.[52,53] In this study we quantified HRV using the
common statistical indices SDRR (standard deviation of the beat-‐to-‐beat cardiac interval) and RMSSD (square root of the mean squared differences of successive cardiac intervals), which reflect overall HRV and short-‐term (respiratory-‐
Alcohol consumption was measured in the laboratory using a questionnaire designed to capture episodes of binge drinking as well as typical drinking behaviours.[55] It contained four items asking about frequency of consumption
and number of units consumed for both usual consumption and for days when the respondent consumed larger-‐than-‐usual quantities. The questionnaire was scored by converting frequencies to drinks per week and then multiplying frequency by number of units to obtain the number of units consumed per week from usual drinking. To compute additional units consumed from larger-‐than-‐ usual episodes, the usual number of units consumed was first subtracted from
the larger-‐than-‐usual number of units. This gave the number of additional units consumed on these occasions. This number was then multiplied by the larger-‐ than-‐usual frequency to obtain a figure for the additional number of units
consumed per week from ‘more-‐than-‐usual’ drinking. The two figures were then added together to obtain the overall number of units consumed per week. In line
with British government recommendations, binge drinking was defined as eight or more units per day for men, and six or more units per day for women.[56] Where quantities consumed for either usual consumption or larger-‐than-‐usual consumption met these criteria they were coded as an episode of binge drinking.
Smoking was assessed in the laboratory by asking participants whether they smoked cigarettes and, if yes, the number they usually smoked, either per day, per week, or per month. Scores were recorded into number smoked per week.
Physical activity was assessed online at sessions 1, 8, 12 and 24 using the short
indicated on how many days, and for how long, they had engaged in vigorous activity, moderate activity, and walking during the previous week. These scores were converted into total number of Metabolic Equivalent of Task (MET) units
expended per day.[58]
In addition to the laboratory assessments, saturated fat, added sugar and fruit and vegetable consumption were also assessed online at sessions 1, 8, 12 and 24 using a validated UK FFQ.[59] Respondents recorded the frequency with which they consumed 63 common food items over the previous month. The FFQ has
been shown to have good test-‐retest reliability,[60] as well as good convergent validity with 10-‐day weighed records[61] and with 24-‐hour dietary records.[59] The FFQ has also been shown to possess good construct validity.[62]
To compute daily intake of saturated fat and added sugar, the proportions of
these macronutrients in each of the 63 foods were calculated, based on data provided by the British Food Standards Agency.[63,64] Each participant’s daily intake of each food was then computed by multiplying frequency of consumption by average portion size. Average portion sizes were based on Bingham and Day[65] and the British Food Standards Agency.[64] Finally, the quantities of
Two additional questions were used in the calculation of fruit and vegetable consumption. These were the number of portions of fruit (excluding fruit juice), and the number of portions of vegetables (excluding potatoes, beans and lentils)
eaten on a typical day during the previous week. Examples of portions were provided. These scores were combined with scores from items relating to fruit juice and beans/lentils from the FFQ to compute daily servings of fruit and vegetables. In line with UK guidelines, juice and beans/lentils were counted as a maximum of one serving a day each.
Dietary behaviours were assessed at the start of each of the 24 online sessions using a questionnaire that was developed for the project. This consisted of 17 items associated with standard dietary advice related to consumption of
saturated fat, added sugar and fruit and vegetables (e.g., reducing the number of teaspoons of sugar added to hot drinks, cereals and desserts; replacing red meat
with white meat or fish). The items were a mix of quantitative (e.g., number of high fat snacks during the previous week) and categorical (e.g., type of milk mainly drunk). To reduce respondent burden, after the first session participants were presented with their responses from the previous session and asked to simply adjust their answers where they had made a dietary change. The
questionnaire was scored by calculating the number of positive versus negative changes made since the previous session (-‐17 to +17).
All online questionnaires were tested for usability prior to the study.
and participants needed to complete all items before progressing to the next screen. Adaptive questioning was used for the IPAQ.
Demographic measures
Details of participants’ gender, age, level of education and first language were collected at the first online session.
Additional measures
Data relating to potential mediators (habits, intentions, self-‐efficacy, anticipated
emotions), moderators (need for affect, need for cognition, behavioural approach system sensitivity, behavioural inhibition system sensitivity, environmental change), and process measures (post-‐study feedback questionnaires and telephone interviews) were also collected but these are not discussed in the present paper.
Intervention
The intervention was tested for usability prior to the study. At all sessions, intervention components were delivered after assessment measures. The
intervention components are detailed in Appendix 3. For information purposes, Appendix 1 also shows how the components relate to Michie and colleagues’ recommended taxonomy of behaviour change techniques.[66] Further details of the intervention components can be obtained from the first author.
Baseline characteristics of the two groups were compared using t-‐tests and chi-‐ square tests. Given the exploratory nature of the trial, intention-‐to-‐treat analyses were conducted on primary outcomes only. Missing data were replaced by
calculating the mean change from previous observations in the control group and adding or subtracting this figure from the previous observation relating to the missing data point. In order to examine changes in time over the 6 month period, ANOVA models, with time as an independent variable, were employed for the main analyses. Thus a series of 3 x 2 mixed ANOVA models were used to examine the effects of the intervention on lab measured intake of (a) saturated
fat, (b) added sugar and (c) fruit and vegetables. Independent variables were time (baseline, 3 months, 6 months) and group (control, intervention). There were seven outliers (defined as greater than 3.5 SDs from the mean) and the analysis was conducted both with these unchanged and by adjusting them to 3.5 SDs from the mean.
Per protocol analysis was conducted on all primary and secondary outcomes by including only those participants who completed all three laboratory
assessments as well as 12 or more of the 24 online sessions (for laboratory measures) or all 24 online sessions (for online measures). Although the samples
excluded. Fishers exact test was used to examine smoking status and Chi-‐square was used for binge drinking status.
To examine the effects of the individual intervention strategies employed in the motivational phase, change scores were calculated using the dietary behaviours questionnaire. These were computed using figures from the session in which the strategy was employed and two sessions later (e.g., change between Sessions 1 and 3, see Appendix 1 for details of strategies). Change score was then employed as the dependent variable in a 2(condition) x 4(strategy) mixed ANOVA.
Results
Baseline characteristics
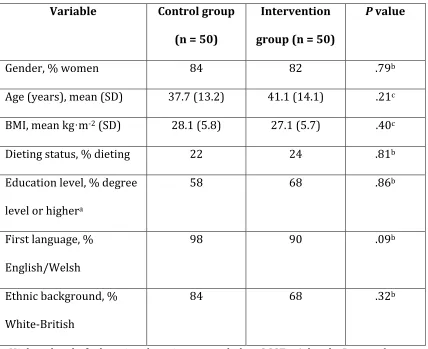
Analysis of baseline characteristics showed that the intervention and control groups were well-‐matched across a range of variables (see Table 1).
Table 1. Baseline characteristics of the intervention and control groups.
Variable Control group
(n = 50)
Intervention
group (n = 50)
P value
Gender, % women 84 82 .79b
Age (years), mean (SD) 37.7 (13.2) 41.1 (14.1) .21c
BMI, mean kg·m-‐2 (SD) 28.1 (5.8) 27.1 (5.7) .40c
Dieting status, % dieting 22 24 .81b
Education level, % degree level or highera
58 68 .86b
First language, %
English/Welsh
98 90 .09b
Ethnic background, % White-‐British
84 68 .32b
aHighest level of educational attainment coded as GCSEs, A-‐levels, Degree (or
equivalent), still studying or other.
bt-‐Test cChi-‐square
Intention to treat analyses
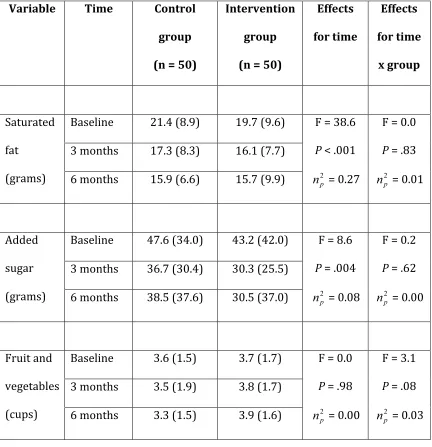
[image:22.595.85.513.139.488.2]6-‐month period, participants allocated to the intervention group did not show greater improvements than those allocated to the control group. There was no overall change in fruit and vegetable consumption over time, but a trend toward
an increase in the intervention group relative to the control group (small to medium effect size). Repeating the analyses but with outlier adjustment showed near identical results.
Table 2. Means (SDs) and results from ANOVA models for intake of (a) saturated fat, (b) added sugar and (c) fruit and vegetables at baseline, 3 months and 6 months in the intervention and control groups, for the intention to treat analysis.
Variable Time Control
group
(n = 50)
Intervention
group
(n = 50)
Effects
for time
Effects
for time
x group
Baseline 21.4 (8.9) 19.7 (9.6)
3 months 17.3 (8.3) 16.1 (7.7) Saturated
fat
(grams) 6 months 15.9 (6.6) 15.7 (9.9)
F = 38.6 P < .001
= 0.27
F = 0.0 P = .83
= 0.01
Baseline 47.6 (34.0) 43.2 (42.0)
3 months 36.7 (30.4) 30.3 (25.5) Added
sugar
(grams) 6 months 38.5 (37.6) 30.5 (37.0)
F = 8.6 P = .004
= 0.08
F = 0.2 P = .62
= 0.00
Baseline 3.6 (1.5) 3.7 (1.7)
3 months 3.5 (1.9) 3.8 (1.7) Fruit and
vegetables
(cups) 6 months 3.3 (1.5) 3.9 (1.6)
F = 0.0 P = .98
= 0.00
F = 3.1 P = .08
= 0.03
Per protocol analyses
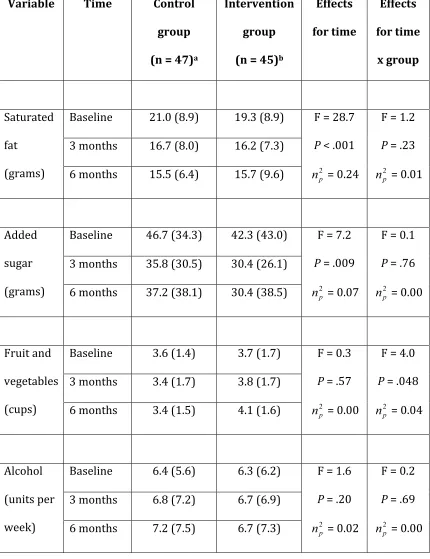
Descriptive and inferential statistics for continuous primary and secondary
[image:24.595.85.517.198.645.2]the 6-‐month period participants in both groups showed comparable declines in saturated fat intake, added sugar intake, BMI and WHR. For fruit and vegetable intake the intervention group showed significant increases relative to the control
group. Follow-‐up independent t-‐tests indicated no difference in fruit and
vegetable consumption between the intervention and control groups at baseline and 3 months, t(90) = 0.31, P = .78 and t(90) = 1.01, P = .28 respectively, but significantly greater intake in the intervention group at 6 months, t(90) = 2.30, P = .02. For the RMSSD HRV measure there was a trend toward a significant group by time interaction but no main effect of time. SDRR HRV and total alcohol intake
did not change over time and were not influenced by group status. The same pattern of results occurred when these analyses were repeated but with outliers excluded.
Table 3. Means (SDs) and results from ANOVA models for laboratory assessed primary and secondary outcomes at baseline, 3 months and 6 months in the intervention and control groups, for the per protocol analyses.
Variable Time Control
group
(n = 47)a
Intervention
group
(n = 45)b
Effects
for time
Effects
for time
x group
Baseline 21.0 (8.9) 19.3 (8.9)
3 months 16.7 (8.0) 16.2 (7.3) Saturated
fat
(grams) 6 months 15.5 (6.4) 15.7 (9.6)
F = 28.7 P < .001
= 0.24
F = 1.2 P = .23
= 0.01
Baseline 46.7 (34.3) 42.3 (43.0)
3 months 35.8 (30.5) 30.4 (26.1) Added
sugar
(grams) 6 months 37.2 (38.1) 30.4 (38.5)
F = 7.2 P = .009
= 0.07
F = 0.1 P = .76
= 0.00
Baseline 3.6 (1.4) 3.7 (1.7)
3 months 3.4 (1.7) 3.8 (1.7) Fruit and
vegetables
(cups) 6 months 3.4 (1.5) 4.1 (1.6)
F = 0.3 P = .57
= 0.00
F = 4.0 P = .048
= 0.04
Baseline 6.4 (5.6) 6.3 (6.2)
3 months 6.8 (7.2) 6.7 (6.9) Alcohol
(units per
week) 6 months 7.2 (7.5) 6.7 (7.3)
F = 1.6 P = .20
= 0.02
F = 0.2 P = .69
[image:26.595.86.516.203.762.2]Baseline 28.4 (5.8) 27.0 (5.9)
3 months 28.3 (5.9) 26.8 (5.7) BMI
(kg·m-‐2)
6 months 28.0 (5.9) 26.6 (5.9)
F = 11.2
P = .001
= 0.11
F = 0.1
P = .93
= 0.00
Baseline 0.82 (0.09) 0.82 (0.09) 3 months 0.81 (0.09) 0.82 (0.09) WHR
6 months 0.81 (0.08) 0.81 (0.08)
F = 7.2 P = .009
= 0.07
F = 0.0 P = .71
= 0.00
Baseline 45.0 (20.1) 49.6 (19.7)
3 months 46.4 (20.1) 47.8 (18.7) HRV:
SDRR
(ms) 6 months 46.1 (17.9) 43.1 (15.2)
F = 1.4
P = 0.254
= 0.02
F = 2.0 P = 0.134
= 0.02
Baseline 28.9 (14.6) 33.1 (19.6) 3 months 19.3 (15.3) 30.5 (16.3) HRV:
RMSSD
(ms) 6 months 30.2 (15.4) 25.8 (12.9)
F = 1.4
P = .243
= 0.02
F = 2.9
P = .060
= 0.03
aFor alcohol consumption n = 46 due to questionnaire completion error
bFor alcohol consumption n = 44 due to questionnaire completion error
For smoking status there were 91 participants who provided data on smoking at all three laboratory assessments and completed at least 12 of the online sessions.
= 1, P = .36; 6 months: control n = 4, experimental n = 3, P = 1.00.) Smoking frequency was not analysed due to the small number of smokers in the sample.
Analysis of binge drinking included 90 participants who provided data on alcohol consumption at all three laboratory assessments and completed at least 12 of the online sessions. Again, at each of the three time-‐points, there was no difference in the proportion of individuals who engaged in binge drinking in the experimental group compared to the control group. (Baseline: control n = 25, experimental n = 23, 2 = 0.04, P = .84; 3 months: control n = 23, experimental n
= 17, 2 = 1.18, P = .28; 6 months: control n = 20, experimental n = 17, 2 = 0.22,
P = .64.)
Descriptive and inferential statistics for secondary outcome measures collected
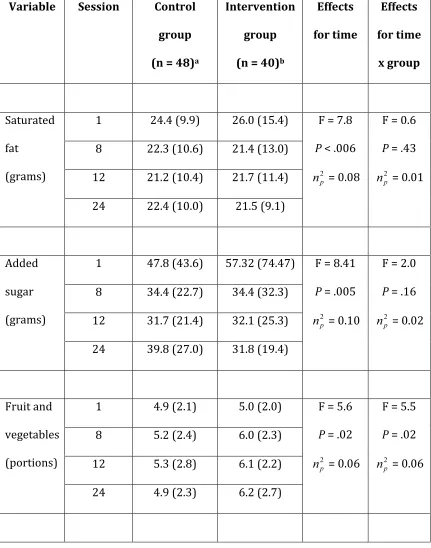
during the online sessions are shown in Table 4. Consistent with laboratory assessments these show there were significant reductions in intake of saturated fat and added sugar over time, but that the extent of these reductions did not differ between intervention and control groups. Also consistent with laboratory assessments, the results show an increase in fruit and vegetable consumption
amongst the intervention group relative to the control group. This was coupled with an overall increase in fruit and vegetable consumption over time. Follow-‐up independent t-‐tests indicated no difference in fruit and vegetable consumption between the intervention and control groups at Sessions 1, 8 and 12; t(86) = 0.19, P = .85; t(86) = 1.64, P = .11; t(86) = 1.48, P = .14 respectively, but
significantly greater intake in the intervention group at Session 24, t(86) = 2.45,
over time and no effect of the intervention on physical activity. The same pattern of results occurred when these analyses were repeated with outliers excluded.
Table 4. Means (SDs) and results from ANOVA models for secondary outcomes assessed online at sessions 1, 8, 12 and 24 in the intervention and control groups, for the per protocol analyses.
Variable Session Control
group
(n = 48)a
Intervention
group
(n = 40)b
Effects
for time
Effects
for time
x group
1 24.4 (9.9) 26.0 (15.4)
8 22.3 (10.6) 21.4 (13.0)
12 21.2 (10.4) 21.7 (11.4) Saturated
fat (grams)
24 22.4 (10.0) 21.5 (9.1)
F = 7.8 P < .006
= 0.08
F = 0.6 P = .43
= 0.01
1 47.8 (43.6) 57.32 (74.47)
8 34.4 (22.7) 34.4 (32.3)
12 31.7 (21.4) 32.1 (25.3) Added
sugar (grams)
24 39.8 (27.0) 31.8 (19.4)
F = 8.41
P = .005
= 0.10
F = 2.0
P = .16
= 0.02
1 4.9 (2.1) 5.0 (2.0)
8 5.2 (2.4) 6.0 (2.3)
12 5.3 (2.8) 6.1 (2.2) Fruit and
vegetables (portions)
24 4.9 (2.3) 6.2 (2.7)
F = 5.6
P = .02
= 0.06
F = 5.5
P = .02
= 0.06
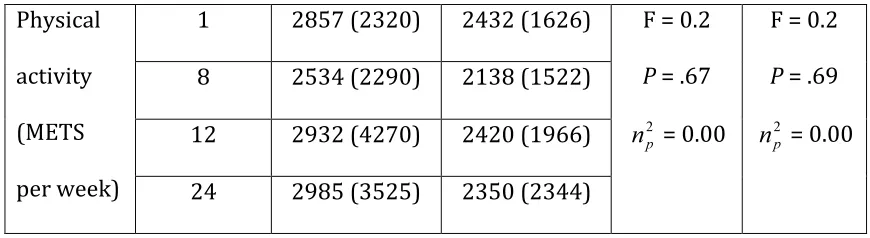
[image:30.595.85.516.200.748.2]1 2857 (2320) 2432 (1626) 8 2534 (2290) 2138 (1522)
12 2932 (4270) 2420 (1966) Physical
activity (METS
per week) 24 2985 (3525) 2350 (2344)
F = 0.2 P = .67
= 0.00
F = 0.2 P = .69
= 0.00
aFor physical activity n = 39 due to participants coding Don’t know
bFor physical activity n = 37 due to participants coding Don’t know
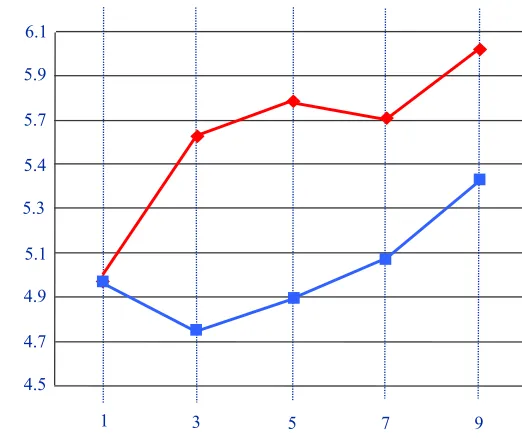
Figure 2 shows levels of fruit and vegetable consumption in the intervention and control groups at the start and end of each of the three programme phases. As
noted above, follow-‐up analyses indicated that significant differences between intervention and control groups occurred at the fourth measurement point only (i.e. Session 24, the end of the third phase, t(86) = 2.45, P = .02). These results, together with Figure 2, suggest that the most likely explanation for this effect is that it was primarily driven by the combination of motivation and maintenance
phases. However, it is also possible that the maintenance phase played no part in the changes but that the differences at Session 24 were a result of the
motivational phase continuing to exert effects over the 6 month period. Additionally, the data suggest that (in its position within the intervention) the volitional phase had no immediate impact, (though a delayed impact cannot be
[image:31.595.82.517.70.189.2]Figure 2. Portions of fruit and vegetables consumed in the intervention and control groups at the start and end of each programme phase.
Effects of individual strategies employed in the motivational phase
For analysis of motivational phase strategies, all participants who completed the first nine online sessions were included (control, n = 47; intervention, n = 46).
Because fruit and vegetable consumption was improved by the intervention, we conducted exploratory analyses examining changes in fruit and vegetable consumption in the intervention and control groups in the two-‐week period following the delivery of each of the four different programme components (see
Figure 3). There was no main effect of strategy, F(1, 91) = 0.53, P = .47, = 0.01
P ort ions of frui t a nd ve ge ta bl es pe r da y
Motivation Volition Maintenance 6.3 6.1 5.9 5.7 5.5 5.3 5.1 4.9 4.7 4.5 Intervention Control
4 8 12 16 20 24
[image:32.595.101.480.140.414.2]or condition, F(1, 91) = 0.87, P = .47, = 0.01 and no significant interaction
between strategy and condition, F(1, 91) = 2.88, P = .09, = 0.03 (though the
latter results are marginal). These results suggest that the increases in fruit and
vegetable consumption seen in the intervention group were brought about by a combination of intervention components in both the motivational and
maintenance phases. Figure 3 suggests that the strategy employed in Session 1 (tailored feedback and advice) may have been particularly useful in eliciting
change, though further research would be needed to confirm this.
Figure 3. Portions of fruit and vegetables consumed in the intervention and control groups during the motivational phase.
1 3 5 7
Session number P ort ions of frui t a nd ve ge ta bl es pe r da y 9
Intervention strategies were delivered at the following sessions:
Session 1: Feedback and advice Session 3: Values
Session 5: Desires Session 7: Concerns
[image:33.595.110.371.399.619.2]Discussion
Results of the per protocol analysis indicated that the HealthValues Healthy Eating Programme brought about significant increases in fruit and vegetable
consumption relative to a control group. These equated to approximately 0.75 cups, or 1.3 portions of the recommended 5 or more portions per day. The results also suggested that these increases were primarily brought about by strategies employed in the motivational and maintenance phases of the programme, rather than the implementation intentions employed in the
volitional phase. Thus it may be that low fruit and vegetable consumption amongst this particular group was primarily limited by motivation rather than any difficulties in implementing the behaviour; when we increased motivation, it had a direct effect on consumption.
In contrast, while the programme was associated with a decrease in saturated fat and added sugar consumption, these effects were comparable to those found in the control condition. Unlike increasing fruit and vegetable intake, which
involves introducing additional foods into the diet, reducing fat and sugar entails cutting back. As such, intake may be influenced by additional factors that may not be as amenable to motivational strategies. In particular, consumption of high fat and sugar foods may be habitual and carried out with a degree of
automaticity.[67,68] Since habits tend to be resistant to changes in attitude,[69] motivational strategies alone may be ineffective in eliciting a reduction in these
be sufficient to overcome such cravings. Thus, techniques specifically designed to target habits and cravings might usefully be incorporated into future versions of the programme.
The results did, however, show overall reductions in intake of saturated fat and added sugar amongst both groups by approximately 4.7 and 11.4 grams per day respectively. These findings are consistent with the physiological data that showed significant reductions in BMI and WHR. Given that our recruitment method targeted individuals who wanted to improve their diet, it is possible that
these changes would have occurred even in the absence of study participation. However, this seems unlikely given the general trend for weight to increase over time[71] and the fact that these data were collected over an extended (6-‐month) period. Instead, we would suggest that these changes might have been brought about by the monitoring component of the study, particularly the weekly brief
diet questionnaire that mapped directly onto dietary advice. This questionnaire may have increased participants’ knowledge of how to cut back on fat and sugar. It may also have increased attitude accessibility, the ease with which attitudes are retrieved from memory.[72] If intake of fat and sugar are determined by relatively weak habits, increased accessibility of negative attitudes toward fat
and sugar may have been sufficient to disrupt automatic behaviours. Further research would be needed to confirm this. It would also be important to control for the effects of researcher contact. In the current study it is possible that the laboratory assessments, together with the incentives, may have inadvertently led to participants trying to please the researchers. These may have in some small
The absence of effects for implementation intentions are at odds with previous non-‐internet interventions[34,73] but in line with several other internet-‐based
studies.[74-‐77] One explanation is that participants had already formed action plans in response to the monitoring component of the study, making it difficult for the implementation intentions to bring about further change. This
interpretation is consistent with other research showing implementation intentions to be less effective amongst individuals who are already good at action planning.[78] It also has implications for the development of
interventions; since longer interventions may increase rates of drop out, it is important that all strategies employed make a unique contribution to behaviour change. However, an alternative explanation is that the fruit and vegetable related implementation intentions helped sustain behaviour change.[34] A weakness of the current study is that it is unable to distinguish between these
possibilities or to identify with precision the components that are responsible for the effects. In future work it would be helpful to compare different versions of the programme to help determine which components are important and which may be redundant.
behaviours,[46] the results of this study suggest that effects are restricted to behaviours that are targeted.
In future research it would be important to trial the programme in the absence of incentives for session completion. Given the high rates of attrition in online interventions[79] we incorporated these incentives to enable a proper initial evaluation of the programme. However, a trial without these incentives would help indicate natural attrition and allow for calculations of cost-‐effectiveness.
It would also be important to examine the effects of the programme with different populations. In the current study, we recruited participants who were interested in improving their diet. Thus, they were a group who were already reasonably motivated (as indicated by a baseline mean of 4.16 on a scale of 1 to 5 on intention to eat a healthy diet). It is possible that the motivational strategies
would have been more effective amongst a less motivated group of individuals who might, for example, be accessed via workplace settings.
In conclusion, the HealthValues Healthy Eating Programme significantly increased fruit and vegetable consumption amongst users. Future research,
comparing different versions of the programme, should help to more accurately identify the elements that were responsible for this effect. It seems likely that the monitoring component of the study also brought about reductions in intake of saturated fat and added sugar, though further research would be needed to confirm this. Given that the programme is fully automated, it represents a
Acknowledgements
The research was funded by the Economic and Social Research Council. We thank Clare Clement for help with data collection, Paul Tapper for technical support, and Jennie Davies for nutritional advice.
Conflicts of interest
None declared.
References
1. Esposito K, Kastorini CM, Panagiotakos DB, Giugliana D. Prevention of type 2
diabetes by dietary patterns: a systematic review of prospective studies and meta-‐analysis. Metab Syndr Relat Disord 2010;8(6):471-‐476.
doi:10.1089/met.2010.0009
Cochrane Database Syst Rev 2012;16(5): CD002137. doi:10.1002/14651858.CD002137.pub3
3. Scarborough P, Nnoaham KE, Clarke D, Capewell S, Rayner M. Modelling the
impact of a healthy diet on cardiovascular disease and cancer mortality. J
Epidemiol Community Health 2012;66:420-‐426. doi:10.1136/jech.2010.114520 4. Greenwood DC, Threapleton DE, Evans CE, Cleghorn CL, Nykjaer, C
Woodehead C, Burley VJ. Glycemic index, glycemic load, carbohydrates, and type 2 diabetes systematic review and dose-‐response meta-‐analysis of prospective studies. Diabetes Care 2013;36(12):4166-‐4171. doi:10.2337/dc13-‐0325
5. Oyebode O, Gordon-‐Dseagu V, Walker A, Mindell JS. Fruit and vegetable consumption and all-‐cause, cancer and CVD mortality: analysis of Health Survey for England data. J Epidem Community Health. Published Online First 31 March 2014. doi:10.1136/jech-‐2013-‐203500
6. Schmidhuber J, Traill WB. The changing structure of diets in the European
Union in relation to healthy eating guidelines. Public Health Nutr 2006;9(5):584-‐ 95. doi:10.1079/PHN2005844
7. Casagrande SS, Wang Y, Anderson C, Gary TL. Have Americans increased their fruit and vegetable intake? The trends between 1988 and 2002. Am J Prev Med 2007;32(4):257–263. doi:10.1016/j.amepre.2006.12.002
8. McCabe-‐Sellers BJ, Bowman S, Stuff JE, Campagne CM, Simpson PM, Bogle ML. Assessment of the diet quality of U.S. adults in the Lower Mississippi Delta. Am J Clin Nutr 2007;86(3):697–706. PMID: 17823435
9. World Health Organisation. Global status report on noncommunicable