City, University of London Institutional Repository
Citation
:
Curran, W., Moore, T., Kulesza, T., Wong, W-K, Todorovic, S., Stumpf, S., White,
R. & Burnett, M. (2012). Towards recognizing "cool": can end users help computer vision
recognize subjective attributes of objects in images? In: C. Duarte, L. Carriço, J. A. Jorge, S.
L. Oviatt & D. Gonçalves (Eds.), Proceedings of the 2012 ACM international conference on
Intelligent User Interfaces. (pp. 285-288). New York: ACM. ISBN 978-1-4503-1048-2
This is the accepted version of the paper.
This version of the publication may differ from the final published
version.
Permanent repository link:
http://openaccess.city.ac.uk/12413/
Link to published version
:
http://dx.doi.org/10.1145/2166966.2167019
Copyright and reuse:
City Research Online aims to make research
outputs of City, University of London available to a wider audience.
Copyright and Moral Rights remain with the author(s) and/or copyright
holders. URLs from City Research Online may be freely distributed and
linked to.
City Research Online:
http://openaccess.city.ac.uk/
[email protected]
Recognizing “Cool”:
Can End Users Help Computer Vision Recognize
Subjective Attributes of Objects in Images?
ABSTRACT
Recent computer vision approaches are aimed at richer image interpretations that extend the standard recognition of objects in images (e.g., cars) to also recognize object attributes (e.g., cylindrical, has-stripes, wet). However, the more idiosyncratic and abstract the notion of an object attribute (e.g., “cool” car), the more challenging the task of attribute recognition. This paper considers whether and how end users can help vision algorithms recognize highly idiosyncratic attributes, referred to here as subjective attributes. We empirically investigated how end users recognized three subjective attributes of cars—”cool”, “cute”, and “classic”—and whether some recognition challenges might be overcome by rich forms of interaction between end users and algorithms. Our contributions include: (1) identifying the types of image properties participants use to recognize subjective attributes, (2) three different types of automated explanations of the reasoning behind an algorithm’s classification of subjective attributes, along with empirical results about the ways each type impacted users, (3) participants’ insights into how the algorithm should reason, and (4) open questions for how to develop interactive attribute recognition algorithms. Overall, the results suggest the feasibility of a richly interactive approach for helping computer vision systems successfully recognize subjective attributes of objects. Author Keywords
Computer vision, interactive machine learning, classification, human factors.
ACM Classification Keywords
H.1.2 Models and Principles: User/Machine Systems; I.4.m Image Processing and Computer Vision: Miscellaneous; I.2.6 Learning
General Terms
Design, Human Factors, Experimentation INTRODUCTION
Computer vision research on image interpretation has been primarily focused on naming objects occurring in an image.
A common approach is to use machine learning techniques on features extracted from the image (e.g., textured patches, edges, or segments) to detect occurrences of an object class of interest (e.g., cars). Recently, computer vision has also found ways to describe objects’ measurableattributes (e.g., cylindrical, has-stripes, wet) that can be quantified directly from pixel values [6, 7]. (Note that attributes of objects are different from features of images: attributes are descriptive characteristics of object appearance, such as has-stripes, whereas features are perceptually salient image parts, such as corners, T-junctions, and edges.) Algorithms that recognize measurable attributes use techniques similar to those that recognize entire objects—they identify the presence or absence of an attribute by classifying a vector of image features. The classifier learns natural variations of object attributes from training examples with the attributes annotated. Among other advantages, recognizing attributes has been shown to facilitate object recognition (e.g., recognizing that the image showing an object with the “wet” attribute helps eliminate the hypothesis that the object class is “fire”) [6].
We would like to extend such advantages by recognizing
subjective attributes. For example, given an image of a car, we would like to recognize whether the car is “cool”, “cute”, or “classic”. But how can an algorithm identify what makes a car “cool”? This problem has not yet been addressed in computer vision or human-computer interaction research.
Why Subjective Attributes are Challenging
One possibility is that subjective attributes can be expressed in terms of concrete image features, and machine learning algorithms may be able to recognize such subjective attributes. In order to express these attributes as image features, we need to understand how people reason about subjective attributes like “cool”. Then, in order for machine learning algorithms to recognize these attributes, we need to address at least three challenges to such recognition.
The first challenge is that subjective attributes may be vaguely defined in end users’ minds. End users may not be able to communicate their personalized definition of an attribute in a “language” understood by a computer vision algorithm. Vision algorithms can operate only on observable, semantically low-level image features (e.g., two image regions share a boundary) but because human visual perception is largely an unconscious process, these low-Permission to make digital or hard copies of all or part of this work for
personal or classroom use is granted without fee provided that copies are not made or distributed for profit or commercial advantage and that copies bear this notice and the full citation on the first page. To copy otherwise, or republish, to post on servers or to redistribute to lists, requires prior specific permission and/or a fee.
CHI 2012, May 5-10, 2012, Austin, TX, USA.
level image features are often meaningless to end users. Second, prior work [6, 7] has demonstrated that the accuracy of attribute recognition algorithms is critically correlated with the quality of annotated training images. Simply tagging an entire training image with an attribute name has been shown insufficient for learning the attribute, whereas richer annotations, such as placing a bounding box around an example object and tagging the region with the attribute name, can improve attribute recognition but are extremely time-consuming for humans to provide.
Third, due to the inherent variability of subjective attribute definitions, we cannot create more training data by simply pooling together annotations from a large number of people. Related work [6, 22] has shown that the performance of existing recognition approaches actually
decreases as the number of training examples of attributes labeled by different annotators increases. This degradation occurs because annotators differ to a large degree in their visual perceptions of an attribute, even though they may have a similar mental model of that attribute. These differences introduce labeling noise that we expect to be even more pronounced in the case of subjective attributes. Thus, with subjective attributes, a specific end user’s own definition of the attribute is the gold standard. This gold standard inherently limits the amount of training data available, especially when the algorithm is first deployed. Together, these issues suggest that for algorithms to recognize subjective attributes, a rich, interactive form of communication with end users—extending beyond labeled training examples—is necessary. For example, a particular end user might guide the algorithm to be able to find cool cars according to that user’s definition, supported by explanations of the algorithm’s behavior.
Research Questions
To investigate the issues we have raised in this section, we conducted an empirical study in which we asked end users to explain how to classify images of cars as “cool”, “cute”, or “classic”. We then investigated what happens when the machine provides explanations of its behavior. Our research questions were:
RQ1: What visual image properties do end users use to identify subjective attributes of objects?
RQ2: Can these visual image properties be mapped to low-level image features used by vision algorithms?
RQ3: How consistent are these visual image properties for subjective attributes across multiple users?
RQ4: How distinct are these visual image properties for different types of subjective attributes?
RQ5: Can users understand automatically generated explanations of an attribute recognition algorithm? What aspects of these explanations are most helpful to users’ understanding and ease of making corrections?
RQ6: What types of corrective feedback do end users give to explanations of an attribute recognition algorithm?
RELATED WORK
Interactive machine learning can be described as a two-stage process: the learning system presents its results (and possibly explanations) to end users, who in turn can provide corrective feedback to the learning algorithm.
Regarding the first stage, examples of explanations by the algorithm for specific decisions include why... and why not... descriptions of the agent’s reasoning [9, 11] and visual depictions of the assistant’s known correct predictions versus its known failures [21]. Previous work has found that users will change their mental models of how a learning system operates when the system makes its reasoning transparent [10], however, some explanations may only lead to poor mental models [18]. We know of no prior work on explaining vision algorithms to end users. For the second stage, researchers have explored a variety of end user feedback to machine learning systems. One of the first approaches in the computer vision domain was the Crayons system [5], which allowed software developers to interactively create training examples to train an image classifier. Another common technique is active learning [17], in which the machine learning system queries the end user to label the most informative training examples. Recently, research has begun to explore richer forms of end user feedback such as adding constraints [2, 18], manipulating classifier ensembles [20], and feature labeling [16, 4, 23]. In computer vision, Vijayanarasimhan and Grauman [24] developed an active learning framework that trades off the cost versus the informativeness of the annotation. In work that looks at classifying subjective concepts, Yew et al. [26] show that how people interact
with YouTube videos can give clues as to whether a video is funny or not, but their approach focuses on classification based on social interactions, which is a different task from attribute recognition based on the content of an image or video.
Although these works provide valuable insights for both stages, none of them investigate the possibility of applying this sort of two-stage interactive process to attribute recognition.
STUDY SET-UP
To investigate the viability of interactive computer vision algorithms for recognizing subjective attributes, we conducted an empirical study in which participants explained how they reasoned about “cool”, “cute”, and “classic” subjective attributes of cars in images.
Participants and Procedures
We recruited 12 participants (7 males and 5 females) from the local community. These participants had little or no programming experience, no machine learning experience, and none were computer science majors. Participants were compensated $20 for their time.
asked to describe prominent areas that stand out in a car by verbalizing their thoughts and marking up the areas on a printed image. Participants practiced this skill, and then the main study began.
The main study consisted of two parts. During the first part, participants’ task was to describe which visual properties make (or do not make) a car “cool”, “cute”, or “classic” from a set of 15 car images. Participants were asked to perform the task only on images that sparked their interest, so as to avoid forced classifications. This task lasted 20 minutes, which we observed to be suitable in our pilot runs. During the second part of the study, participants’ task was to review 12 images (a subset of images from part one), which now included explanations of the algorithm’s subjective attribute classification from a labeled image set. We randomized the order of images as well as the three explanation types (described shortly) that were shown to each participant. Participants had 15 minutes to provide feedback in any way they believed would assist the machine in its decision-making. After this, we administered questionnaires probing participants’ subjective assessments of the explanations.
We video-recorded all sessions, and transcribed the participants’ verbalizations and image mark-ups for detailed analysis.
The Images
We obtained 67 images of cars from the PASCAL 2010 database [14], a well-known collection of images for object recognition. From these we selected a subset of images in which an entire car was in the center of the image and the image contained few background objects (e.g., pedestrians). Three researchers manually classified these as “cool”, “cute”, or “classic”. We used the majority’s decision to resolve any disagreements. In total, we selected 15 images, four for each subjective attribute, and three that did not clearly represent the subjective attributes. We used all 15 for part one of the study, and the 12 that had been agreed upon to be “cool”, “cute”, or “classic” for part two.
The Algorithm
We used a Conditional Random Field (CRF) [19] to recognize attributes in these images. CRFs are one of the most popular probabilistic graphical models for representing images and efficiently capture important visual cues for image interpretation. When applied to images, the CRF represents an image as an undirected graph, where each node corresponds to an image region and each edge between two nodes indicates that they are spatially adjacent. At the core of a CRF is a weighted sum of image features. CRFs used for computer vision problems commonly use features derived from the appearance properties of individual image regions (e.g., it knows each region’s color) and features derived from pairs of regions (e.g., a feature that is true if two regions are neighbors). We first segmented each image into regions and used these
regions to compute the image features. We used the state-of-the-art gPb-OWT-UCM algorithm [1] to segment images. For each image region we computed four types of descriptors (vectors that describe appearance properties of an image region) commonly used in vision: (1) a SIFT vector [12], (2) a histogram of Oriented Gradients (HOG) [3], (3) a color histogram counting the number of pixels within the region that had a specific color, and (4) a region shape descriptor which included the region area normalized with respect to the image size and parameters of the best-fitted ellipse to the region. All values in each descriptor were normalized to fall in the interval [0,1].
The computed descriptors of image regions were used to define a set of visual dictionary words (i.e., a set of exemplary descriptors) and were then mapped to the best matching dictionary word. This quantization of the descriptors typically improves performance of recognition algorithms. To compute the dictionary, we used K-means to cluster the descriptors. We then converted each descriptor into a dictionary word based on that descriptor’s cluster assignment. As a result, each image region was described using a binary feature vector indicating the presence or absence of the dictionary words within the region.
Along with these descriptors of individual image regions, we developed a descriptor of pairs of regions. This binary descriptor consisted of an element indicating if two regions were adjacent, and a second element indicating if one region was an embedded subregion of the other.
Our CRF implementation learned weights for features comprising image region descriptors, as well as the descriptors for relationships between regions. We used the MALLET toolkit [13] for both CRF training and inference. To create a training set for our CRF, a single researcher from our group labeled 67 images (15 “cool”, 15 “cute”, 15 “classic”, and 22 “none of the above”).
The Explanations
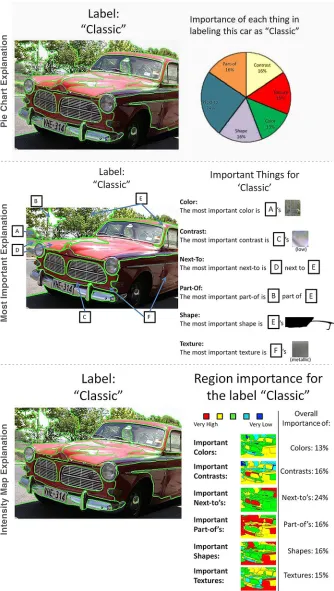
We developed three styles of explanations about how the attribute recognition algorithm reasoned: Pie explanations, WithinFeature explanations, and Map explanations. Since the algorithm’s choices are based on the weights that it assigns to each region’s features, each explanation type aimed to explain which weights were most influential. The Pie explanations (Figure 1, top) described feature weights on the scale of the entire picture by adding together the weights of each image region for each feature type and normalizing by the total sum of the weights. The pie chart in the explanation showed the distribution of the total weights among the six feature types.
The Map explanations (Figure 1, bottom) showed the relative importance
of each feature type in each region as well as the distribution of the total weights by feature type. The weights of each feature type in a region were normalized across the total weight of features in the region, and then assigned a color value based on their magnitude. Each region showed this color to illustrate the overall contribution for each feature type.
Each explanation also showed the CRF’s subjective attribute classification and the segmented image. Finally, as Figure 1 illustrates, we translated technical vocabulary for image descriptors to common parlance: SIFT features were “textures”, HOG descriptors were “contrast”, color histograms were simply “colors”, shape descriptors were “shapes”, the adjacency relationship was “next-to”, and the embedded subregion relationship was “part-of”.
RESULTS
Which Visual Image Properties Matter to End Users?
Subjective attributes rely on tacit knowledge [15], so it could be difficult for end users to precisely describe them as concrete visual properties [22]. We thus investigated how end users described the “cool”, “cute”, and “classic” subjective attributes, with particular attention to the concrete visual properties they discussed.
We used a fine-grained code set to characterize participants’ feedback about “cool”, “cute”, and “classic” cars. The codes were words we extracted directly from the participant transcripts from part one of the study. Each code represents a visual property that the coders believed expressed a low-level image feature. We coded feedback as
part-property when the focus was on a specific car part, or simply property
when the participants’ feedback was about the entire car. Table 1 shows samples from one participant’s transcript alongside the codes we applied.
The primary purpose of this code set
Pi
e
C
ha
rt E
xp
la
na
tio
n
M
os
t I
m
po
rta
nt E
xp
la
na
tio
n
In
te
ns
ity
M
ap
E
xp
la
na
tio
[image:5.612.227.561.60.651.2]n
was to group synonyms together. Thus, if a participant described a car’s headlights as “not built in” (Table 1), we applied the code “headlight-external”. Two researchers iteratively built a list of such codes, refining the set to include each part and property participants discussed. The final code set had 37 codes for parts, 99 codes for properties of these parts, and 229 unique part-property combinations. To validate our code set’s reliability, the two researchers independently coded 187 transcript samples (representing 40% of the total number of transcript samples). We computed reliability using the Jaccard index, where the number of agreeing codes (size of the intersection) was divided by the total number of applied codes (size of the union). Part codes and property codes were treated independently. For example, if Researcher 1 coded a segment as “headlight-round” while Researcher 2 coded the same segment as “headlight-external”, agreement would be 1/3 because “headlight” agreed but “round” and “external” did not. The two researchers achieved a reliability of 80% over their 187 transcript samples. Despite the large number of codes, high reliability was achieved relatively easily as the code set functioned as a look-up dictionary for part and property synonyms. Given this acceptable level of reliability, one researcher independently coded the remaining transcripts.
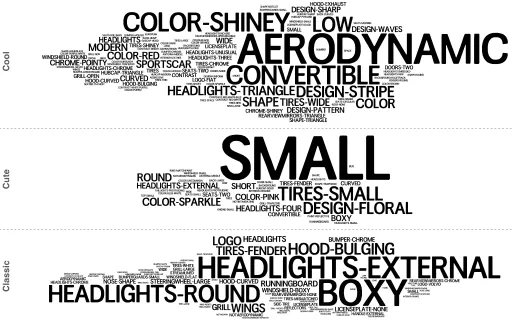
Figure 2 shows how often each code occurred in participants’ explanations about why a car was “cool”, “cute”, or “classic”. The size of each code represents its popularity across all participants, i.e., between-participant consistency. (We did not analyze within-participant consistency because participants almost never explained the same things twice; for example, once they explained to us that aerodynamics were important to “coolness”, they did not bother to explain it again.) As the figure shows, participants consistently used certain visual properties of each subjective attribute; for example, note how the property Small dominates the “cute” attribute. The most
common descriptions applied to the entire car (e.g.,
Aerodynamic or Boxy), rather than part of a car, suggesting that participants focused on the whole gestalt before examining individual sub-objects.
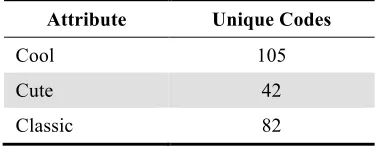
Participants used a wide range of properties to explain subjective attributes, and as Figure 2 illustrates, the amount of variety was different for each attribute. As Table 2 shows, participants used nearly three times as many image properties to describe “coolness” as they did for “cuteness”. The degree of dominance also differed (e.g., Small was more dominant for “cute” than Aerodynamic was for “cool”). Perhaps most important, participants’ descriptions included very different properties for these three attributes. Figure 3 shows how little overlap existed between the properties participants discussed for each attribute. Only six codes (2.5% of the total) were shared among all three attributes.
[image:6.612.78.266.618.691.2]Implications for Attribute Recognition Algorithms Figure 2 shows that the most common codes participants discussed involved shapes, sizes, and textures—all of which can be expressed using the types of low-level image features commonly used in computer vision. For example, “boxy” can be captured by shape descriptors, and “color-shiny” can be identified in the image as specularities, i.e., non-Lambertian surfaces. The participants’ codes referring to car parts, such as “tires”, can also be readily detected in images using off-the-shelf part detectors available in open-source computer vision libraries. A compound code such as “headlights-round” can be detected using a combination of part and shape detectors.
An interesting code for “cool” pointed out by most participants was “aerodynamic”, which can be interpreted as a simpler object attribute that participants used to define the more complex attribute “cool”. This suggests a hierarchical approach where recognition of simpler attributes (e.g., [6, 7]) could be used for reasoning about more complex attributes. New theoretical formulations, however, are needed to design algorithms for recognizing a hierarchy of attributes.
The diffuse yet distinct nature of these subjective attributes has significant implications for attribute recognition algorithms. On one hand, the lack of overlap between the codes, as well as the presence of a core set of primary image properties, suggest that computers can learn the main concept of the subjective attribute. On the other hand, while
Attribute Example Code
Cool Mostly it’s very aerodynamic, it’s very cool in design Aerodynamic
Cute Cute ones are usually smaller. Small
Classic Um, I guess if they’re not built in and they’re really round shape so I would
actually label [participant circles the headlights on image] classic. Headlights-Round, Headlights-External
Table 1: Three examples of how one participant’s feedback was coded.
Attribute Unique Codes
Cool 105
Cute 42
Classic 82
the primary properties can be identified as the amount of training data grows, identifying the more subtle secondary image properties that define the attribute for a specific user is more challenging. This diffuse set of properties is much larger than the personalized definition of the subjective attribute employed by a specific user, and thus using a group of secondary properties collected from all the participants introduces more noise and makes the concept harder to learn. We believe that a better alternative to learning the subjective attribute is to employ a richer form of interaction between the specific user and the learning algorithm, in which the user points out these secondary properties.
Taken together, our results strongly suggest that
participants’ descriptions of subjective attributes may be of real use to computer vision algorithms. Participants generally agreed with one another on the core properties about what made a car “cool”, “cute”, or “classic”, with little overlap between these attributes, and in terms that vision algorithms could readily leverage.
User Reactions to Explanations
Participants’ understanding of explanations matters— explanations form part of the basis on which users build their mental models of an intelligent system’s reasoning and influence how they respond to problems [8, 21]. Understandable and trusted explanations are therefore a necessary requirement for eliciting useful corrective feedback from end users.
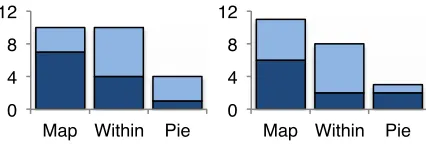
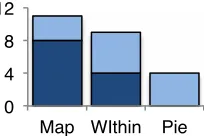
We thus asked participants to rank the explanation types’ understandability from best (1) to worst (3). We also asked them to use the same scale to rank how well they liked each explanation type. The results are shown in Figure 4. As the left graph shows, most participants ranked Map as the most understandable type of explanation:
“I liked [Map] because it was easy to identify the areas and separated importance in the picture and overall importance.”
Cool
Cu
te
C
la
ss
[image:7.612.56.569.67.392.2]ic
Figure 2: Tag clouds showing the frequency of participants’ feedback for the subjective attributes “Cool” (Top), “Cute” (Middle) and “Classic” (Bottom)
Figure 3: Total number of distinct codes participants used to describe each subjective attribute. For example, participants’ words produced 87 unique codes for cars they thought were
“cool” that never arose for “cute” or “classic” cars.
Cute!
87!
52!
18! 8!
13! 9! 6
Cool!
[image:7.612.53.296.577.685.2]Many participants also rated WithinFeature’s understandability fairly highly:
“[WithinFeature] at least gave me an idea of what the program was identifying as being important, so this let me understand what I would change in the program sometimes.”
However, the Pie explanations were ranked the worst by most participants:
“Very hard to understand/grasp how the percentages were important. Took time to get what next-to was all about.”
Participants’ preference rankings (Figure 4, right graph) were similar to their understandability rankings, suggesting that understandability was an important factor of how well they liked each explanation type. Participants who preferred the WithinFeature explanation praised its clarity and simplicity:
“I liked [WithinFeature] because it was clear to me what the computer was looking at.”
“[WithinFeature was] much easier to understand.”
Participants who preferred the Map explanations, conversely, enjoyed both the fine detail it presented, as well as the manner in which it situated the explanations in the image itself:
“[Map] had a lot of information embedded in it, and having each picture on the side was useful in determining what the program was identifying.”
Many participants, however, were frustrated by the lack of detail available in the Pie explanations:
“[Pie] doesn't help me at all. It just says ‘here are the things I [the system] find important’—[but] not where I’m finding what's important.”
Interestingly, although the underlying algorithm was exactly the same for all three explanations, participants’ trust in the explanations’ correctness differed (Figure 5). Further, their satisfaction with explanation correctness did not align with their explanation preferences or
understanding. Participants’ opinions were polarized for the Map explanations, though they had ranked it highly for understanding and preference. For correctness, half of the
participants said they were very satisfied with it, while half reported strong dissatisfaction with this explanation’s correctness.
One possible reason for these ratings may be that more information in the explanations led to less participant trust in the correctness of the underlying reasoning:
“This is very enlightening—actually it is kind of a shattering of what I was seeing before, because I totally thought it was analyzing the car. But here it is giving all this proof that it is not the car itself. I don't know how I feel about that.”
Thus, on one hand, with more information, users have the ability to be better informed, which may lead to higher levels of trust in the computer’s reasoning. On the other hand, more information may help expose nuances of the algorithm’s reasoning with which users do not agree— which may decrease users’ trust—but provide better opportunities for users to fix the algorithm.
How Users Wanted to Fix the Algorithm
When ranking how easy each explanation was to fix (Figure 6), participants’ rankings were similar to their rankings of preference and understanding, with Map ranking first and Pie third. However, participants’ actual corrections numbered far more for Pie and WithinFeature than they did for Map explanations (Table 3, rightmost column)—the exact opposite of how they ranked ease of fixing. One interpretation is that the explanations they ranked harder to fix may have required far more corrections to communicate the desired correction.
The kindsof corrections participants made also differed by explanation type (Table 3). Using the Pie explanations, participants focused mostly on feature type importance, but when using the WithinFeature explanations, participants focused mostly on segment importance. For the Map explanations, participants gave roughly the same number of corrections on feature type as for segment importance. This may be explained by the fact that the Map explanations combined the information content of the Pie and WithinFeature explanations.
These findings suggest that if an algorithm has a low confidence in some of its predictions or is continually told by the user that its predictions are wrong, it could leverage the different explanation types to elicit more useful corrections. For example, if the algorithm needs more information on what feature type is important, it could show users the Pie explanation. Conversely, if the algorithm needs more information on specific regions, it could show users the WithinFeature explanation. In this way, the algorithm could dynamically change which explanations it displays based on what it needs to know.
Feature Type Importance
[image:8.612.67.280.61.134.2]One common way participants made corrections to the algorithm was by adjusting the importance of feature types; Figure 4: Number of participants who ranked each
explanation type as the best (dark) or second-best (light), out of 3 rankings. (Left:) How well they understood it.
(Right:) How well they liked it. 0!
4! 8! 12!
Map! Within! Pie! 0!
4! 8! 12!
48% of their corrections involved raising or lowering the importance of a feature type for a particular classification. For example, participants wanted to tell the computer to ignore color and pay more attention to detected shapes:
“I don't think you can really classify ‘color’ at all as ‘classic’.”
“Well I think that the ‘cool’ factor has a lot to do with ‘shape’”
Participants often agreed with one another about how important they felt each type of feature should be (e.g., shapes are very important, colors are not). However, there was very little agreement between the algorithm and the participants—the feature types people wanted the computer to pay the most attention to rarely aligned with the things it
actually considered most discriminative.
These types of corrections could be incorporated into the learning algorithm relatively easily—users could interactively modify the weights associated with each feature type, or rank certain feature types ahead of others. However, weight corrections by users may need to be treated with caution by vision algorithms. Participants’ corrections of feature type importance appeared to be inversely related to their understanding of a feature type (Figure 7). Critically, the feature types participants most often misunderstood and felt were unimportant (“next-to” and “part-of”) were the same feature types the vision algorithm most depended upon for its classifications. Blindly incorporating such user feedback would greatly harm the classifier, and resulting problems may discourage
end users from providing any further corrections. Segmentation
48% of the corrections participants made related to the regions in an image, exactly the same percentage as for feature type importance. Users often wanted to tell the algorithm that it should focus on a different image segment, especially for “next-to” or “part-of” features. For example:
“So because it's on a lawn, no, not really for cool cars. Maybe for next-to would be like…Maybe like this teardrop shape next to the square hood.”
Participants also commented on the poor segmentation of the image into regions and provided corrections by marking the region boundaries. Interactive image segmentation is an active area of research (e.g., [25]), but work in this area treats segmentation as a stand-alone task performed during image pre-processing. In contrast, our results suggest that end users may want to alter the segmentation in real-time. However, creating a system that accepts end user feedback while seamlessly integrating segmentation with attribute recognition is currently so computationally expensive as to prevent the system from responding interactively.
New Features
The subjective attributes we explored could largely be expressed by the types of features commonly used by vision algorithms. Although it was not common for participants to correct the computer by introducing new features not mentioned in the explanations, the few features they did
introduce could be very valuable for attribute recognition. Half of these new features concentrated on size and ratios. This makes sense, as throughout parts 1 and 2 of the experiment, every participant noted how important size was in their decision-making (e.g., small size suggested cuteness). Four participants developed the concept of ratio, and one participant went so far as to hypothesize how a computer could determine a car’s size from a single image:
[image:9.612.55.349.65.175.2]“I think maybe some sort of ratio, like an algorithm or something determining how, like the ratio of how like far away the wheels are compared to the height so when you see wheels that, they look far away from each other but it's not necessarily because they are but it's because
Figure 5: Participants’ satisfaction (Likert scale) with explanation correctness. (Dark): Number of participants who
were satisfied to very satisfied; (light): neutral; and (white): dissatisfied to very dissatisfied with explanation correctness.
0! 4! 8! 12!
[image:9.612.129.233.599.669.2]Map! Within! Pie!
Figure 6: Number of participants who ranked each explanation type as the best (dark) or second-best (light)
for ease of giving feedback. 0!
4! 8! 12!
Map! WIthin! Pie!
Explanation Feature Type Importance
Segment
Importance features Total New
Pie 171 37 8 216
WithinFeature 24 148 7 179
Map 54 66 5 125
[image:9.612.390.492.608.676.2]Total 249 251 20 520
Table 3: The kinds of corrections participants made. Both the total numbers of corrections (right column) and types of corrections (middle
the car might be lower.”
Since our algorithm already extracts image regions as basic features and measures the shape convexity of each region, it would be trivial to also compute relative sizes and length/width ratios of image regions. These ratios could be turned into features and readily added to the existing pool of features used by the attribute recognition algorithm. DISCUSSION
These results suggest four open issues for interactive computer vision algorithms.
First, our study revealed that participants viewed the shape of cars as the most prominent property defining “cool”, “cute”, and “classic”. For example, Figure 2 clearly indicates that shape properties such as “round”, “boxy”, and “aerodynamic” were far more relevant for recognition of the three car attributes than a car’s material or color. This raises an open question regarding the relative importance of visual properties (shape versus color and texture)—a fundamental and as yet unanswered question for computer vision algorithms.
A second open question is exactly how to integrate user feedback into computer vision algorithms. In our study, the majority of participants’ corrective feedback involved changing the importance of a feature for attribute recognition. In text classification, feature labeling [4, 16, 23] allows users to explain to the algorithm which features are indicative of certain class labels. This approach could be extended beyond the domain of text classification, allowing end users to change the importance of features for attribute recognition. However, since end users cannot easily convert visual properties directly to low-level image features, we also need to develop a user interface to facilitate this process. Furthermore, this interface will need to account for labeling features that participants do not intuitively understand, such as “next-to” and “part-of”. These features are important to vision algorithms, but participants expressed difficulty understanding them and, as a result, often downgraded their importance.
A third question is how users’ mental models of the vision algorithm impacts the corrective feedback they provide. We suspect that users possessing sound structural models of the algorithm’s reasoning process will be able to provide more
useful feedback than users with little understanding of the algorithm. However, researchers have yet to explore how to support end users in building sound mental models for vision algorithms. Our study’s results suggest that users may encounter barriers in understanding vision algorithms and providing corrective feedback based on the flawed mental models they intuitively develop.
Finally, this study suggests that the properties participants use to describe subjective attributes might extend to a wide variety of objects. For example, the property “Small” may apply equally to cute cars and cute cats. When asked whether they thought the “cool”, “cute”, and “classic” properties identified in cars could be applied to other objects, most participants said the properties were independent of the object itself:
“I think so. I think the same criteria in general can be followed for bikes or clothes, tables, chairs, etc.”
This result suggests new theoretical developments in computer vision. Existing computer vision approaches treat attributes as tightly related to specific objects, and thus tie object recognition to attribute recognition. Our study suggests it might be possible to develop more general algorithms for recognizing attributes that transcend individual objects (e.g., an algorithm that recognizes “cuteness” regardless of whether the image shows cars or cats or cartoon characters).
CONCLUSION
This study is the first to consider interactive recognition of subjective attributes of images and to investigate explanations of vision algorithms. Our study illustrates the feasibility of helping end users teach computer vision systems how to detect these subjective attributes.
Our results revealed that study participants consistently relied upon shapes, sizes, and textures to describe subjective attributes (RQ1). These image properties can be readily mapped to low-level image features commonly used by computer vision algorithms (RQ2). Participants agreed on a core set of primary image properties defining each subjective attribute but some attributes were more conceptually diffuse than others (RQ3). The properties participants identified for a specific subjective attribute did not substantially overlap, suggesting discriminative power for computer vision algorithms (RQ4).
[image:10.612.66.286.589.658.2]We also explored three types of explanations for explaining the algorithm’s reasoning about subjective attributes. Participants understood the information-rich Map explanation reasonably well, but also had problems understanding some of the features that were important to the algorithm (RQ5). Participants focused on adjusting feature and segment importance, but their understanding of the algorithm, influenced by the type of explanation they saw, ultimately affected the types of corrective feedback they gave (RQ6).
Figure 7: The average number of times participants said each feature was important (dark blue, positive) or unimportant (dark blue, negative) and the number of participants who said they did not understand that feature
(light blue). -4!
Our results provide evidence that end users could interactively help computer vision algorithms recognize subjective attributes of objects in images. We also introduced new open questions for how to develop interactive vision algorithms and interfaces for this recognition task. Our work is a first step toward enabling vision algorithms that explain their reasoning to end users, respond appropriately to corrective feedback from the user, and support users by expanding the scope of vision systems to include subjective, user-defined attributes—from simply “is there a car?” to “is this car cool?”
ACKNOWLEDGMENTS
Removed for anonymous review. REFERENCES
1. Arbelaez, P., Maire, M., Fowlkes, C., Malik, J., Contour Detection and Hierarchical Image Segmentation,
Transactions on Pattern Analysis and Machine Intelligence, 33(5), IEEE (2011), 898-916.
2. Culotta, A., Kristjansson, T., McCallum, A. and Viola, P. Corrective feedback and persistent learning for information extraction. Artificial Intelligence 170 (2006), 1101-1122.
3. Dalal, N. and Triggs, B. Histograms of oriented gradients for human detection. In Proc. CVPR, IEEE (2005), 886-893.
4. Druck, G., Mann, G., and McCallum, A. Learning from labeled features using generalized expectation criteria. In Proc. SIGIR, ACM (2008), 595-602.
5. Fails, J. and Olsen, D. A design tool for camera-based interaction. In Proc. CHI, ACM (2003), 449-456. 6. Farhadi, A., Endres, I., Hoiem, D., and Forsyth, D. A.
Describing objects by their attributes. In Proc. CVPR, IEEE (2009), 1778-1785.
7. Farhadi, A., Endres, I. and Hoiem, D. Attribute-centric recognition for cross-category generalization. In Proc. CVPR, IEEE (2010), 2352-2359.
8. Johnson-Laird, P. N. Mental Models: Towards a Cognitive Science of Language, Inference, and Consciousness. Cambridge University Press (1983). 9. Kulesza, T., Wong, W.-K., Stumpf, S., Perona, S.,
White, R., Burnett, M., Oberst, I., and Ko, A. J. Fixing the program my computer learned: barriers for end users, barriers for the machine. In Proc. IUI, ACM (2009), 187-196.
10.Kulesza, T., Stumpf, S., Burnett, M., Wong, W., Riche, Y., Moore, T., Oberst, I., Shinsel, A., McIntosh, K. Explanatory debugging: Supporting end-user debugging of machine-learned programs. In Proc. VL/HCC, IEEE (2010), 41-48.
11.Lim, B. Y., Dey, A. K., and Avrahami, D. Why and why not explanations improve the intelligibility of context-aware intelligent systems. Proc. CHI, ACM (2009).
12.Lowe, D. Distinctive image features from scale-invariant keypoints. Int. J. Computer Vision, (2004). 13.McCallum, A. K. MALLET: A Machine Learning
Toolkit. (2002) http://mallet.cs.umass.edu. 14.Everingham, M., Van Gool, L., Williams, C. K. I.,
Winn, J., Zisserman, A. The PASCAL Visual Object Classes Challenge 2010 (VOC2010) Results.
http://www.pascal-network.org/challenges/VOC/voc2010/workshop/index. html
15.Polanyi, M. The Tacit Dimension, New York: Anchor Books (1967).
16.Raghavan, H. and Allan, J. An interactive algorithm for asking and incorporating feature feedback into support vector machines. In Proc. SIGIR, ACM(2007), 79-86. 17. Settles, B. Active learning literature survey. Technical
Report 1648, University of Wisconsin-Madison, Madison, WI, (2009).
18.Stumpf, S., Rajaram, V., Li, L., Wong, W-K., Burnett, M., Dietterich, T., Sullivan, E., and Herlocker, J. Interacting meaningfully with machine learning systems: Three experiments. Int. J. Human-Computer Studies 67, 8(2009), 639-662.
19.Sutton, C. and , A. An introduction to conditional random fields for relational learning. In Introduction to Statistical Relational Learning, (2007).
20.Talbot, J., Lee, B., Tan, D., and Kapoor, A. EnsembleMatrix: Interactive visualization to support machine learning with multiple classifiers. In Proc. CHI, ACM (2009), 1283-1292.
21.Tullio, J., Dey, A.K., Chalecki, J., and Fogarty, J. How it works: A field study of non-technical users interacting with an intelligent system. In Proc CHI, ACM (2007). 22.Welinder, P., Branson, S., Belongie, S., and Perona, P. The multidimensional wisdom of crowds. Advances in Neural Information Processing Systems 23, (2010), 2424-2432.
23.Wong, W-K., Oberst, I., Das, S., Moore, T., Stumpf, S., McIntosh, K., and Burnett, M. End-user feature labeling: A locally-weighted regression approach. In
Proc. IUI, ACM (2011), 115-124.
24.Vijayanarasimhan, S. and Grauman, K. What’s it going to cost you? Predicting effort vs informativeness for multi-label image annotations. In Proc. CVPR, IEEE (2009), 2262-2269.
25.Yang, W., Cai, J., Zheng, J, and Luo, J. User-Friendly Interactive Image Segmentation Through Unified Combinatorial User Inputs. IEEE Transactions on Image Processing 19, 9(2010), 2470-2479.