D
EPARTMENT OFE
CONOMICSU
NIVERSITY OFS
TRATHCLYDEG
LASGOWUSE IT OR LOSE IT: IRISH EVIDENCE
B
YIRENE MOSCA AND ROBERT E WRIGHT
N
O16-04
S
TRATHCLYDE
1
Use It or Lose It: Irish Evidence
by
Irene Mosca (*)
The Irish Longitudinal Study on Ageing (TILDA) Trinity College Dublin
and
Robert E Wright Department of Economics
University of Strathclyde
March 2016
Abstract: A small but growing body of research suggests that retirement and cognitive decline are related. In fact, some have argued that retirement causes cognitive decline. The aim of this paper is to add to this literature using data of older women from The Irish Longitudinal Study on Ageing (TILDA). Ordinary least square (OLS) regressions show a significant negative association between retirement and cognitive functioning. These estimates are based on the assumption that retirement is exogenous. As retirement is potentially endogenous with respect to cognition, instrumental variable (IV) methods are also used. The instrument employed is the abolition of the so-called “Marriage Bar”. In simple terms, the Marriage Bar was the requirement that women leave paid employment on getting married. It was established in the 1930s and removed in the 1970s. When IV estimations are used, the effect of retirement on cognition is negative but statistically insignificant. Differences between OLS and IV estimates are compared with a standard test. OLS estimates are preferred as the null hypothesis of exogeneity of retirement cannot be rejected at conventional statistical levels.
Keys words: cognition, ageing, retirement JEL classification: J14, J26
2
Use It or Lose It: Irish Evidence
1. Introduction
It is universally agreed that population ageing is one of the key social and economic
challenges facing high-income countries. In these countries, life expectancy has increased
dramatically with people expecting to live many years after retirement. Large increases in the
number of people aged 65 and older are expected in the coming decades. However, only a
small share of people in this age group are in employment. In Ireland, for example, the
number of people aged 65 and older is expected to almost triple in the next four decades, with
currently only around 4.6% of women and 14% of men in this age group employed (CSO,
2011 and 2013). Given these numbers, it is not difficult to understand the serious financial
pressure this will put on the ability of governments to pay benefits targeted at older people
such as pensions.
Another important policy challenge caused by population ageing is the need to
preserve cognitive function (Hendrie et al., 2006). Cognitive function, or “cognition” for
short, is: “…an individual’s perceptions, memory, thinking, reasoning and awareness”
(O’Regan et al., 2010). It is the process of acquiring, storing, interpreting and using
information. Unfortunately, cognition declines in old-age. In particular, research suggests that
ageing is associated with a decline in the ability to perform specific cognitive tasks defined as
“fluid cognition” (e.g. Dixon et al., 2004; Schaie, 1994). Fluid cognition is: “…the capacity
to think logically and solve problems in novel situations, independent of acquired
knowledge” (Cattell, 1987).
As more people are living into older age, there are also more people living in the older
ages with cognitive decline (such as dementia). Cognitive decline makes it more difficult—
and eventually impossible—to maintain a self-sufficient lifestyle. For example, it has been
3
Alzheimer’s Disease International, 2012). Unsurprisingly, a recent survey indicated that
dementia is the most feared disease among Americans aged 55 and older (Gatz, 2007).
The causes of cognitive decline are still not well understood. In addition, at any given
age, there is considerable variation in cognition with “maintained function” and “dementia”
being the two extremes on a continuum of cognitive functioning. Although age is
undoubtedly an important factor in explaining cognitive decline, research shows that
age-related variation in cognition is only a fraction of the total between-person variation
(Salthouse, 2011, p.18). In other words, there are two key research questions. The first is
what factors are responsible for cognitive decline? The second is what factors are responsible
for the variation in cognition at a given age?
An influential conceptual framework for understanding why cognitive decline is not
homogenous has been put forth by Stern (2002, 2003). He assumes that some form of brain
damage or lesion occurs, due to normal aging or a pathological process. If one is willing tto
accept this assumption, then the focus comes to understanding why individuals cope with, or
react to, such damage, differently. There are two main hypotheses.The first states that coping
is a “passive process” with physiological factors being responsible for the degree to which the
brain responds. Individuals with more “brain reserve” (i.e. larger brain, more neurons and
more synapses) can sustain more damage before cognitive decline begins. The second
hypothesis states that coping is an “active” process. Coping relies on the capacity of the brain
to use networks more efficiently or recruit alternative networks or cognitive strategies.
Individuals with more capacity can tolerate more brain lesions before cognitive impairment
becomes apparent. Crucially, it is believed that this capacity is influenced by life-style
choices individuals make and/or by life-style changes they are required to make.
It is therefore not surprising that considerable attention is being paid to examining
4
investigated are those thought to require “cognitive stimulation”. These include “social
engagement” (such as visiting family or friends, membership in a sport club and membership
in a volunteer organisation), “active life-style” (such as physical activity and exercise and
travel for pleasure) and “leisure activity” (such as having a hobby, attending cultural events,
reading regularly, playing music, singing and attending classes and lectures). Lower rates of
cognitive decline have been observed for people who have more engagement of this type
(Fratiglioni et al., 2004). A meta-analysis of 22 studies found that adults who engage in such
activities are almost 50% less likely than adults with little or no cognitive engagement to
develop dementia (Valenzuela and Sachdev, 2006). However, there is little consensus on
which types of activities are the most cognitively stimulating (Salthouse, 2011, p. 145).
Economics is also making a contribution to understanding the factors that impact on
cognitive decline. There is a small—but growing—body of research suggesting that one way
to remain cognitively active is to work in the labour market. This suggests that there may be a
relationship between retirement and cognitive decline. In fact, some have argued that
retirement is a “cause” of cognitive decline. If this is the case, then continuing to work brings
clear benefits in terms of at least slowing the rate of cognitive decline. This possibility has
been referred to as “use it or lose it” hypothesis (see Rohwedder and Willis, 2010). The main
underpinning is that people who work engage in more mental exercise than retirees because
work environments provide more cognitively challenging and stimulating environments than
do non-work environments.
The remainder of this paper is organised as follows. The next section critically
reviews the research that has examined empirically the relationship between retirement
duration and cognitive decline. Section 3 is an empirical investigation of this relationship that
addresses some of the weaknesses of previous studies using data collected in The Irish
5
to cognition, instrumental variable (IV) estimation is used. The analysis is mainly based on
Irish women since the abolition of the so-called “Marriage Bar”, which restricted the
employment of women, is used as the identifying instrument in the IV estimation. Some
analysis for Irish men is also carried out for comparative purposes. Results are discussed in
Section 4. Conclusions follow in Section 5. The main finding for women is that there is a
negative and statistically significant relationship between retirement duration and cognition.
There is no evidence that retirement is endogenous. The findings are found to be robust to
alternative empirical specifications. However, the magnitude of this effect is very small. In
addition, under the assumption of exogeneity, a larger (but still small) relationship is found
for men.
2. Previous Research
Assessing the causal effect of retirement on cognition is complicated by two empirical
challenges. The first is unobserved heterogeneity, which arises because of the presence of
non-measured factors, which likely affects both the decision to retire and cognitive
functioning. Examples of such individual-specific factors are motivation, personality traits,
productivity and time preference. The second challenge is establishing the direction of
causality. One causal direction is the impact of retirement on cognition: retirement causes
cognitive decline. The other causal direction is the impact of cognition on retirement:
cognitive decline causes retirement. The key is to establish which (if any) causal direction
dominates since this has important implications for policy (as discussed in Section 5).
To our knowledge, there are only five economics-based studies that have focused
empirically on the “use it or lose it” hypothesis: Bonsang et al. (2012), Coe et al. (2012), de
Grip et al. (2015), Mazzonna and Peracchi (2012) and Rohwedder and Willis (2010). Four of
6
cognition. That is, on average the longer an individual has been retired, the lower their level
of cognition. However, as a group they generate conflicting evidence on whether retirement
causes cognitive decline. This hypothesis is supported by Mazzonna and Peracchi (2012),
Rohwedder and Willis (2010) and Bonsang et al. (2012), but receives only partial support
from de Grip et al. (2015). No support is found by Coe et al. (2012). One potential
explanation for the diversity of findings is differences in the statistical methodologies
employed to address the potential endogeneity of retirement.
With the exception of de Grip et al. (2015), these studies used instrumental variables
estimation (IV) in order to explore the endogeneity of retirement. This approach requires a
variable (referred to as an “instrument”) that is directly correlated with retirement decision
but only correlated with cognition indirectly through its effect on retirement. It also needs to
be “exogenous” in the sense that it is not a direct outcome of individual decision-making.
(The IV approach is described in more technical detail in Section 3). Rohwedder and Willis
(2010), Mazzonna and Peracchi (2012) and Bonsang et al. (2012) relied on changes in public
policies affecting the legislated early and normal ages of eligibility for a public old-age
pension to generate cross-country or cross-individual variation in retirement behaviour. We
argue that there are several problems with such an approach. A key one is that it assumes that
the policy changes are known and fully understood by individuals and such individuals act
upon these changes in an economically rational way. There is considerably doubt that this is
the case (Barrett et al., 2015).
Another potential explanation of the differences in findings in these studies relates to
the cognition variables used. With the exception of de Grip et al. (2015), the other studies
used cognitive variables that measure word recall, verbal fluency or numeracy tests in
face-to-face or telephone interviews. Measuring cognition in such a way has at least three
7
home), they are prone to differences in test effort by retired and employed individuals (de
Grip et al., 2015; Duckworth et al., 2011). Second, as respondents can witness the tests of
another household member before being interviewed, intra-household learning effects can
also occur (Mazzonna and Peracchi, 2012). Third, they do not measure important aspects of
fluid cognition such as processing speed or cognitive flexibility. The study of De Grip et al.
(2015) is the only study that investigated the effect of retirement on measures of fluid
cognition. In this study, the cognitive tests carried out in a hospital-lab setting were employed
as outcome variables.
With the exception of Mazzonna and Peracchi (2012), the existing studies did not
specify a model that distinguished between men and women. Coe et al. (2012) restricted the
analysis to men. Bonsang et al. (2012) and Rohwedder and Willis (2010) did not disaggregate
their analysis by gender. de Grip et al. (2015) presented results for men and women together
clarifying that they also estimated models for men and women separately and found no
significant differences. As the employment histories of women are generally more
intermittent than those of men, largely due to the impact of child-bearing and rearing, we
argue that it is crucial to analyse men and women separately.
As a consequence, the main focus of this paper is the impact of retirement duration on
cognitive decline amongst women. In fact, we believe that more can be learned about this
relationship from the experience of women rather than men. The main reason is that a more
convincing IV estimation strategy can be constructed based on the experience of Irish women
than for Irish men. However, estimates are also provided for men for comparative purposes.
3. Methodology
8
The data-set used in this paper to assess whether retirement affects cognition is The
Irish Longitudinal Study on Ageing (TILDA). TILDA is a nationally representative sample of
community dwelling individuals aged 50+ resident in Ireland and collects information on the
economic, health and social aspects of the respondents’ lives. It is modelled closely on the
Health and Retirement Study (HRS), the English Longitudinal Study on Ageing (ELSA) and
the Survey of Health, Retirement and Ageing in Europe (SHARE). The main analysis of this
paper is based on data from the third wave of TILDA. Data from the first and second waves
are also employed to construct the relevant variables or for robustness checks. The first wave
of data was collected between October 2009 and July 2011. A total of 8,504 participants were
recruited. Of these, 8,175 were aged 50+ and 329 were younger partners of eligible
individuals.
Respondents first completed a computer-assisted personal interview (CAPI) in their
own homes and were invited to travel to one of two health centres (based in Trinity College
Dublin and University College Cork) for a comprehensive health assessment. If unable or
unwilling to travel to one of the health centres, respondents were offered a modified and
partial assessment in their own home. All assessments were carried out by qualified and
trained research nurses. Of the 8,175 participants aged 50 and older, 5,897 underwent a health
assessment (85% in one of the dedicated health centres and 15% in their own home). The
availability of home-based health assessments likely reduced the potential selection bias
associated with the need to travel to a health centre (Savva et al. 2013). For more detail on the
first wave of TILDA ad health assessments see Whelan and Savva (2013) and Cronin et al.
(2013).
The second wave of data was collected between April 2012 and January 2013 and a
response rate of 86% was achieved (Dooley et al, 2014). Respondents completed a CAPI in
9
component of the study was reintroduced at Wave 3. Respondents were given the choice to
undertake the assessment either in their own home or in the dedicated health centre in Trinity
College Dublin (the centre in University College Cork was closed). The third wave of data
(CAPI interviews) was collected between March 2014 and October 2015. A response rate
was 85%. A total of 5,395 respondents undertook the health assessment (80% in the Trinity
College Dublin health centre and 20% in their own home).
3.2. Statistical Model
As explained above, testing the hypothesis that retirement affects cognition is
complicated by the potential problems of unobserved heterogeneity and reverse or two-way
causation. In our statistical model, we assume that cognition, “Cog”, is a function of
retirement duration, “RetDur”, and a vector of other controls, “Xj” (such as j = age and
education) and an error term, “u”. In regression form:
𝐶𝑜𝑔𝑖 = 𝛽0+ 𝛽1𝑅𝑒𝑡𝐷𝑢𝑟𝑖 + ∑ 𝛽𝑗 𝑗𝑋𝑖𝑗+ 𝑢𝑖 (1)
where the subscript “i” denotes the individual, i = 1,2,…,N. If there is a negative relationship
between retirement and cognition, one would expect β1 < 0. That is, people with a longer
retirement duration have lower cognition after controlling for other factors thought to affect
cognition.
If RetDur is correlated with u, then OLS estimates of β1 will be biased and
inconsistent. This is the problem of the “potential endogeneity of retirement duration”. In
order to address endogeneity, a process is needed that generates exogenous variation in
RetDur. Instrumental variables estimations (IV) can be used to incorporate this variation into
the estimation in order to “purge” the relationship of this bias. Key to IV estimation is the
10
two key properties: (1) Variation in Z is associated with variation in RetDur; and (2) Variation
in Z is not associated with variation in Cog (apart from the indirect route via RetDur). If one
has available a variable that satisfies these properties, then one can estimate the following
regression:
𝑅𝑒𝑡𝐷𝑢𝑟𝑖 = 𝜋0 + 𝜋1𝑍𝑖 + ∑ 𝜋𝑗 𝑗𝑋𝑖𝑗+ 𝑤𝑖 (2)
where RetDur is as a function of Z,Xj and an error term “w”. Byestimating this “first stage”
regression, one can then form predictions for RetDur:
𝑅𝑒𝑡𝐷𝑢𝑟̂ 𝑖 = 𝜋̂ + 𝜋0 ̂ 𝑍1 𝑖 + ∑ 𝜋𝑗 ̂ 𝑋𝑗 𝑖𝑗 (3)
As can be seen in Eq. (3), the unobservable component is purged and the variation in RetDur
that is not correlated with u has been used to identify parameters.
Finally, one can use OLS to estimate the so-called “second-stage” regression:
𝐶𝑜𝑔𝑖 = 𝑏0+ 𝑏1 𝑅𝑒𝑡𝐷𝑢𝑟̂ 𝑖 + ∑ 𝑏𝑗 𝑗 𝑋𝑖𝑗+ 𝑒𝑖 (4)
where predicted values of RetDur from Eq. (3) are used. Assuming all assumptions are met,
the error term in this regression, “e”, is random and not correlated with RetDur. If this is the
case then Eq. (4) will provide an unbiased estimate, “b1”, of the relationship between
retirement duration and cognition. More importantly, it will provide an estimate of the causal
impact of retirement duration on cognition. On the other hand, if b1 = β1 (which is a testable
hypothesis), then retirement duration is exogenous, and OLS provides such an estimate. The
11
3.3 Variables
3.3.1. Cognition
In TILDA, cognition is measured both in a face-to-face interview (CAPI) and in a
medical centre-based health or home-based assessment (HA). The HA includes a battery of
in-depth pen-and-paper and computer-based tasks probing global cognition, verbal memory,
attention, processing speed and executive function. Crucially, all these tests are administered
and scored by specifically-trained qualified nurses. They are also the first tests each
respondent is asked to perform during the assessment to avoid the problem of fatigue
potentially influencing the results. The CAPI interview comprises tests of verbal and
prospective memory and verbal fluency. These are shorter than the tests administered in the
heath assessment and are primarily verbally administered by a team of specifically-trained
interviewers.
We believe that the choice of what cognitive measures to use is critical in the
evaluation of the relationship between retirement duration and cognition. In fact, it is our
view that the lack of consensus in this respect has contributed to the mixed empirical results
of the existing literature. We also believe that the cognitive tests carried out in the HA are
preferable to the cognitive tests administered as part of the CAPI interview. Centre-based HA
measures are less prone to intra-households learning effects and to differences in test effort
by employed and retired individuals. Both are more likely to occur in the more informal, and
less controlled, setting of the respondent’s home (de Grip et al., 2015; Duckworth et al.,
2011). Home-based HA measures are also less prone to these two effects as they are
administered by trained and qualified nurses as opposed to CAPI interviewers who are not
12
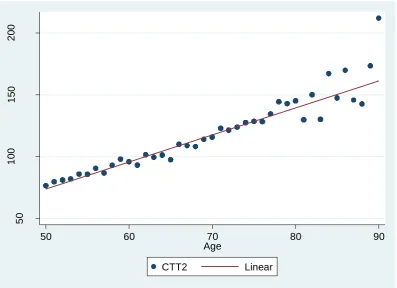
Among the different cognitive tests administered in the HA, the “Color Trail Task 1”
(CTT1) and the “Color Trail Task 2” (CTT2) are best suited to address our research question.
These two tests measure key aspects of fluid cognition. More specifically, CTT1 captures
visual scanning and processing speed while CTT2 captures visual scanning, attention, and
mental flexibility, thereby making it an executive function task (D’Elia et al, 1996).
Executive function includes “a set of cognitive skills that are responsible for the planning,
initiation, sequencing, and monitoring of complex goal-directed behaviour” (Royall et al.,
2002). In our view, all these components have a clear and intuitive link with tasks that form
most types of work. In fact, one would expect mental flexibility, processing speed, initiation
and sequencing to be central to effectively carrying out employment-based tasks.
Focusing on how these tests are administered and scored, respondents are handed a
sheet of paper containing numbers in yellow or pink circles. For the CTT1, respondents are
instructed to rapidly draw a line connecting the circles numbered 1 through 25 in consecutive
order, using a pencil. Respondents complete a practice trial prior to proceeding with the
actual CTT1. Respondents are told to perform the task as quickly as possible without making
errors. If an error is made, the nurse administering the test points it out and instructs the
respondent to correct the error and proceed with the task. Up to 10 seconds are allowed for
the respondent to make a connection between one circle and the next. After the 10 second
period has elapsed, the nurse provides a non-verbal prompt (i.e. by pointing) indicating the
position of the next correct circle. In the CTT2, respondents are asked to connect numbered
circles alternating between pink and yellow circles, e.g., pink 1, yellow 2, pink 3. The
respondent then completes a practice trial before proceeding with the CTT2. The performance
indicator is time taken to successfully complete CTT1 and the time taken to successfully
13
At Wave 3 interview, 2,956 women undertook the health assessment. Of these, 2,889
successfully completed CTT1 in either a centre-based health assessment (N = 2,343) or a
home-based health assessment (N = 546). A total of 65 women who successfully completed
CTT1 could not complete CTT2. Figures 1 and 2 plot the age-profile of average test scores
separately for CTT1 and CTT2 for the women in our sample. As expected, the time taken to
successfully complete the tests increases with age, indicative of cognitive decline.
<<<< Figures 1 and 2 About Here >>>>
3.3.2. Retirement Duration
During the CAPI interview, respondents were asked to report the status that best
described their current labour market situation. The choices are: (1) retired; (2) employed; (3)
self-employed; (4) unemployed; (5) permanently sick or disabled; (6) looking after home or
family; (7) in education or training; and 8) other. It should be noted that these are self-reports:
respondents were asked to choose the response that “best” described their situation. They
could only select one status since they were designed to be mutually exclusive. A total of
34.5% of women in the sample were employed or self-employed and another 40.5% were
retired at Wave 3 interview. A total of 19.4% were looking after home or family. A further
5.6% were permanently sick or disabled, 3.1% were unemployed and 1.9% in education or in
the other category.
In the economics literature, there are several definitions of retirement. Our definition
is based on the economic convention of working or not “for pay”. Therefore, an individual is
“retired” if she was not working for pay at the time of the Wave 3 interview. Retired women
are those who chose categories (1) and (4) to (8). Working women are those who chose in
categories (2) and (3). Thus strictly speaking, our study analyses the effect of “not working
for pay” at older ages. Robustness checks concerned with the reliability of our definition are
14
whether they had done any paid work in the week prior to the interview. Women who
reported to have done some paid work in that week (N = 56), as well as respondents who
reported to have never worked (N = 160), were excluded from the sample.
Respondents who chose categories (1) and (4) to 8) were asked to report the month
and year when they stopped working. “Retirement duration” is defined as the time elapsed
between the date the respondent stopped working and the date of the health assessment for
that respondent. Retirement duration in full months was calculated and converted to years of
retirement for ease of interpretation. For those at work, retirement duration was set to zero.
As information on labour market status was also collected at Waves 1 and 2 in a similar form,
this information was used to construct a more robust measure of retirement duration,
especially when inconsistent answers were provided across the three waves. Retirement
duration could not be calculated for 117 women because of missing information, and these
women needed to be excluded from the sample.
3.3.3. Control Variables
In addition to retirement duration, additional control variables were included. These
include age and education as well as a set of variables aimed at capturing childhood
characteristics. The main aim was to keep the list of control variables to those that are clearly
exogenous and not subject to same endogeneity considerations as retirement duration. This
was primarily achieved by selecting variables measured when the respondent was young.
The relationship between education and cognition has been studied extensively in the
literature. It is clear that there is a positive relationship between education and cognition.
Evidence that education affects cognition in later-life has been found in a number of studies,
including Banks and Mazzonna (2012) and Schneeweis et al. (2014). Since most schooling
15
labour market, it is exogenous. In our analysis, education, “School”, is measured in years of
schooling completed.
Several childhood characteristics have been shown to be associated with cognition in
later-life (Brown, 2010; Borenstein et al, 2006; Everson-Rose et al., 2003). In our analysis,
we use a set of dummy variables based on respondent’s self-reporting of childhood
conditions before the age of 14. They are: NoBooks=1 if there were no or very few books in
the home the respondent grew up in (0=otherwise); PoorHealth = 1 if the respondent was in
fair/poor health (0=otherwise); PoorFam = 1 if respondent grew up in a poor family
(0=otherwise); MothNotWork = 1 if respondent’s mother never worked outside the home
(0=otherwise); and FatherNotWork = 1 if respondent’s father never worked outside the home
(0=otherwise). For 37 women, information is missing on one or more of these variables, and
these women needed to be excluded from the sample.
The final samples are 2,519 women for the model based on CTT1 and 2,481women
for model based on CTT2. Descriptive statistics for retirement duration and the controls
variables are given in Table 1. The average age for women in the sample is 66 years and the
average retirement duration is 12 years. The mean number of years of schooling completed is
around 12. 34% of respondents reported that there were few or no books in the home they
grew up in. Only 6% reported their health was poor when they were aged less than 14. Only
15.4% reported growing up in a poor household. 70% of respondents reported that their
mother never worked outside the home when they were aged less than 14. This compares to
only 6.5% for fathers.
<<<< Table 1 About Here >>>>
16
In our analysis, exogenous variation is generated by the abolition of the so-called
“Marriage Bar”. In simple terms, the marriage bar was the legal requirement that women
leave paid employment in certain sectors on getting married. It was established in the 1930s,
a time of high unemployment amongst males, and abolished in the 1970s. It was justified by
the Irish Government as a policy aimed at reducing male unemployment and it was intended
to limit households to one income earner, “one man one job”. It applied mainly to
white-collar occupations, in both the public and private sectors, rather than to industrial or service
occupations. However, there is evidence that it was practised by many employers not legally
required to comply with the law.
The marriage bar was established for primary school teachers in 1933, for civil
servants in 1956 and for female police officers in 1958. A similar bar applied in many
semi-state and private organisations, such as Aer Lingus, Jacobs Biscuits and Guinness Brewers.
Data from the 1961 Census show that at least two thirds of the female labour force were
employed in sectors or occupations where the marriage bar was enforced. Women who had to
resign on getting married were often received a cash payment from the organisation/company
they were working for, which was presented to them by a member of the senior management
in a spirit of congratulations (Connolly, 2003). Married women could only be reinstated in
cases of hardship, meaning where they could prove desertion (Pyle, 1990).
The marriage bar for primary schooling teaching was lifted in 1958 on the basis that
teaching would not prevent a married woman from carrying out “her duties and obligations in
regard to the creation and maintenance of a home”. The marriage bar was removed
completely over the four year period 1973-1977. In 1973 it was rescinded for the Civil
Service and it was later removed by the Local Authorities and Health Authorities. In 1977,
discrimination in employment on the grounds of sex or marital status was made illegal.
17
getting married. A similar ban was enforced, for example, in the United Kingdom and the
Netherlands. The ban was, however, abolished much earlier in these countries.
Ireland is unique in the duration of the enforcement of the marriage bar, as
discrimination on the basis on marriage was made illegal only in 1977. Many women who
were affected by the marriage bar are still alive and are in the TILDA sample. In Wave 3,
women were asked the following question: “Did you ever have to leave a job because of the
marriage bar?”. For women in occupations covered by the marriages bar, leaving
employment was not a “choice”. We believe it generates both a unique and exogenous source
of variation in retirement duration. Of the 2,519 women in our final sample, 318 reported
they had to leave a job because of the marriage bar.
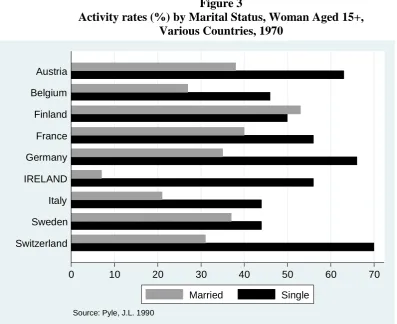
The instrument used in our analysis is a dummy variable, “MarBar”, coded “1” if a
woman reported having to leave employment on getting married and “0” otherwise. We
believe that this variable conceptually satisfies the requirement of being a “good instrument”
for two reasons. The first is that it is clearly exogenous since it was (albeit irrational and
sexist) a Government decision. The second is that there is no evidence that it forced women
to “choose” between either working or getting married. For example, Figure 3 shows female
activity rates by marital status (married versus single) in 1970 in Ireland and other countries.
It is clear that while activity rates of single women in Ireland were closely aligned to activity
rates of single women in other countries, married women in Ireland were significantly less
likely to be active than in the other countries in focus. This suggests that “an exogenous
factor” preventing married women from working in Ireland was present.
<<<< Figure 3 About Here >>>>
Additional evidence consistent with this view is shown in Figures 4 to 6. Figure 4
shows the proportions of never married and married women calculated from the TILDA and
18
“never married” women is very small, suggesting that marriage was the norm for women
born in the first half of the 20th century. Figure 5 shows the historical crude marriage rate and
the general marriage rate for Ireland. One would expect that if women were “forced” to
choose between marriage and work, then after the abolition of the marriage bar the marriage
rate would increase. As the figure shows, if anything, the marriage rate stabilised and then
decreased after the abolition of the marriage bar. That is, it moved in the opposite direction.
Finally, Figure 6 shows that the participation rate of married women doubled from 1971 to
1975, jumping from 7.5 percent to 14.5 percent. Since this sharp response was not the result
of demographic changes, it reflects the termination of this constraint on labour force
participation of married women in those occupations closed to them by the marriage bar.
<<<< Figures 4, 5 and 6 About Here >>>>
4. Results
4.1. Main Empirical Findings
Table 2 shows the OLS regression estimates for CTT1 and CTT2, respectively. Both
variables were transformed by taking the natural logarithm in order ensure normality of the
residuals. The transformed scores were then multiplied by “-1”. Therefore, a higher value of
these transformed variables suggests a higher level of cognitive functioning and vice versa,
which makes interpretation of the estimates more intuitive.
<<<< Table 2 About Here >>>>
The coefficient of RetDur is negative for both cognition measures, which is consistent
with the hypothesis that a longer retirement duration is associated with lower cognition. Even
though these associations are statistically significant at the 1% level, the magnitude is very
small. An additional year of retirement corresponds to a 0.19% reduction in CTT1 and a
0.14% reduction in CTT2. In fact, these associations are very small when compared to the
19
expected, the coefficient of Age is negative for both cognition measures and is statistically
significant at the 1% level, suggesting that cognition declines with age. However, the
magnitudes of these associations are at least 10 times larger than for RetDur. The age
estimates suggest that an additional year of age is associated with a 2.1% reduction in CTT1
and a 1.7% reduction in CTT2. Likewise, the coefficient of School is positive and statistically
significant at the 1% level for both cognition measures. More schooling is associated with a
higher cognitive functioning. The estimates suggest that an additional year of schooling is
associated with a 1.1% increase in CTT1 and a 1.3% increase in CTT2.
As a group, the remaining variables included in the regressions should proxy well the
socio-economic conditions in the home in which the respondent grew up in. As mentioned
above, there is research that suggests that early-life conditions impacts on later-life cognition.
However, only two of these five variables are statistically significant. There appears to be no
impact of self-reported poor family background (PoorFam), having a mother who never
worked outside the home (MothNotWork), and having afather who never worked outside the
home (FatherNotWork). This said, the signs of these coefficients are all negative, which is
consistent with a positive impact of early-life socio-economic conditions on cognition.
Stronger support for this hypothesis is found for the variable “growing up in a household with
no or few books”. The coefficient of NoBooks is negative and statistically significant at the
1% level for both cognition variables. The magnitude of this association is sizeable—
cognition is around 5.7% lower for CTT1 and 8.4% lower for CTT2 growing up in a
household with no or few books. However, it is not clear if this is a socio-economic effect or
an early-reading effect. Self-reported health is also important. The coefficient of PoorHealth
is negative and statistically significant at the 1% level. The magnitude of this association is
also sizeable. Having poor health in childhood implies a 7.1% lower value for CTT1 and a
20
caused by economic conditions but also by factors largely independent of
socio-economic conditions (such as contagious disease).
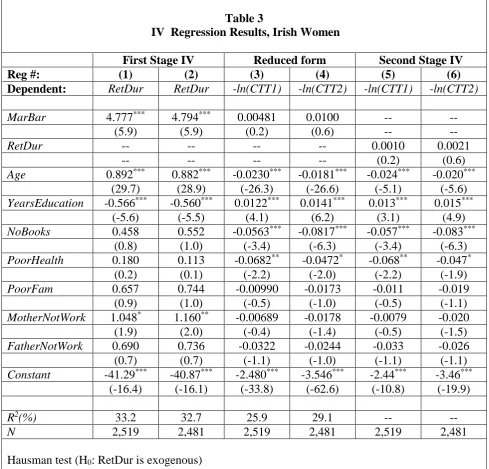
The estimates in Table 2 are based on the assumption that retirement duration is
exogenous. The IV estimates that test for the potential endogeneity are shown in Table 3.
This table shows the “first stage”, “reduced form” and “second stage”, or IV, estimates. As
discussed above, the instrument employed is whether the women reported having to leave a
job because of the marriage bar. Columns 1 and 2 show the first-stage for CTT1 and CTT2.
There are only slight differences between the two columns because of the small differences in
sample sizes. It is clear that MarBar is an important predictor of RetDur. The coefficient of
MarBar in both equations is positive, large in magnitude and statistically significant at well
below the 1% level (t-statistics in both of 5.9). In short, women who had to leave work
because of the marriage bar have a longer retirement duration (or more correctly a longer
current period of not working) even after controlling for age and education. The requirement
that the instrument must be a “strong” predictor of the potentially endogenous variable is
clearly satisfied.
<<<< Table 3 About Here >>>>
Unfortunately, it is not possible to directly test the second requirement, which is that
there is no relationship between the MarBar and any other determinant of cognition, which
would be captured in the error term in Eq. (1). However, some information can be obtained
by considering the reduced-form regressions. In these regressions, CTT1 and CTT2 are
expressed as a function of the MarBar and of the other variables. These estimates are shown
for CTT1 and CTT2 in Columns 3 and 4 of Table 3. MarBar is not statistically significant in
either regression. It fact, the t-statistics are very small—0.2 and 0.6 for CTT1 and CTT2,
21
causal relationship between the instrumental variable and the outcome of interest is unlikely
to exist (Angrist and Krueger, 2001; French and Popovici, 2011).
Finally, Columns 5 and 6 in Table 3 show the estimates of the second-stage regression
results for CTT1 and CTT2, respectively. For both cognition measures, the coefficient of
RetDur is negative but not statistically significant at the 10% level. Differences between the
estimators of the OLS and IV models are compared by employing the Hausman test. If OLS
and IV estimators are found to have a different probability limit, then there is evidence that
endogeneity is present and OLS estimators will be inconsistent. If OLS and IV estimators are
found to have the same probability limit, then there is no evidence that endogeneity is
present. Both estimators will be consistent and OLS estimation is preferred. The results of the
Hausman test is given in the Table 3. For both cognition measures, the χ2 values are not
statistically significant. This implies that the null hypothesis that retirement duration is
exogenous cannot be rejected at any level of statistical significance. This leads us to conclude
that the OLS estimates are preferred. More generally, there is no statistical evidence that
retirement duration is endogenous.
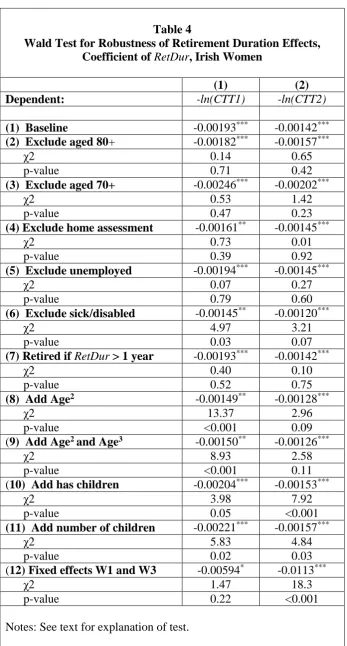
4.2. Robustness Checks
In order to consider the robustness of the findings, a set of additional regressions are
estimated. The focus is on whether the coefficient of RetDur is significantly different in
magnitude under these alternative specifications compared to what is found in the OLS
“baseline” regressions (Table 2). Regressions are fit with restricted samples or with
different/modified lists of explanatory factors. A Wald test is used to test the cross-equation
restriction that the coefficient of RetDur from each of these regressions is not statistically
different from the coefficient of RetDur of the baseline regression. Results of these tests are
summarised in Table 4.
22
There are two tests that consider how robust the estimate of RetDur is to excluding
“older” women from the sample. This is done by restricting the sample to women less than
age 80, and then to women less than age 70. In both sample restrictions, the coefficient of
RetDur remains negative and statistically significant at the 1% level. The Wald test confirms
that these estimates are not statistically different to the baseline estimates.
The next test excludes those women who performed the health assessment in their
homes. A priori, one might expect these women to be different from those who travelled to
the health centre in Trinity College Dublin to undertake the health assessment. In this sense,
the women who undertook the health assessment in the health centre may be a self-selected
sample. When the sample is restricted in this way, the coefficient of RetDur remains negative
and statistically significant at the 5% level or lower. The Wald test confirms that these
estimates are not statistically different to the baseline estimates.
There are three tests that examine how robust the estimate of RetDur is to different
definitions of retirement. The first excludes unemployed women from the sample. The second
excludes sick and disabled women from the sample. The third defines as being retired those
who have a retirement duration of at least one year. When unemployed women are excluded,
the coefficient of RetDur remains negative and statistically significant at the 1% level, with
the Wald test confirming that the estimates are not statistically different to the baseline
estimates. When the sick and disabled are excluded, the coefficient of RetDur remains
negative but is smaller in magnitude. The Wald test confirms that this difference is
statistically significant at the 5% level for CTT1 and 10% level for CTT2. However, in our
view, these small estimated effects are only slightly smaller than the already very small
effects estimated by OLS in the baseline model. The estimates appear to be robust to the
23
In the baseline estimates, age is assumed to impact on cognition in a linear manner,
which implies a constant “on average” percentage decline with age. There is some evidence
that the relationship between age and cognition is non-linear, declining with age but at a
diminishing rate. In order to explore this, regressions were estimated with quadratic and cubic
terms in age added as explanatory factors. As Table 4 suggests, the hypothesis of
non-linearity is supported. The table shows the point estimate of the coefficient of RetDur
evaluated at the mean age of the sample. In all cases, this effect is negative. The Wald test
indicated that this estimate is smaller than the baseline estimate at the 10% level or below in
three of the four tests carried out. However, examination of the predicted relationship
between age and cognition implied by these quadratic and cubic specifications of age suggest
that the turning points are beyond the age of 90, implying a negative relationship across the
age range observed in the sample.
The empirical focus has been on the impact of time not working since the woman
stopped working the “final time”. There is no information in TILDA about employment
earlier in the woman’s life since detailed life histories have not been collected. It is
reasonable to hypothesize that time out of work earlier in life might impact on later-life
cognition. This is explored by including variables relating to whether the woman has
children. The first is a dummy variable for whether she has children or not while the second
is the number of children. Since it was common in Ireland for women to stop working when
they had children, such variables might proxy time out of the labour force when younger. As
Table 4 shows, the coefficient of RetDur is negative and statistically significant at the 1%
level. The Wald test suggests that these estimated effects are larger than the baseline
estimated effects at the 5% level of lower. Although this is not shown in Table 4, it is
interesting to note that the coefficients of the variables, capturing whether the woman has
24
implying that having children has a positive impact on later-life cognition, a finding needing
further investigation.
As a final robustness check, the longitudinal dimension of the data is used in an
attempt to control for time-invariant but persistent differences across individuals. Both
measures of cognition were collected at Wave 1. In addition, it is possible to calculate
retirement duration at Wave 1 based on the same definition. Given the date of the health
assessment differs across the waves (i.e. for all individuals it is not exactly four years), age
also varies. Therefore it is possible to fit the following “first difference” regression, for both
CTT1 and CTT2, that differences out persistent differences: ∆-lnCTT(k)= a + b1∆RetDur +
b2∆Age + e, where ∆CTT(k) is the between waves (-ln) difference in the value of the two
cognition measures (k=1,2); ∆RetDur isthe between wave difference in retirement duration;
∆Age is the between wave difference in age; and e is a random error term. Since the
remaining explanatory factors are time-invariant, they do not enter into the specification.
As Table 4 shows, for ∆CTT1 the parameter of ∆RetDur is negative and statistically
significant at the 10% level. For this cognition measure, the Wald test suggests that this
estimate is not different to the baseline estimate at the 10% level. For ∆CTT2, the parameter
of ∆RetDur is negative and statistically significant at the 1% level. The Wald test suggests
that this effect is considerably larger (more negative) than the baseline estimate at the 1%
level. The baseline estimates implies that ∆CTT2 declines on average by 0.14% per year of
age. The first difference estimate suggests that this effect is much larger, a decline of 1.1%
per year of age.
4.3. Results for Men
We now briefly compare the estimates obtained for women to those for men. Since
the marriage bar is not relevant to men, we cannot explore the potential endogeneity of
25
retirement duration is exogenous. Following the same inclusion criteria as for women, the
sample consists of 2,091 men.
The distribution of labour market status for men, not surprisingly, is different from
that of women. A total of 72.4% of men in the sample were employed or self-employed and
another 19.2% were retired at Wave 3 interview. These compare to 34.5% and 40.5%,
respectively, for women. Also, virtually no men were “looking after the home” whereas
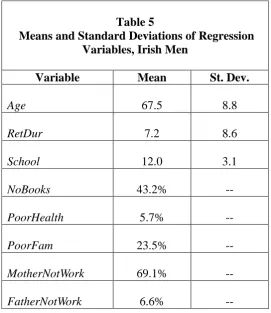
almost 20% of women self-reported being in this category. Descriptive statistics for
retirement duration and the other controls are shown in Table 5. The average age for men in
our sample is 67.5 and the average retirement duration is 7.2 years.
<<<< Table 5 About Here >>>>
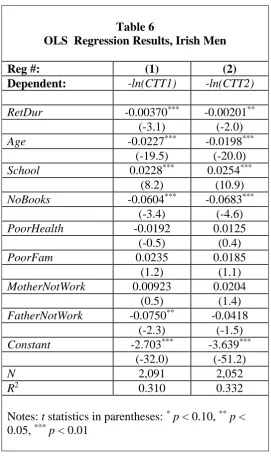
Table 6 shows OLS estimates for CTT1 and CTT2, respectively. The results are
similar to women. The key estimates are the coefficients of RetDur, Age and School. The
coefficient of RetDur is negative and statistically significant at the 5% level or below. The
coefficient of Age is also negative and statistically significant at the 1% level. Finally the
coefficient of School is positive and statistically significant at the 1% level. Table 7 expresses
the coefficients of these three variables in percentage terms for both women and men. For
both cognitive measures, the effect of retirement duration is more negative for men compared
to women. In fact, the effects are around twice as large for men but still small in percentage
terms.
<<<< Tables 6 and 7 About Here >>>>
The impact of age is similar for men and women. In addition, the impact of age for
both women and men is considerably larger than the impact of retirement duration. There is a
big difference between women and men with respect to the impact of schooling. For both
measures of cognition, the positive impact of schooling for men is twice that of women.
26
worth of more empirical investigation, the results for men confirm the results for women in
that the impact of retirement duration on cognition is very small.
5. Conclusions
Previous research has identified a negative relationship between retirement duration
and cognition. It appears that on average people who have been retired longer have lower
(fluid) cognition even after other factors known to impact on both, such as education and age,
are held constant. However, there is less agreement, and even less good empirical evidence,
about whether this observed statistical relationship is a causal relationship. Both directions of
causation are feasible. The so-called “use it or lose it” hypothesis emphasises the causal
impact of retirement on cognition, with the state of retirement itself being one of the factors
responsible for cognitive decline in old age. However, an alternative view is that cognitive
decline results in older people being less capable of carrying out the tasks and responsibilities
of their job. In economic terms, cognitive decline causes “productivity decline”, which is in
itself one of the factors contributing to the retirement decision.
It is important to establish which one—if either—of these causal directions are more
important since the policy implications are different. If retirement causes cognitive decline,
then policies that help older workers remain in their current job are potentially a way of
“slowing” cognitive decline. If cognitive decline causes retirement, then policies that help
older workers remain in employment are also warranted. However, given the productivity of
these workers is declining, it is unlikely that they will be able to stay employed in their
current job. These workers will need to be employed in jobs that match closer their
productivity that has been reduced through cognitive decline. However, our finding suggest
that the latter causal direction is of limited importance.
In keeping with other studies, our analysis finds a negative statistical relationship
27
finding of larger effects for men is consistent with the view that the transition between
professional activity and retirement seems to be steeper for men compared with women,
perhaps as a results of men being more work-catered than women and family centrality being
greater for women than for men (Sharabi and Harp, 2001). This suggests that there is likely
considerable value in analysing differences between men and women separately. Studies that
have grouped men and women together have likely masked important differences between
them. In addition, it should not be assumed that the findings for men are representative of
women.
The employment histories for men and women are considerably different. In
most high income countries, it is typical for men to work uninterrupted from the time that
they complete schooling to the time that they retire, with ill-health and unemployment being
the main factors causing deviation from this pattern. The pattern for women is typically
different since children often result in mothers leaving the labour force, often for a
considerable period of time (e.g. until children reach school age). Our findings indicate that
“time not working”, measured from the last time a woman stopped working, has a negative
association with cognition. If it is the case that “time not working” does have an impact on
cognition, it is likely that time not working earlier in the life-cycle will also have an impact.
Therefore, it is important to analyse how the time spent out of the labour force, associated
with children, impacts on later-life cognition since it is not a rare event in the lives of a large
number of women. Interestingly in our analysis, the children exhibit a positive association
with cognition. It could be the case that the positive impact that child-rearing has on
cognition outweighs the negative impact of time not working. This is a new, and potentially
important, hypothesis that needs to be explored. However, to do this with rigour would
require the collection of detailed employment and life histories, which are not usually a
28
In our analysis we used cognition measures that we believe best capture the aspects of
cognition most relevant to the execution of tasks typically required by most forms of paid
employment. Previous studies simply use the cognition measures included in the data-set
with little if any justification. In this sense, the findings of these studies may be an outcome
of using cognition measures that are not relevant or measured with error. More research is
needed to develop cognition measures more relevant to this problem, and these measures
should routinely be included in ageing studies.
In closing, the purpose of this paper was to examine empirically the relationship
between retirement and cognition amongst older Irish women, and to a lesser extent amongst
older Irish men. Statistical analysis, based on a set of precise assumptions, suggests that at
least for women, the impact of retirement duration on cognition is causal, which is consistent
with the “use it of lose it” hypothesis. However, it must be stressed that these effects are very
small, if not tiny, when compared to the effects of age or education. In other words, it is
extremely unlikely that working into old age has much of an impact on slowing cognitive
decline amongst older people.
29
References
Angrist, J.D. and A.B. Krueger, (2001), “Instrumental Variables and the Search for
Identification: from Supply and Demand to Natural Experiments”, Journal of
Economic Perspectives, vol.15, no. 4, pp. 69-85
Banks, J. and F. Mazzonna, (2012), “The Effect of Education on Old Age Cognitive
Abilities: Evidence from a Regression Discontinuity Design”, Economic
Journal, vol. 122, no. 560, pp. 418-448
Barrett, A., I. Mosca and B. Whelan, (2015), “How Well-Informed are Pension
Scheme Members on Their Future Pension Benefits? Evidence from Ireland”,
Journal of Aging and Social Policy, vol. 27, no. 4, pp. 295-313
Bonsang, E., S. Adam and S. Perelman, (2012), “Does Retirement Affect Cognitive
Functioning?”, Journal of Health Economics, vol. 31, no. 2, pp. 490-501
Borenstein, A.R., C.I. Copenhaver and J.A. Mortimer, (2006), “Early-life Risk
Factors for Alzheimer Disease”, Alzheimer’s Disease & Associated Disorders,
vol 20, no. 1, pp. 63-72
Brown, M.T., (2010), “Early-Life Characteristics, Psychiatric History, and Cognition
Trajectories in Later Life”, The Gerontologist, doi:10.1093/geront/gnq049
Cattell, R.B., (1987), Intelligence: Its Structure, Growth and Action, Amsterdam,
North-Holland
Central Statistics Office, (2011), Survey on Income and Living Conditions. Thematic
Report on the Elderly 2004 and 2009,Dublin: Central Statistics Office
Central Statistics Office, (2013), Population and Labour Force Projections
30
Coe, N.B., H.M. von Gaudecker, M. Lindeboom and J. Maurer, (2012), “The Effect
of Retirement on Cognitive Functioning”, Health Economics, vol. 21, no. 8,
pp. 913-927
Connolly, E., (2003), “Durability and Change in State Gender Systems. Ireland in the
1950s”, The European Journal of Women’s Studies, vol. 10, no. 1, pp. 65-86
Cronin, H., C. O’Regan, P. Kearney, C. Finucane and R.A. Kenny, (2013), “Health
and Ageing: Development of the TILDA Health Assessment”, Journal of
American Geriatrics Society, vol. 61, no s2, pp. S269-S278
D’Elia, L.F., P. Satz, C.L. Uchiyama and T. White, (1996), Color Trails Test.
Professional Manual. Odessa, FL: Psychological Assessment Resources
De Grip, A., A. Dupuy, J. Jolles and M. Van Boxtel, (2015), “Retirement and
Cognitive Development in the Netherlands: Are the Retired really Inactive?”,
Economics & Human Biology, vol. 19, no. 4, pp.157-169
Dixon, R.A., L. Bäckman and L.G. Nilsson, (2004), New Frontiers in Cognitive
Aging, Oxford University Press, Oxford
Dooley, C., (2014), “Methodology”, In: A. Nolan, C. O’Regan, C. Dooley, D.
Wallace, A. Hever et al., (eds.), The Over 50s in a Changing Ireland:
Economic Circumstances, Health and Well-Being, Trinity College Dublin
Duckworth, A., P. Quinn, D. Lynamc, R. Loeber and M. Stouthamer-Loeber, (2011),
“Role of Test Motivation in Intelligence Testing”, Proceedings of the
National Academy of Sciences of the United States of America, vol. 108, no.
19, pp.7717-7720
Everson-Rose, S.A., C.F. Mendes de Leon, J.L. Bienias, R.S. Wilson and D.A. Evans,
(2003), “Early Life Conditions and Cognitive Functioning in Later Life”,
31
Fratiglioni, L., S. Paillard-Borg and B. Winblad, (2004), “An Active and Socially
Integrated Lifestyle in Late Life Might Protect Against Dementia”, Lancet
Neurology, vol. 3, no. 6, pp. 343-353
French, M.T. and I. Popovici, (2011), “That Instrument Is Lousy! In Search of
Agreement when Using Instrumental Variables Estimation in Substance Use
Research”, Health Economics, vol. 20, no. 2, pp.127-146
Gatz, M., (2007), “Genetics, Dementia, and the Elderly”, Current Directions in
Psychological Science, vol. 16, no. 3, pp. 123-127
Hendrie H.C., M.S. Albert, M.A. Butters, S. Gao, D.S. Knopman et al., (2006), “The
NIH Cognitive and Emotional Health Project. Report of the Critical
Evaluation Study Committee”, Alzheimer’s & Dementia, vol. 2, no. 1, pp.
12-32
Mazzonna, F. and F. Peracchi, (2012), “Ageing, Cognitive Abilities and Retirement”,
European Economic Review, vol. 56, no. 4, pp. 691-710
Pyle, J.L., (1990), The State and Women in the Economy: Lessons from Sex
Discrimination in the Republic of Ireland, Albany, New York: State
University of New York Press
O’Regan, C., H. Cronin and R.A. Kenny, (2010), “Mental Health and Cognitive
Function”, In: A. Barrett, G. Savva, V. Timonen and R.A. Kenny (eds.), Fifty
Plus in Ireland 2011: First Results from The Irish Longitudinal Study on
Ageing (TILDA), Trinity College Dublin
Rohwedder, S. and R.J. Willis, (2010), “Mental Retirement”, Journal of Economic
Perspectives, vol 24, no. 1, pp. 119-138
Royall, D.R., E.C. Lauterbach, J.L Cummings, A. Reeve, T.A. Rummans et al.,
32
for Clinical Research. A Report from the Committee on Research of the
American Neuropsychiatric Association”, The Journal of Neuropsychiatry &
Clinical Neurosciences, vol. 14, no. 4, pp. 377-405
Salthouse, T.A., (2011), Major Issues in Cognitive Aging, Oxford University Press
Savva, G.M., S.C. Maty, A. Setti and J. Feeney, (2013), “Cognitive and Physical
Health of the Older Populations of England, the United States, and Ireland:
International Comparability of The Irish Longitudinal Study on Ageing”,
Journal of American Geriatrics Society, vol. 61, no. 2, pp. S291-S298
Schaie, K.W., (1994), “The Course of Adult Intellectual Development”, American
Psychologist, vol. 49, no. 4, pp. 304-313
Schneeweis, N., V. Skirbekk and R. Winter-Ebmer, (2014), “Does Education Improve
Cognitive Performance Four Decades After School Completion?”,
Demography, vol. 51, no. 2, pp. 619-643
Stern, Y., (2002), “What is Cognitive Reserve? Theory and Research Application of
the Reserve Concept”, Journal of the International Neuropsychological
Society, vol. 8, no. 3, pp. 448-460
Stern, Y., (2003), “The Concept of Cognitive Reserve: a Catalyst for Research”,
Journal of Clinical and Experimental Neuropsychology, vol. 25, no. 5, pp.
589-593
Valenzuela, M.J. and P. Sachdev, (2006), “Brain Reserve and Dementia: a Systematic
Review”, Psychological Medicine, vol. 36, no. 4, pp. 441-454
Whelan B.J. and G.M. Savva, (2013), “Design and Methodology of the TILDA
Study”, Journal of American Geriatrics Society, vol. 61, no. (s2), pp.
33
World Health Organization (WHO) and Alzheimer's Disease
34
Table 1
Means and Standard Deviations of Regression Independent Variables, Women
Variable Mean St. Dev.
Age (years) 65.8 9.0
RetDur (years) 12.0 15.7
School (years) 12.4 2.7
NoBooks 34.0% --
PoorHealth 6.1% --
PoorFam 15.4% --
MotherNotWork 70.1% --
35
Table 2
OLS Regression Results, Irish Women
Reg. #: (1) (2)
Dependent: -ln(CTT1) -ln(CTT2)
RetDur -0.00193*** -0.00142*** (-3.4) (-3.2)
Age -0.0211*** -0.0167*** (-21.2) (-21.6)
School 0.0111*** 0.0133***
(3.7) (5.8)
NoBooks -0.0555*** -0.0811***
(-3.3) (-6.3)
PoorHealth -0.0683** -0.0476**
(-2.2) (-2.0)
PoorFam -0.00944 -0.0172
(-0.4) (-1.0)
MotherNotWork -0.00444 -0.0156 (-0.3) (-1.2)
FatherNotWork -0.0313 -0.0240 (-1.0) (-1.0)
Constant -2.566*** -3.613*** (-33.6) (-61.2)
R2 (%) 26.2 29.4
N 2,519 2,481