Int. J. Electrochem. Sci., 8 (2013) 1316 - 1327
International Journal of
ELECTROCHEMICAL
SCIENCE
www.electrochemsci.orgThe Enhancement Role of ZnO Surface Modification on
Electrochemical Performance of Li
4Ti
5O
12/ZnO Composites
Ting Zhou1, Yingbin Lin1,*, Guiying Zhao1, Yandan Huang1,Heng Lai1, Jiaxin Li1, Zhigao Huang1,**, She-huang Wu2
1
College of Physics and Energy, Fujian Normal University, Fuzhou 350007, China
2
Department of Materials Engineering, Tatung University, 40, Changshan N. Rd., Sec. 3, Taipei 104, Taiwan
*
E-mail: [email protected]; [email protected]
Received: 24 November 2012 / Accepted: 15 December 2012 / Published: 1 January 2013
Li4Ti5O12/ZnO composites have been synthesized as anode material for lithium ion batteries by a
mechanical method and the effect of high electronic-conductive ZnO incorporation on the electrochemical performances of Li4Ti5O12 is investigated systematically by charge/discharge testing,
cyclic voltammograms and AC impedance spectroscopy, respectively. In comparison with the pristine Li4Ti5O12, Li4Ti5O12/ZnO demonstrates superior electrochemical performance in wide operation
temperatures, especially at high discharging rates. The analysis of the electrical properties and electrochemical measurements reveal that Li4Ti5O12/ZnO has much lower charge-transfer resistances
and higher lithium diffusion rate, especially at low temperature.
Keywords: Lithium-ion batteries; Lithium titanate; Zinc Oxide; High-rate capability; Photoluminescence.
1. INTRODUCTION
In recent years, an increasing attention has been paid to lithium ion batteries due to their potential applications in the field of hybrid electric vehicles (HEVs), plug-in hybrid electric vehicles and electrical energy systems [1-3]. Spinel Li4Ti5O12 is considered as an alternative anode material to
carbon-based materials because of its high structural stability during the discharge/charge processes and relatively high lithium insertion/extraction potential at approximately 1.55 V [4-6]. However, the intrinsic low lithium-ion conductivity and electronic conductivity of bulk Li4Ti5O12 have been major
obstacles to electrochemical extraction of lithium, which causes a steep falling in capacity at high rates [7, 8]. To improve the high rate performance of spinel Li4Ti5O12, Tremendous efforts have been
as carbon and Ag [9-11]. For instance, Guo et al. [9] found that the surface modified Li4Ti5O12 with
carbon exhibits high discharge capacity of 137 mAhg-1 at 20 C and remains 125 mAhg-1 after 100 cycles. Liu et al. [10] reported that the surface modified Li4Ti5O12 by Ag nanoparticles displays an
excellent high-rate capacity of 131 mAhg-1 at 30 C, retaining over 98% after 120 cycles. ZnO with enriching oxygen vacancies seems to be a promising alternative surface modification material for improving rate capability due to its high electronic conductivity, facile fabrication and low cost. In addition, ZnO is a promising anode material with high theoretical capacity of 978 mAhg-1 [12, 13]. Combining the above ideas, composing Li4Ti5O12 with high electronic conductive ZnO would be
reasonably beneficial for improving the rate capability and cyclic reversibility of Li4Ti5O12. In present
work, Li4Ti5O12/ ZnO is prepared by a simple ball-milling with incorporation of high electronic
conductive ZnO nanoparticles. In comparison with the pristine Li4Ti5O12, the as-prepared
Li4Ti5O12/ZnO demonstrates superior electrochemical performances in a wide temperature range,
especially at high C-rate.
2. EXPERIMENTAL
2.1. Materials synthesis
Li4Ti5O12 (lithium titanate) was prepared by a simple solid-state reaction method using
commercial TiO2 as the titanium source with 3wt% LiOH excess stoichiometry to compensate for
lithia volatilization during the high-temperature calcination. After planetary-milled in ethanol for 24 h and subsequently dried at 80 oC in air, the resulted precursor was calcined at 850 oC for 16 h to obtain spinel Li4Ti5O12 powders. (Li4Ti5O12)100/(ZnO)6 composite was prepared by mixing Li4Ti5O12 and
commercial ZnO nanoparticles (~ 50 nm) through a simple ball-milling approach. In detail, the as-prepared Li4Ti5O12 powder was ultrasonically dispersed in absolute ethanol containing an appropriate
amount of high electronic conductive ZnO nanoparticles. After sonication for 5 h, the reactant precursors were kept ball-milling in ethanol for 20 h and subsequently dried at 110°C in vacuum for 48 h to get the final product.
The phase indentification of the pristine Li4Ti5O12 and (Li4Ti5O12)100/(ZnO)6 powders was
conducted with an X-ray diffractometer (XRD, Rigaku MiniFlex II) using CuKα radiation (λ=0.15405
nm). The morphology of the composite powder was studied with a scanning electron microscopy (SEM, JSM-7500F, Japan).
2.2 Cell fabrication and characterization
The electrochemical performances of the as-prepared Li4Ti5O12 and (Li4Ti5O12)100/( ZnO)6
12 h. The cells based on the configuration of Li metal(-)︱electrolyte︱active material(+) were assembled in an argon-filled glove box with Celgard 2300 microporous polyethylene membrane as separator and 1M LiPF6 in a mixture of ethyl carbonate (EC) and dimethyl carbonate (DMC) (1:1 in
vol. ratio) as electrolyte. Charge-discharge performance was characterized galvanostatically on CT2001A cell test instrument (LAND Electronic Co.). Cyclic voltammograms (CV) and electrochemical impedance spectra (EIS) measurements were performed by Arbin 2000 testing system and electrochemical workstation (CHI660C) respectively. The EIS analysis was recorded within frequency ranged between 10 mHz to 100 KHz with an voltage amplitude of 5mV. Electrical properties were measured by a Versalab magnetometer (Versalab free, Quantum Design Co.).
3. RESULTS AND DISCUSSION
3.1 Material Characterization
10 20 30 40 50 60 70
(4
0
0
)
(3
3
1
)
(1
0
0
) (3
1
1
)
Li4Ti5O12 PDF#49-0207
2 / degree
In
d
e
n
sit
y
/
a
.
u
.
ZnO PDF#36-1451
(1
1
1
)
Sample B (110
)
(1
0
1
)
(0
0
2
)
(5
3
1
)
(4
4
0
)
(3
3
3
)
ZnO
[image:3.596.157.435.321.536.2]Sample A
Figure 1. XRD patterns of Sample A and B.
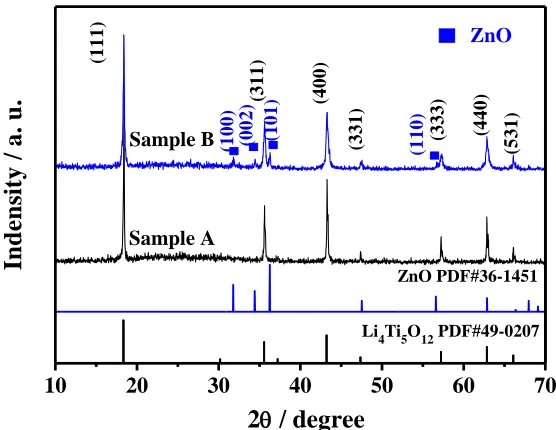
Fig.1 presents XRD patterns of the pristine and (Li4Ti5O12)100/(ZnO)6 powders, denoted as
Samples A and B, respectively. All the observed diffraction peaks for pristine powder can be indexed well based on a Li4Ti5O12 spinel phase with space group of Fd3m (PDF#49-0207). The diffraction
pattern of (Li4Ti5O12)100/(ZnO)6 is similar to those of the pristine sample, even though nano-sized ZnO
particles on the surface. Besides the main Li4Ti5O12 spinel phase, additional diffraction peaks are also
observed, which corresponds to the reflections of wurtzite ZnO (PDF#36-1451).
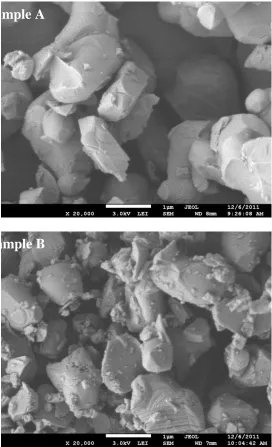
Figs. 2(a) and (b) show the surface morphologies characterized by SEM for the pristine and (Li4Ti5O12)100/(ZnO)6 composites, respectively. In comparison with the pristine Li4Ti5O12, nano-sized
ZnO particles are uniformly dispersed on the Li4Ti5O12 surface. Such ZnO-coating is expected to form
Figure 2. SEM images of (a) Sample A and (b) Sample B.
3.2 Electrochemical Performances
Fig. 3 presents the discharge capacities vs. cycle number of the pristine and (Li4Ti5O12)100/(ZnO)6 anodes at 0.5, 1, 2, 3 and 4C rate (1C = 170 mAhg-1) in a potential range from
1.0 to 3.0 V at 20oC. With the surface modification of ZnO nanoparticles, (Li4Ti5O12)100/(ZnO)6 (0.5C:
156 mAhg-1; 1C: 140 mAhg-1; 2C: 119 mAhg-1; 3C: 103 mAhg-1 ; 4C: 90 mAhg-1, respectively) demonstrates higher capacity than Sample A(0.5C: 145 mAhg-1; 1C: 109 mAhg-1; 2C: 73 mAhg-1; 3C: 45 mAhg-1 ; 4C: 36 mAhg-1, respectively), especially at high rate. The poor electron transfer activity among Li4Ti5O12 particles is considered to be responsible for the inferior electrochemical performance
of Li4Ti5O12. The increment in discharge capacity suggests that the surface modification with ZnO
would facilitate the electrochemical insertion/extraction process of Li+ ion, especially at high rate.
0 10 20 30 40 50
0 50 100 150 200
Cycle Number
D
is
c
h
a
r
g
e
c
a
p
a
c
it
y
/
m
A
h
g
-1
Sample A Sample B
@25OC
0.5C 1C 2C 3C 4C
[image:5.596.164.426.76.287.2]1.0 - 3.0 V
Figure 3. Rate capabilities of Samples A and B in a potential range from 1.0 to 3.0 V at 20 oC.
1.0 1.5 2.0 2.5 3.0
-0.6 0.0 0.6 1.2
Sample A
1.67V
1.65V
0.1mVs-1 @ 20oC
Sample B
Potential / V vs. Li+/Li
C
u
r
r
e
n
t
/
m
A
1.50V
1.50V
Figure 4. Cyclic voltammograms of Sample A and B between 1.0 and 3.0V at a scan rate of 0.1mVs-1 at 20oC.
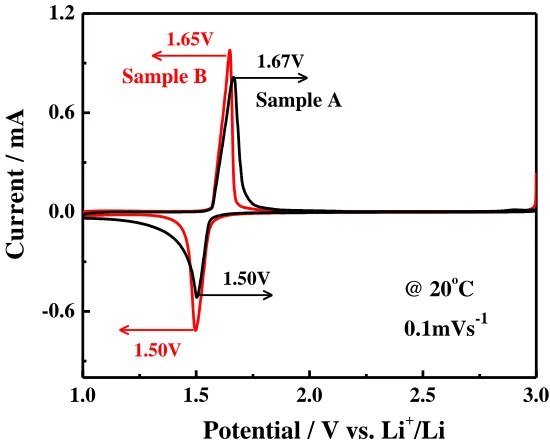
Cyclic voltammograms of Samples A and B at a scan rate of 0.1mVs−1 between 1.0 and 3.0V are shown in Fig. 4. A pair of anodic and cathodic peaks occurs at around 1.55V versus Li+/Li, corresponding to the typical characteristic of electrochemical lithium insertion/extraction of Li4Ti5O12
[14]. It is clear that both investigated electrodes have similar redox peaks, indicating that ZnO-incorporation does not change the electrochemical reaction process of Li4Ti5O12. However, CV profile
[image:5.596.158.433.349.569.2]
△V=150mV ) has lower potential difference than the pristine Li4Ti5O12 (△V=170mV), suggesting
that the incorporation of high electronic-conductive ZnO is favorable for reducing the electrode polarization.
0 20 40 60 80 100 120
0 30 60 90 120 150
-Z
"
/
o
h
m
Z' / ohm
Sample A Sample B
@ 20OC ( a )
-30 -20 -10 0 10 20 30 0.0
0.5 1.0 1.5 2.0 2.5
10
9 /
cm
-1
Temperature / oC
( b ) Sample A
[image:6.596.171.420.126.498.2]Sample B
Figure 5. ( a ) EIS profiles of Samples A and B after 50 cycles at the stable voltage of 1.55 V at 20 oC. Inset is the equivalent circuit used for fitting the experimental impedance data; ( b ) The temperature dependence of the electrical resistivities of Samples A and B.
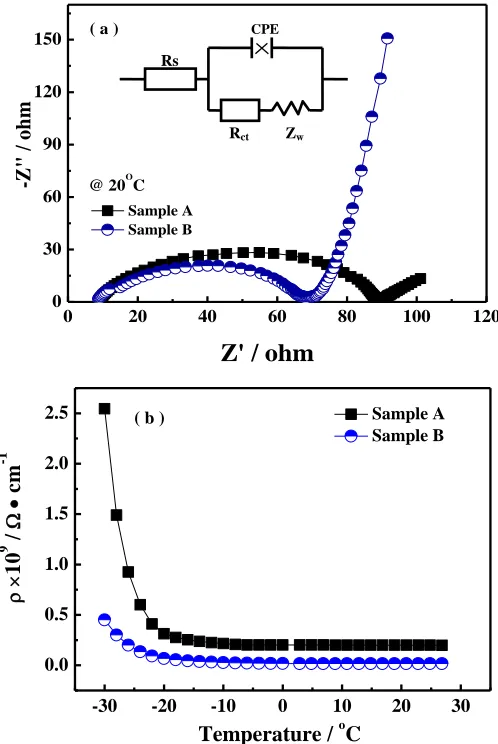
Fig.5(a) shows EIS impedance spectra of Samples A and B electrodes after 50 cycles, which are measured at the stable voltage of 1.55 V. EIS impedance spectra are fitted with the help of a modified Randle-Ershler equivalent circuit [15] (shown in the inset in Fig.5), where Rs and Rct are the solution resistance and charge transfer resistance, respectively. CPE is placed to represent the double-layer capacitance and passivation-film capacitance, and Zw is the Warburg impedance [16]. The fitted results reveal that Sample B electrode has smaller charge transfer resistance (Rct=56.09Ω) than that (Rct=73.56Ω) of Sample A. This might be due to the fact that (Li4Ti5O12)100/(ZnO)6 has higher
electronic-conductivity than the pristine Li4Ti5O12 with the presence of ZnO. Fig.5(b) presents the
temperature dependence of the electrical resistivity of Samples A and B, measured by a standard four-probe method from -30 oC to 27 oC. Both the testing sheets were made by pressing as-prepared powder under 20 MPa. It is found that Sample B has much smaller resistivity than Sample A in the whole
Rs
Rct Zw
operation temperature range, resulting in facilitating the electron transport in the electrochemical lithium insertion/extraction process.
To investigate the effect of ZnO on the reversibility of Li+ intercalation kinetics for Li4Ti5O12,
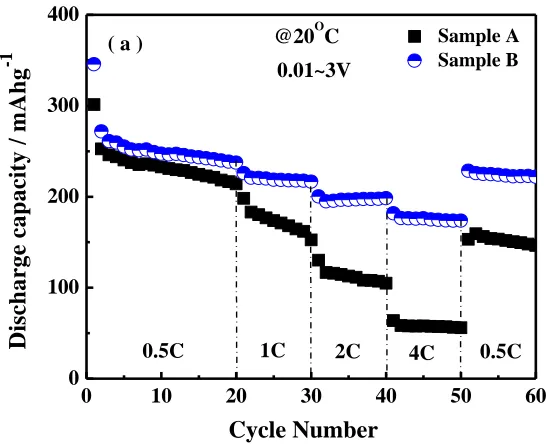
the electrochemical performances a potential range from 0.01 to 3 V are investigated. Fig.6 shows the cyclic performance of Sample A and B at 0.5, 1, 2, 3 and 4C rate at 20oC. In comparison with the pristine Li4Ti5O12, Sample B demonstrates higher capacity and superior rate performance, especially at
high charging/discharging rate. The larger initial discharge capacity of (Li4Ti5O12)100/(ZnO)6 over
theoretical capacity (298mAh-1) of Li4Ti5O12 might result from the lithiation in ZnO at low potential
range [17].
0 10 20 30 40 50 60
0 100 200 300 400
@20OC
0.5C
Cycle Number
D
is
c
h
a
r
g
e
c
a
p
a
c
it
y
/
m
A
h
g
-1
Sample A Sample B
0.5C 1C 2C 4C
[image:7.596.161.434.248.470.2]0.01~3V ( a )
Figure 6. Rate capabilities of Samples A and B in a potential range from 0.01 to 3.0 V at 20 oC.
0.0 0.5 1.0 1.5 2.0 2.5 3.0 -1.5
-1.0 -0.5 0.0 0.5 1.0 1.5 2.0
0.0 0.2 0.4 0.6 0.8 1.0 -0.4
-0.2 0.0 0.2
0.53 V 0.67 V
Sample B
C
u
r
r
e
n
t
/
m
A
Voltage / V
Sample A
0.1 mV s-1
[image:7.596.166.428.525.715.2]
Fig. 7 presents cyclic voltammograms of both samples with coin cell at a scan rate of 0.1 mVs
-1
. The figure clearly shows that there are two pairs of redox peaks for each sample between 0.01 and 3V, suggesting that ZnO-incorporation does not change the electrochemical reaction process of Li4Ti5O12. In comparison with Li4Ti5O12, the peaks at low potential (0.53V, 0.67V) of
(Li4Ti5O12)100/(ZnO)6, shown in the inset, further confirms the contribution of ZnO in the discharge
capacity of (Li4Ti5O12)100/(ZnO)6 composite when cycled between 0.01 and 3.0 V [17,18].
0 10 20 30 40
0 40 80 120 160
( a )
Cycle Number
D
is
ch
a
rg
e
ca
p
a
cit
y
/
m
A
h
g
-1
0.5C
1C
2C
3C
@ 20OC
1 - 3 V Sample BB
0 10 20 30 40 50
100 150 200 250 300 350
Sample BB ( b )
Cycle Number
D
is
ch
a
rg
e
ca
p
a
cit
y
/
m
A
h
g
-1 @20
O C
0.01~3V
[image:8.596.133.458.204.687.2]0.5C 1C 2C 4C
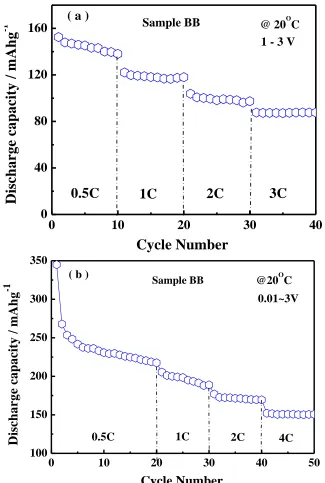
Figure 8. Rate capabilities of Samples BB in a potential range from (a) 1.0 to 3.0 V and (b) 0.01 to 3.0 V.
corresponding (Li4Ti5O12)100/(ZnO)6 is correspondingly prepared, denoted as Sample BB. Figs. 8 (a)
and (b) illustrate the discharge capacities of Sample BB at different discharge rates in a potential range from 1 to 3 V and 0.01 to 3 V, respectively. It is found that the specific capacities of Sample BB are superior to that of Sample A but inferior to that of Sample B in both cases, especially at high discharge current density. It is well-established that the electronic conductivity of ZnO is strongly dependent on the native point defects in ZnO, such as oxygen vacancies [19, 20]. The defects are assumedly reduced with thermal-treatment in oxygen atmosphere, leading to increase the resistivity of ZnO in composite. As a result, As a result, Sample BB with less oxygen vacancies in ZnO shows inferior rate capability in comparison with Sample B.
0 6 12 18 24 30
0 40 80 120 160
@ -20oC @ -30oC @ 0oC @ -10oC
@ 0oC
Cycle number
Sample A Sample B
D
is
ch
a
rg
e
C
a
p
a
ci
ty
/
m
A
h
g
[image:9.596.171.434.259.447.2]-1 0.4C charge/0.1C discharge
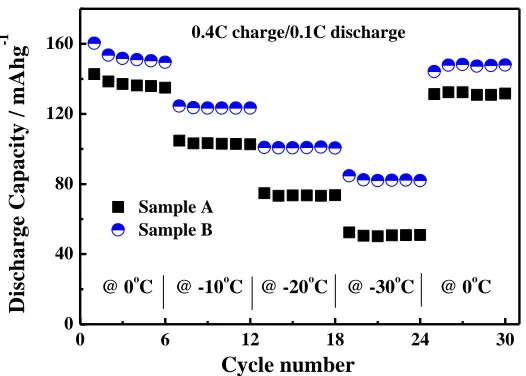
Figure 9. Cycling capabilities of Sample A and B at different temperature in a potential range from 1 to 3 V.
Excellent low-temperature performance of Li-ion battery is highly desired for specific applications [21]. Fig. 9 shows the rate capabilities of Samples A and B at various temperatures under 0.4C charge/0.1C discharge rate in a potential range from 1.0 to 3.0 V. Both electrodes exhibit relatively stable cycling stability resulting from the near zero volume variation during the charge/discharge process. In comparison, (Li4Ti5O12)100/(ZnO)6 (0 oC: 160.3 mAhg-1; -10 oC: 124.5
mAhg-1; -20 oC: 100.9 mAhg-1; -30 oC: 84.7 mAhg-1, respectively) shows better electrochemical performance than that of Li4Ti5O12 (0 oC: 142.7 mAhg-1; -10 oC: 104.7 mAhg-1; -20 oC: 74.7 mAhg-1;
-30 oC: 52.4 mAhg-1, respectively). Analysis from the temperature dependence of the electrical resistivity reveals (Li4Ti5O12)100/(ZnO)6 has much smaller resistivity than Li4Ti5O12 especially at lower
temperature, which is responsible for the superior low-temperature performance of Sample B.
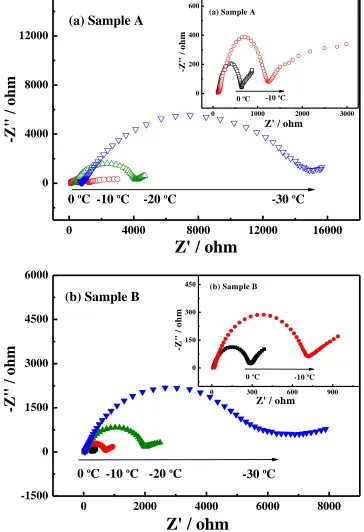
due to much more prominent resistance on the charge transfer reaction occurring at the electrode/electrolyte interface [21].
0 4000 8000 12000 16000
0 4000 8000 12000
0 1000 2000 3000 0
200 400 600
Z' / ohm
-Z
"
/
o
h
m
(a) Sample A
0 oC -10 oC
(a) Sample A
-30 oC
-20 oC
-10 oC
0 oC
Z' / ohm
-Z
"
/
o
h
m
0 2000 4000 6000 8000
-1500 0 1500 3000 4500 6000
0 300 600 900 0
150 300 450
Z' / ohm
-Z
"
/
o
h
m
(b) Sample B
0 oC
-10 oC
(b) Sample B
Z' / ohm
-Z
"
/
o
h
m
-30 oC
-20 oC
-10 oC
0 oC
Figure 10. EIS for (a) Sample A and (b) Sample B at the stable voltage of 1.55 V in different operation temperatures.
Moreover the Rct values of Sample B are all smaller than those of Sample A at various low
[image:10.596.114.478.128.660.2]
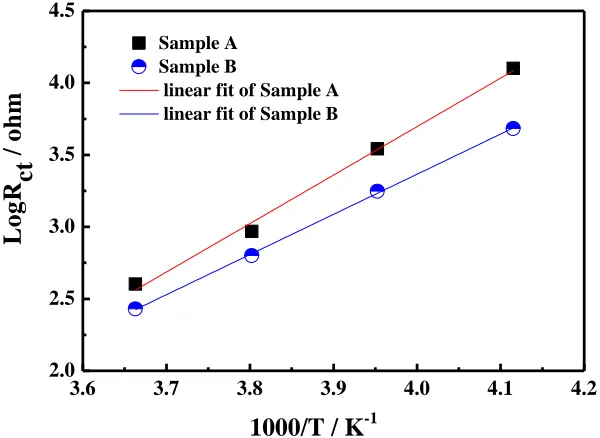
energy loss at low temperature, which is strongly dependent on the activation energy (G) of electrode reaction. The activation energy (G) can be calculated to characterize temperature (T) dependence of Rct quantificationally by the following equation [23]:
RT
R
G
A
R
ct303
.
2
log
log
(1)where R is the gas constant and A is a temperature-independent constant, respectively.
3.6 3.7 3.8 3.9 4.0 4.1 4.2
2.0 2.5 3.0 3.5 4.0 4.5
1000/T / K-1
L
o
g
R ct
/
o
h
m
Sample A Sample B
[image:11.596.145.445.237.456.2]linear fit of Sample A linear fit of Sample B
Figure 11. Profile of log(Rct) vs. temperature for Sample A and B.
The linear relationship between log Rct and T-1 for both samples is well revealed in Fig.11. The
calculated results mean that Sample B has lower values of G (61.73 kJmol-1) than that (72.84 kJmol
-1
) of Sample A. The higher the value of G is, the more the demanded energy for the intercalation/deintercalation of lithium-ion is. As a result, the surface reaction kinetics and electric conductivity of Li4Ti5O12 at low-temperature could be improved by the surface modification of high
electronic conductivity ZnO.
4. CONCLUSIONS
Li4Ti5O12 incorporated with high electronic-conductive ZnO is synthesized by a simple
mechanical method. Compared to Li4Ti5O12, (Li4Ti5O12)100/(ZnO)6 has superior rate and
low-temperature performances. Analysis from electrical and PL properties indicate that the oxygen-vacancy-enriched ZnO nanoparticle on Li4Ti5O12 should be an effective way on improving the
ACKNOWLEDGEMENTS
This work was supported by a grant from National Science Foundation for Young Scholars (No. 11004032) and Natural Science Foundation of China (No.11074039).
References
1. J. Jeong, Y. U. Kim, H. Kim, Y. J. Kim, H. J. Sohn, Energy Environ. Sci., 4 (2011) 1986. 2. B. Scrosati, J. Garche, J. Power Sources, 195 (2010) 2419.
3. I. Belharouak, G. M. Koenig Jr., K. Amine, J. Power Sources, 196 (2011) 10344.
4. T. F. Yi, L. J. Jiang, J. Shu, C. B. Yue, R. S. Zhu, H. B. Qiao, J. Phys. Chem. Solids 71 (2010) 1236.
5. A. S. Aricò, P. Bruce, B. Scrosati, J. M. Tarascon, W. van Schalkwijk, Nat. Mater. 4 (2005) 366. 6. G. N. Zhu, Y. G. Wang, Y. Y. Xia, Energy Environ. Sci., 5 (2012) 6652.
7. S. Scharner, W. Weppner, P. Schmid-Beurmann, J. Electrochem. Soc. 146 (1999) 857. 8. C. H. Chen, J. T. Vaughey, A. N. Jansen, D. W. Dees, A. J. Kahaian, T. Goacher, M. M.
Thackery, J. Electrochem. Soc. 148 (2001) A102.
9. X. F. Guo, C. Y. Wang, M. M. Chen, J. Z. Wang, J. M. Zheng, J. Power Sources 214 (2012) 107. 10. Z. M. Liu, N. Q. Zhang, Z. J. Wang, K. N. Sun, J. Power Sources 205 (2012) 479.
11. H. S. Li, L. F. Shen, X. G. Zhang, J. Wang, P. Nie, Q. Chen, B. Ding, J. Power Sources 221 (2013) 122.
12. H. B. Wang, Q. M. Pan, Y. X. Cheng, J. W. Zhao, G. P. Yin, Electrochem. Acta. 54 (2009) 2851. 13. J. P. Liu, Y. Y. Li, R. M. Ding, J. Jiang, Y. Y. Hu, X. X. Ji, Q. B. Chi, Z. H. Zhu, X. T. Huang, J.
Phys. Chem. C 113 (2009) 5336.
14. J. Q. Deng, Z. G. Lu, I. Belharouak, K. Amine, C. Y. Chung, J. Power Sources 193 (2009) 816. 15. K. Dokko, M. Mohamedi, M. Umeda, I. Uchida, J. Electrochem. Soc. 150 (2003) A425.
16. D. Yoshikawa, Y. Kadoma, J. M. Kim, K. Ui, N. Kumagai, N. Kitamura, Y. Idemoto, Electrochim. Acta, 55 (2010) 1872.
17. X. H. Huang, X. H. Xia, Y. F. Yuan, F. Zhou, Electrochem. Acta. 56 (2011) 4960. 18. H. Q. Dai, H. Xu, Y. N. Zhou, F. Lu, Z. W. Fu, J. Phys. Chem C, 116 (2012) 1519.
19. Ü. Özgür, Ya. I. Alivov, C. Liu, A. Teke, M. A. Reshchikov, S. Doğan, V. Avrutin, S.-J. Cho, and H. Morkoç, J. Appl. Phys. 98 (2005) 041301.
20. C. F. Yu, C. W. Sung, S. H. Chen, S. J. Sun, Appl. Surf. Sci. 256 (2009) 792.
21. T. Yuan, X. Yu, R. Cai, Y. k. Zhou, Z..p. Shao, J. Power Sources. 195 (2010) 4997. 22. S. H. Huang, Z. Y. Wen, B. Lin, J. D. Han, X. G. Xu, J. Alloys Compds. 457 (2008) 401. 23. J. Li, C. F. Yuan, Z. H. Guo, Z. A. Zhang, Y. Q. Lai, J. Liu, Electrochim. Acta, 59 (2012) 69.